Heritability and family-based GWAS analyses of the N-acyl ethanolamine and ceramide plasma lipidome
- PMID: 33437986
- PMCID: PMC8101358
- DOI: 10.1093/hmg/ddab002
Heritability and family-based GWAS analyses of the N-acyl ethanolamine and ceramide plasma lipidome
Abstract
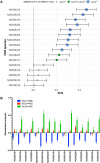
Signalling lipids of the N-acyl ethanolamine (NAE) and ceramide (CER) classes have emerged as potential biomarkers of cardiovascular disease (CVD). We sought to establish the heritability of plasma NAEs (including the endocannabinoid anandamide) and CERs, to identify common DNA variants influencing the circulating concentrations of the heritable lipids, and assess causality of these lipids in CVD using 2-sample Mendelian randomization (2SMR). Nine NAEs and 16 CERs were analyzed in plasma samples from 999 members of 196 British Caucasian families, using targeted ultra-performance liquid chromatography with tandem mass spectrometry. All lipids were significantly heritable (h2 = 36-62%). A missense variant (rs324420) in the gene encoding the enzyme fatty acid amide hydrolase (FAAH), which degrades NAEs, associated at genome-wide association study (GWAS) significance (P < 5 × 10⁻⁸) with four NAEs (DHEA, PEA, LEA and VEA). For CERs, rs680379 in the SPTLC3 gene, which encodes a subunit of the rate-limiting enzyme in CER biosynthesis, associated with a range of species (e.g. CER[N(24)S(19)]; P = 4.82 × 10⁻²⁷). We observed three novel associations between SNPs at the CD83, SGPP1 and DEGS1 loci, and plasma CER traits (P < 5 × 10⁻⁸). 2SMR in the CARDIoGRAMplusC4D cohorts (60 801 cases; 123 504 controls) and in the DIAGRAM cohort (26 488 cases; 83 964 controls), using the genetic instruments from our family-based GWAS, did not reveal association between genetically determined differences in CER levels and CVD or diabetes. Two of the novel GWAS loci, SGPP1 and DEGS1, suggested a casual association between CERs and a range of haematological phenotypes, through 2SMR in the UK Biobank, INTERVAL and UKBiLEVE cohorts (n = 110 000-350 000).
© The Author(s) 2021. Published by Oxford University Press.
Figures


Similar articles
-
Genetic factors shaping the plasma lipidome and the relations to cardiometabolic risk in children and adolescents.EBioMedicine. 2025 Feb;112:105537. doi: 10.1016/j.ebiom.2024.105537. Epub 2025 Jan 2. EBioMedicine. 2025. PMID: 39753034 Free PMC article.
-
Genetically determined serum urate levels and cardiovascular and other diseases in UK Biobank cohort: A phenome-wide mendelian randomization study.PLoS Med. 2019 Oct 18;16(10):e1002937. doi: 10.1371/journal.pmed.1002937. eCollection 2019 Oct. PLoS Med. 2019. PMID: 31626644 Free PMC article.
-
Circulating Ceramides Predict Cardiovascular Outcomes in the Population-Based FINRISK 2002 Cohort.Arterioscler Thromb Vasc Biol. 2016 Dec;36(12):2424-2430. doi: 10.1161/ATVBAHA.116.307497. Epub 2016 Oct 20. Arterioscler Thromb Vasc Biol. 2016. PMID: 27765765
-
Genetic architecture of human plasma lipidome and its link to cardiovascular disease.Nat Commun. 2019 Sep 24;10(1):4329. doi: 10.1038/s41467-019-11954-8. Nat Commun. 2019. PMID: 31551469 Free PMC article.
-
Genome-wide association study meta-analysis identifies three novel loci for circulating anti-Müllerian hormone levels in women.Hum Reprod. 2022 May 3;37(5):1069-1082. doi: 10.1093/humrep/deac028. Hum Reprod. 2022. PMID: 35274129 Free PMC article.
Cited by
-
Genetic and environmental determinants of variation in the plasma lipidome of older Australian twins.Elife. 2020 Jul 22;9:e58954. doi: 10.7554/eLife.58954. Elife. 2020. PMID: 32697195 Free PMC article.
-
Serine Palmitoyltransferase Subunit 3 and Metabolic Diseases.Adv Exp Med Biol. 2022;1372:47-56. doi: 10.1007/978-981-19-0394-6_4. Adv Exp Med Biol. 2022. PMID: 35503173 Review.
-
Untargeted serum metabolomic profiling for early detection of Schistosoma mekongi infection in mouse model.Front Cell Infect Microbiol. 2022 Aug 18;12:910177. doi: 10.3389/fcimb.2022.910177. eCollection 2022. Front Cell Infect Microbiol. 2022. PMID: 36061860 Free PMC article.
-
Recent Advances in Studying Age-Associated Lipids Alterations and Dietary Interventions in Mammals.Front Aging. 2021 Nov 19;2:773795. doi: 10.3389/fragi.2021.773795. eCollection 2021. Front Aging. 2021. PMID: 35822042 Free PMC article. Review.
-
Genetic factors shaping the plasma lipidome and the relations to cardiometabolic risk in children and adolescents.EBioMedicine. 2025 Feb;112:105537. doi: 10.1016/j.ebiom.2024.105537. Epub 2025 Jan 2. EBioMedicine. 2025. PMID: 39753034 Free PMC article.
References
-
- Demirkan, A., vanDuijn, C.M., Ugocsai, P., Isaacs, A., Pramstaller, P.P., Liebisch, G., Wilson, J.F., Johansson, Å., Rudan, I., Aulchenko, Y.S.et al. (2012) Genome-wide association study identifies novel loci associated with circulating phospho- and sphingolipid concentrations. PLoS Genet., 8, e1002490. - PMC - PubMed
Publication types
MeSH terms
Substances
Grants and funding
LinkOut - more resources
Full Text Sources
Other Literature Sources

