

Metabolomics analysis reveals altered metabolites in lean compared with obese adolescents and additional metabolic shifts associated with hyperinsulinaemia and insulin resistance in obese adolescents: a cross-sectional study
- PMID: 33438144
- PMCID: PMC7803706
- DOI: 10.1007/s11306-020-01759-y
Metabolomics analysis reveals altered metabolites in lean compared with obese adolescents and additional metabolic shifts associated with hyperinsulinaemia and insulin resistance in obese adolescents: a cross-sectional study
Abstract
Introduction: Hyperinsulinaemia and insulin resistance (IR) are strongly associated with obesity and are forerunners of type 2 diabetes. Little is known about metabolic alterations separately associated with obesity, hyperinsulinaemia/IR and impaired glucose tolerance (IGT) in adolescents.
Objectives: To identify metabolic alterations associated with obesity, hyperinsulinaemia/IR and hyperinsulinaemia/IR combined with IGT in obese adolescents.
Methods: 81 adolescents were stratified into four groups based on body mass index (lean vs. obese), insulin responses (normal insulin (NI) vs. high insulin (HI)) and glucose responses (normal glucose tolerance (NGT) vs. IGT) after an oral glucose tolerance test (OGTT). The groups comprised: (1) healthy lean with NI and NGT, (2) obese with NI and NGT, (3) obese with HI and NGT, and (4) obese with HI and IGT. Targeted nuclear magnetic resonance-based metabolomics analysis was performed on fasting and seven post-OGTT plasma samples, followed by univariate and multivariate statistical analyses.
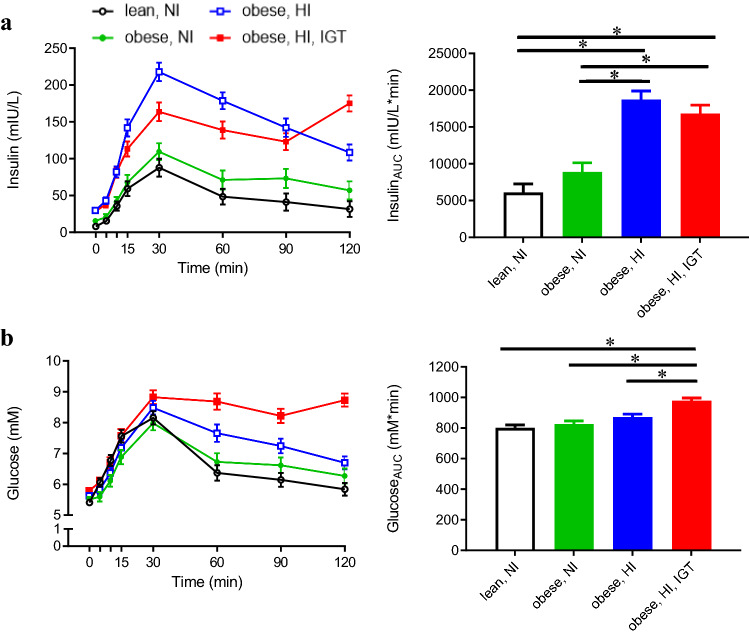
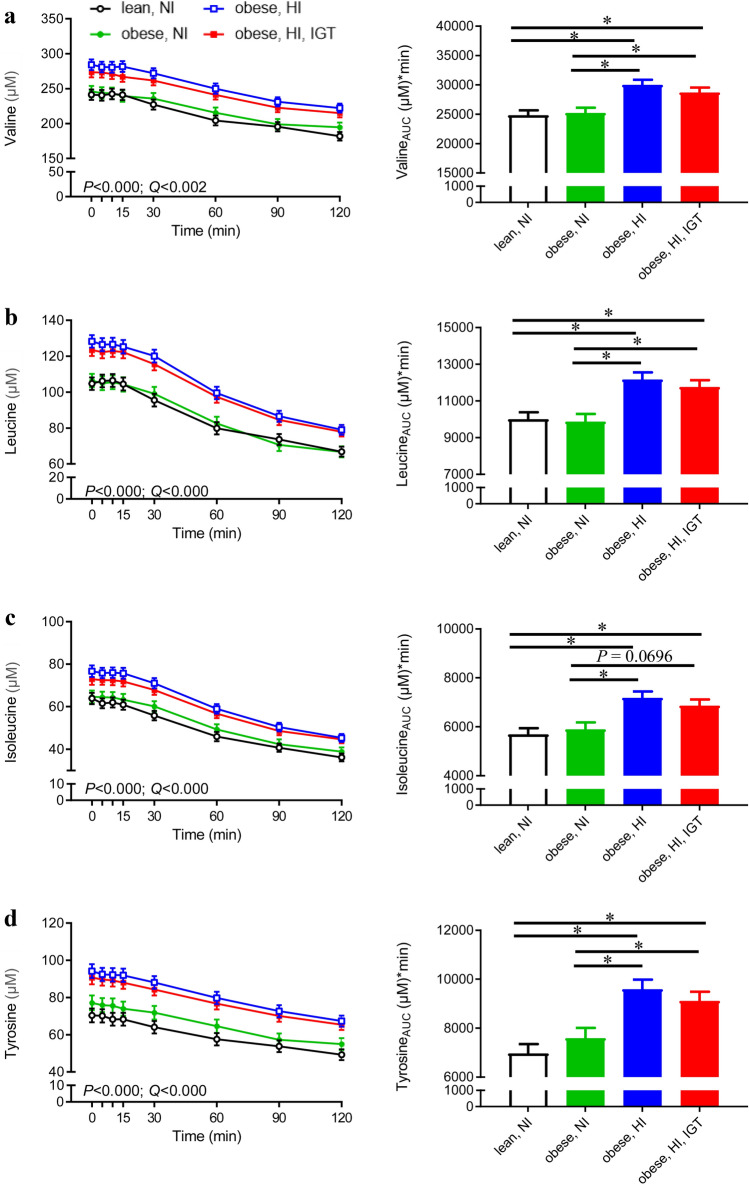
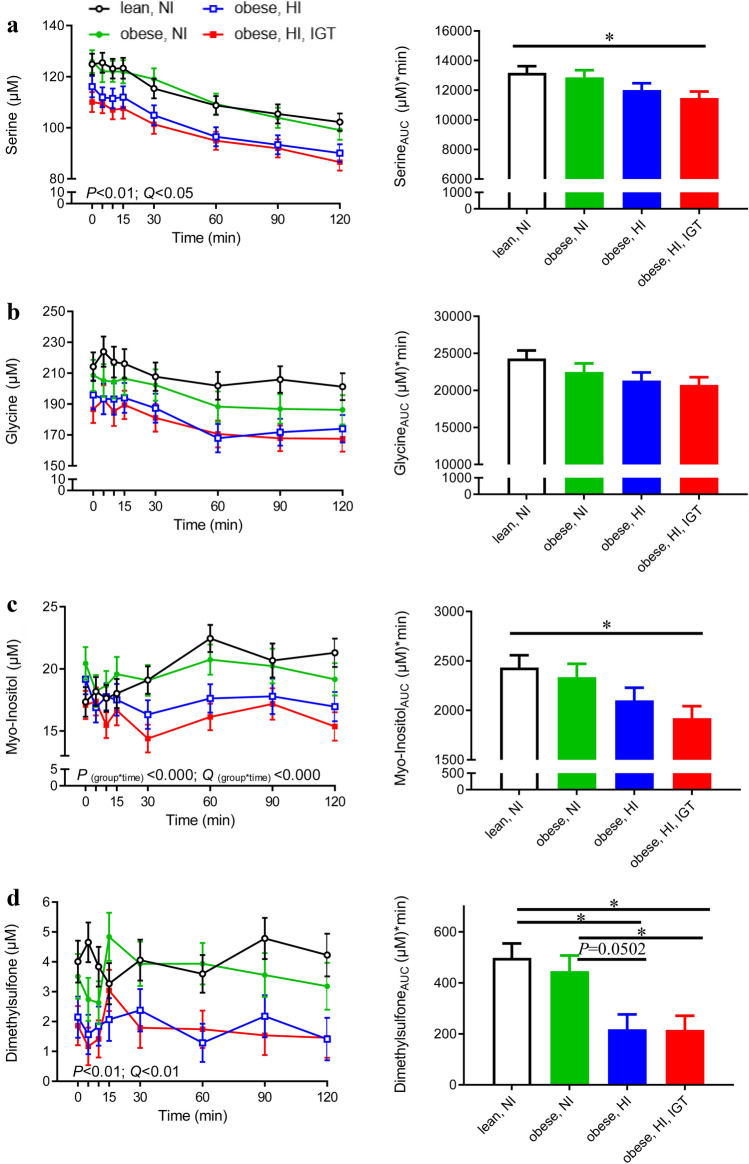
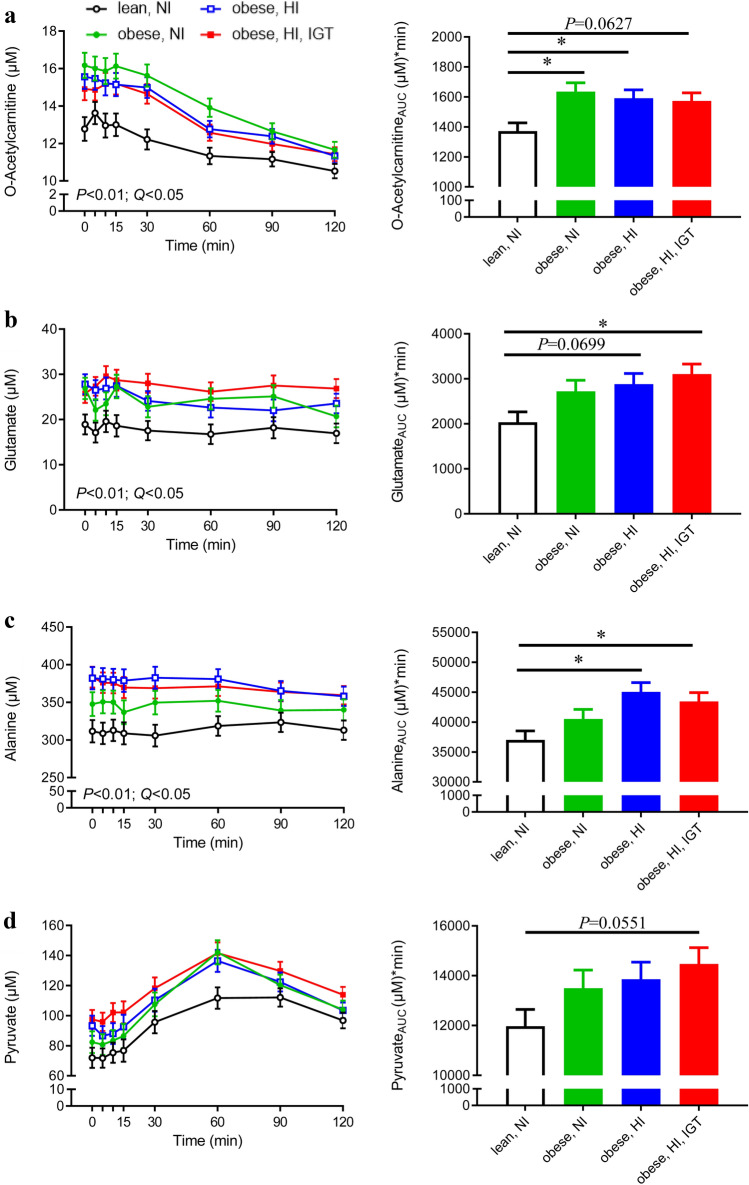
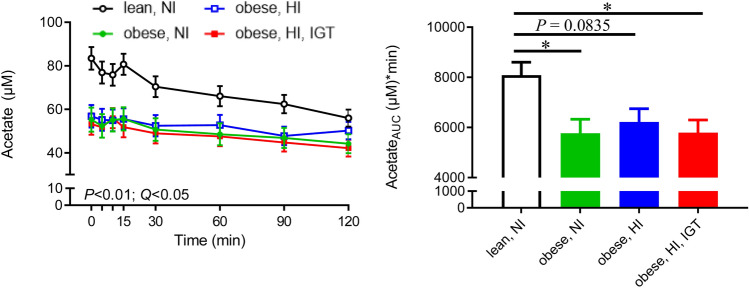
Results: Two groups of metabolites were identified: (1) Metabolites associated with insulin response level: adolescents with HI (groups 3-4) had higher concentrations of branched-chain amino acids and tyrosine, and lower concentrations of serine, glycine, myo-inositol and dimethylsulfone, than adolescents with NI (groups 1-2). (2) Metabolites associated with obesity status: obese adolescents (groups 2-4) had higher concentrations of acetylcarnitine, alanine, pyruvate and glutamate, and lower concentrations of acetate, than lean adolescents (group 1).
Conclusions: Obesity is associated with shifts in fat and energy metabolism. Hyperinsulinaemia/IR in obese adolescents is also associated with increased branched-chain and aromatic amino acids.
Keywords: Energy metabolism; Hyperinsulinaemia; Insulin resistance; NMR metabolomics; Obesity.
Conflict of interest statement
All authors have no conflicts of interest to declare.
Figures
Similar articles
-
Progression from impaired glucose tolerance to type 2 diabetes in obese children and adolescents: a 3-6-year cohort study in southern Thailand.J Pediatr Endocrinol Metab. 2016 Nov 1;29(11):1267-1275. doi: 10.1515/jpem-2016-0195. J Pediatr Endocrinol Metab. 2016. PMID: 27740930
-
Metabolomics allows the discrimination of the pathophysiological relevance of hyperinsulinism in obese prepubertal children.Int J Obes (Lond). 2017 Oct;41(10):1473-1480. doi: 10.1038/ijo.2017.137. Epub 2017 Jun 7. Int J Obes (Lond). 2017. PMID: 28588306
-
Insulin resistance and impaired glucose tolerance in obese children and adolescents referred to a tertiary-care center in Israel.Int J Obes (Lond). 2005 Jun;29(6):571-8. doi: 10.1038/sj.ijo.0802919. Int J Obes (Lond). 2005. PMID: 15889115
-
Studying progression from glucose intolerance to type 2 diabetes in obese children.Diabetes Metab Syndr. 2014 Jul-Sep;8(3):133-7. doi: 10.1016/j.dsx.2014.07.002. Epub 2014 Aug 7. Diabetes Metab Syndr. 2014. PMID: 25127329 Review.
-
Glucose metabolism in obese subjects: lessons from OGTT, IVGTT and clamp studies.Int J Obes Relat Metab Disord. 1995 Sep;19 Suppl 3:S14-20. Int J Obes Relat Metab Disord. 1995. PMID: 8581072 Review.
Cited by
-
Identification of Biomarkers Related to Metabolically Unhealthy Obesity in Korean Obese Adolescents: A Cross-Sectional Study.Children (Basel). 2023 Feb 8;10(2):322. doi: 10.3390/children10020322. Children (Basel). 2023. PMID: 36832451 Free PMC article.
-
Investigating the Postprandial Metabolome after Challenge Tests to Assess Metabolic Flexibility and Dysregulations Associated with Cardiometabolic Diseases.Nutrients. 2022 Jan 21;14(3):472. doi: 10.3390/nu14030472. Nutrients. 2022. PMID: 35276829 Free PMC article. Review.
-
Characterizing human postprandial metabolic response using multiway data analysis.Metabolomics. 2024 May 9;20(3):50. doi: 10.1007/s11306-024-02109-y. Metabolomics. 2024. PMID: 38722393 Free PMC article.
-
Analyzing postprandial metabolomics data using multiway models: a simulation study.BMC Bioinformatics. 2024 Mar 4;25(1):94. doi: 10.1186/s12859-024-05686-w. BMC Bioinformatics. 2024. PMID: 38438850 Free PMC article.
-
Metabolites and lipid species mediate the associations of adiposity in childhood and early adulthood with mammographic breast density in premenopausal women.Breast Cancer Res. 2025 Feb 4;27(1):18. doi: 10.1186/s13058-025-01970-6. Breast Cancer Res. 2025. PMID: 39905412 Free PMC article.
References
-
- Alberti KGMM, Zimmet PZ. Definition, diagnosis and classification of diabetes mellitus and its complications. Part 1: Diagnosis and classification of diabetes mellitus. Provisional report of a WHO consultation. Diabetic Medicine. 1998;15:539–553. - PubMed
-
- Amed S, Daneman D, Mahmud FH, Hamilton J. Type 2 diabetes in children and adolescents. Expert Review of Cardiovascular Therapy. 2010;8:393–406. - PubMed
-
- Arslanian SA. Clamp techniques in paediatrics: What have we learned? Hormonal Research. 2005;64(Suppl 3):16–24. - PubMed
-
- Badoud F, Lam KP, DiBattista A, Perreault M, Zulyniak MA, Cattrysse B, Stephenson S, Britz-McKibbin P, Mutch DM. Serum and adipose tissue amino acid homeostasis in the metabolically healthy obese. Journal of Proteome Research. 2014;13:3455–3466. - PubMed
-
- Benjamini Y, Hochberg Y. Controlling the false discovery rate: A practical and powerful approach to multiple testing. Journal of the Royal Statistical Society. Series B (Methodological) 1995;57:289–300.
Publication types
MeSH terms
Substances
LinkOut - more resources
Full Text Sources
Other Literature Sources
Medical