

Effect of emodin on long non-coding RNA-mRNA networks in rats with severe acute pancreatitis-induced acute lung injury
- PMID: 33438315
- PMCID: PMC7882958
- DOI: 10.1111/jcmm.15525
Effect of emodin on long non-coding RNA-mRNA networks in rats with severe acute pancreatitis-induced acute lung injury
Abstract
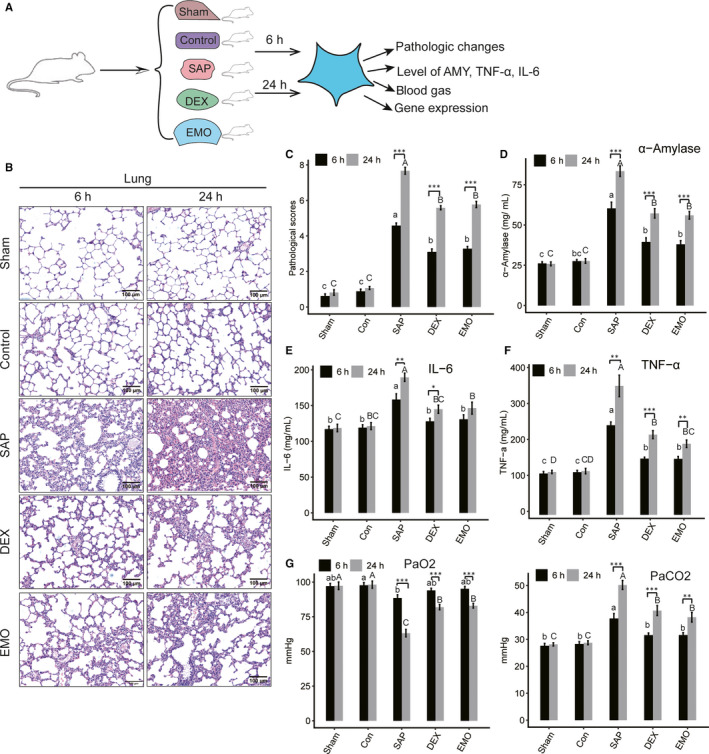
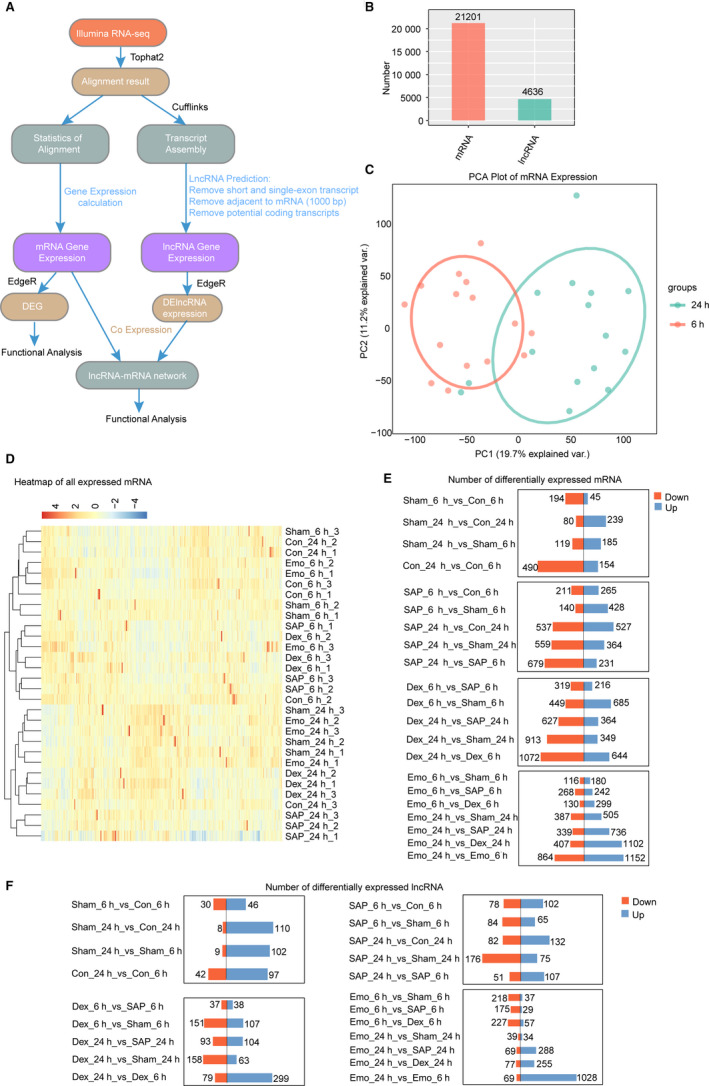
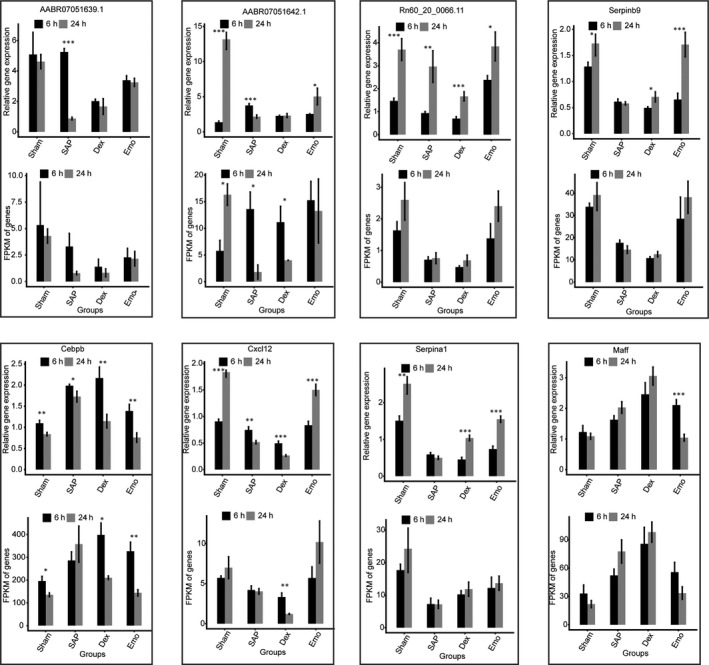
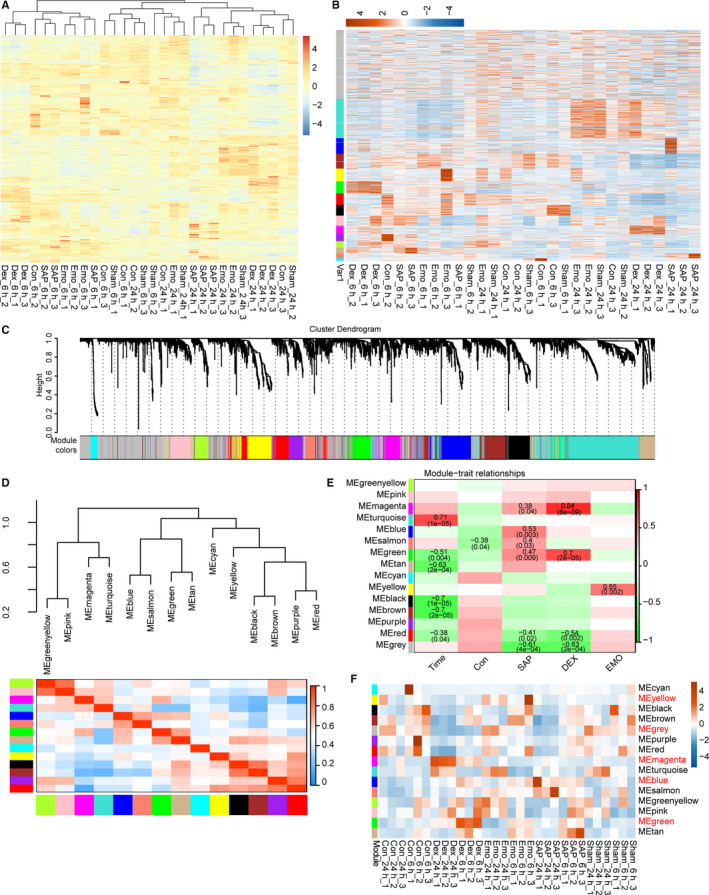
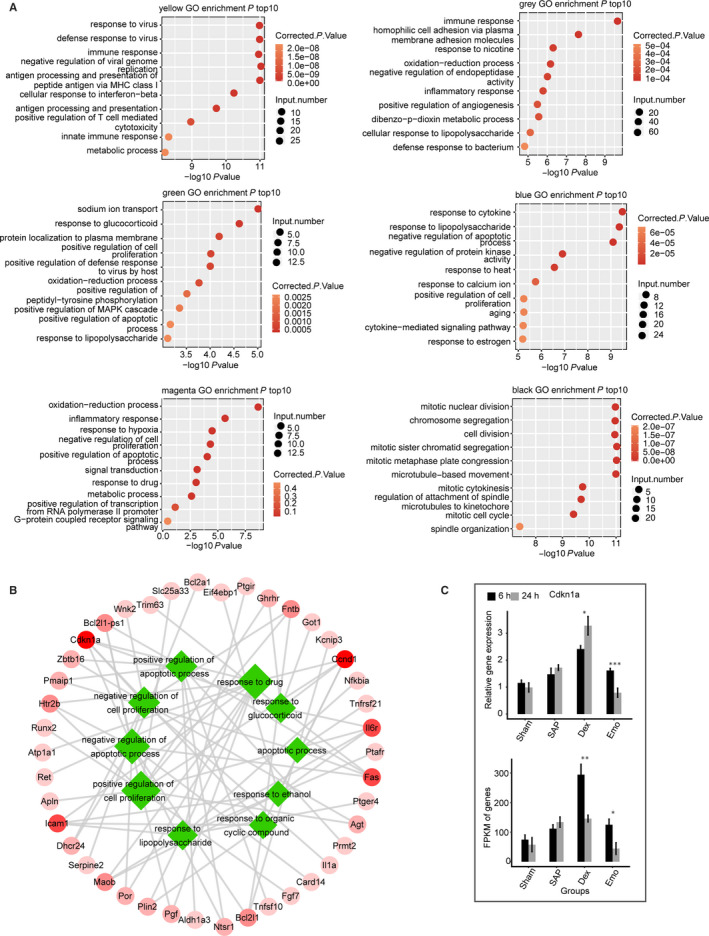
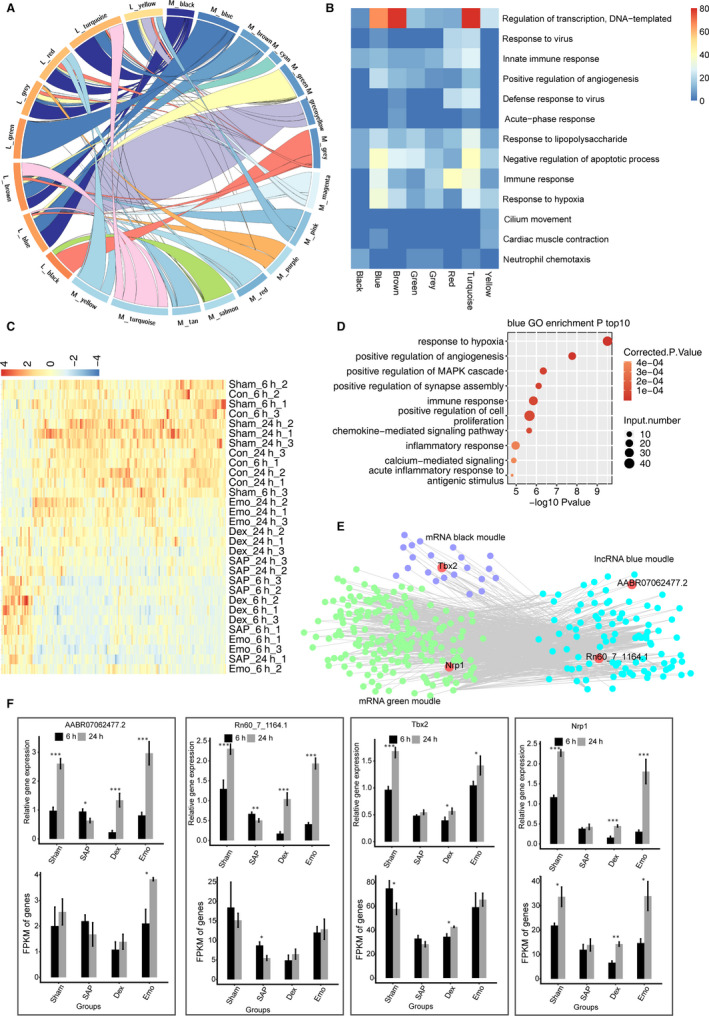
Long non-coding RNAs (lncRNAs) contribute to disease pathogenesis and drug treatment effects. Both emodin and dexamethasone (DEX) have been used for treating severe acute pancreatitis-associated acute lung injury (SAP-ALI). However, lncRNA regulation networks related to SAP-ALI pathogenesis and drug treatment are unreported. In this study, lncRNAs and mRNAs in the lung tissue of SAP-ALI and control rats, with or without drug treatment (emodin or DEX), were assessed by RNA sequencing. Results showed both emodin and DEX were therapeutic for SAP-ALI and that mRNA and lncRNA levels differed between untreated and treated SAP-ALI rats. Gene expression profile relationships for emodin-treated and control rats were higher than DEX-treated and -untreated animals. By comparison of control and SAP-ALI animals, more up-regulated than down-regulated mRNAs and lncRNAs were observed with emodin treatment. For DEX treatment, more down-regulated than up-regulated mRNAs and lncRNAs were observed. Functional analysis demonstrated both up-regulated mRNA and co-expressed genes with up-regulated lncRNAs were enriched in inflammatory and immune response pathways. Further, emodin-associated lncRNAs and mRNAs co-expressed modules were different from those associated with DEX. Quantitative polymerase chain reaction demonstrates selected lncRNA and mRNA co-expressed modules were different in the lung tissue of emodin- and DEX-treated rats. Also, emodin had different effects compared with DEX on co-expression network of lncRNAs Rn60_7_1164.1 and AABR07062477.2 for the blue lncRNA module and Nrp1 for the green mRNA module. In conclusion, this study provides evidence that emodin may be a suitable alternative or complementary medicine for treating SAP-ALI.
Keywords: acute lung injury; acute pancreatitis; emodin; lncRNA; mRNA.
© 2021 The Authors. Journal of Cellular and Molecular Medicine published by Foundation for Cellular and Molecular Medicine and John Wiley & Sons Ltd.
Conflict of interest statement
All authors declare no conflicts of interest.
Figures
Similar articles
-
Emodin alleviates severe acute pancreatitis-associated acute lung injury by decreasing pre-B-cell colony-enhancing factor expression and promoting polymorphonuclear neutrophil apoptosis.Mol Med Rep. 2017 Oct;16(4):5121-5128. doi: 10.3892/mmr.2017.7259. Epub 2017 Aug 16. Mol Med Rep. 2017. PMID: 28849044 Free PMC article.
-
Emodin ameliorates acute lung injury induced by severe acute pancreatitis through the up-regulated expressions of AQP1 and AQP5 in lung.Clin Exp Pharmacol Physiol. 2016 Nov;43(11):1071-1079. doi: 10.1111/1440-1681.12627. Clin Exp Pharmacol Physiol. 2016. PMID: 27452155
-
Emodin protects against severe acute pancreatitis-associated acute lung injury by activating Nrf2/HO-1/GPX4 signal and inhibiting ferroptosis in vivo and in vitro.BMC Gastroenterol. 2025 Feb 5;25(1):57. doi: 10.1186/s12876-025-03660-1. BMC Gastroenterol. 2025. PMID: 39910464 Free PMC article.
-
Inferring and analyzing module-specific lncRNA-mRNA causal regulatory networks in human cancer.Brief Bioinform. 2019 Jul 19;20(4):1403-1419. doi: 10.1093/bib/bby008. Brief Bioinform. 2019. PMID: 29401217 Review.
-
Identification of MFI2-AS1, a Novel Pivotal lncRNA for Prognosis of Stage III/IV Colorectal Cancer.Dig Dis Sci. 2020 Dec;65(12):3538-3550. doi: 10.1007/s10620-020-06064-1. Epub 2020 Jan 20. Dig Dis Sci. 2020. PMID: 31960204 Review.
Cited by
-
Effect of emodin on acute lung injury: a meta-analysis of preclinical trials.BMC Pulm Med. 2024 Dec 2;24(1):596. doi: 10.1186/s12890-024-03406-x. BMC Pulm Med. 2024. PMID: 39623403 Free PMC article.
-
Multi-Target Synergy Against Acute Lung Injury: Systems Pharmacology Decoding Dahuang-Huangqin Herb Pair's Therapeutic Mechanism.J Inflamm Res. 2025 Jul 18;18:9413-9441. doi: 10.2147/JIR.S527378. eCollection 2025. J Inflamm Res. 2025. PMID: 40703642 Free PMC article.
-
Identification of novel immune-related targets mediating disease progression in acute pancreatitis.Front Cell Infect Microbiol. 2022 Dec 14;12:1052466. doi: 10.3389/fcimb.2022.1052466. eCollection 2022. Front Cell Infect Microbiol. 2022. PMID: 36590588 Free PMC article.
-
Role of lncRNAs in acute pancreatitis: pathogenesis, diagnosis, and therapy.Front Genet. 2023 Sep 28;14:1257552. doi: 10.3389/fgene.2023.1257552. eCollection 2023. Front Genet. 2023. PMID: 37842644 Free PMC article. Review.
-
Emodin Ameliorates Severe Acute Pancreatitis-Associated Acute Lung Injury in Rats by Modulating Exosome-Specific miRNA Expression Profiles.Int J Nanomedicine. 2023 Nov 15;18:6743-6761. doi: 10.2147/IJN.S428924. eCollection 2023. Int J Nanomedicine. 2023. PMID: 38026528 Free PMC article.
References
-
- Frossard JL, Steer ML, Pastor CM. Acute pancreatitis. Lancet. 2008;371(9607):143‐152. - PubMed
-
- Banks PA, Freeman ML, Fass R, et al. Practice guidelines in acute pancreatitis. Am J Gastroenterol. 2006;101(10):2379‐2400. - PubMed
-
- Renner IG, Savage WT 3rd, Pantoja JL, Renner VJ. Death due to acute pancreatitis. A retrospective analysis of 405 autopsy cases. Dig Dis Sci. 1985;30(10):1005‐1018. - PubMed
-
- Wu XM, Kai‐Qiang J, Hai‐Yuan W, et al. MicroRNA‐339‐3p alleviates inflammation and edema and suppresses pulmonary microvascular endothelial cell apoptosis in mice with severe acute pancreatitis‐associated acute lung injury by regulating Anxa3 via the Akt/mTOR signaling pathway. J Cell Biochem. 2018;119(8):6704–6714. - PubMed
Publication types
MeSH terms
Substances
Grants and funding
- 2019YFE0119300/National Key Research and Development Program of China
- 2009XK01/National Key Discipline Construction Project of Integrated Chinese and Western Medicine
- 82074158 and 81603424/National Natural Science Foundation of China
- 2019-ZD-0919/Natural Science Foundation Guidance Plan of Liaoning Province
- 2012009/Medical Science Research Program of Dalian
LinkOut - more resources
Full Text Sources
Other Literature Sources
Medical
Molecular Biology Databases
Miscellaneous
