. 2021 Feb;25(3):1645-1660.
doi: 10.1111/jcmm.16267. Epub 2021 Jan 12.

PPARγ/NF-κB and TGF-β1/Smad pathway are involved in the anti-fibrotic effects of levo-tetrahydropalmatine on liver fibrosis

Affiliations

PPARγ/NF-κB and TGF-β1/Smad pathway are involved in the anti-fibrotic effects of levo-tetrahydropalmatine on liver fibrosis

Qiang Yu et al. J Cell Mol Med. 2021 Feb.

Abstract

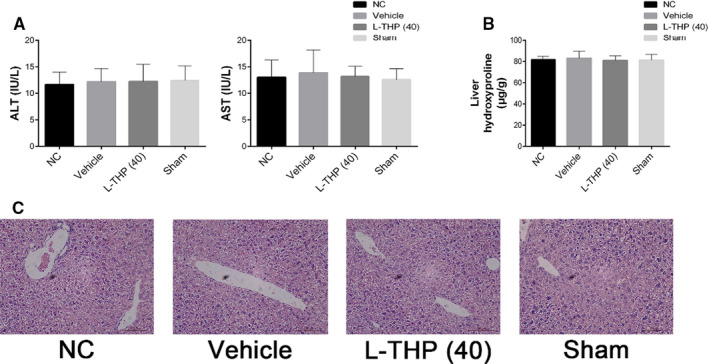
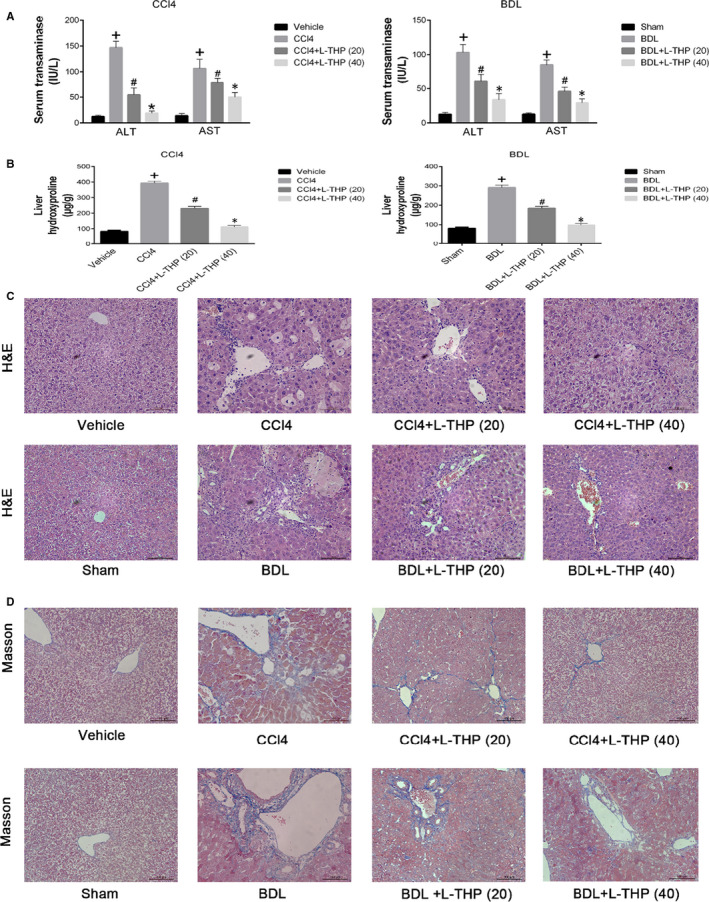
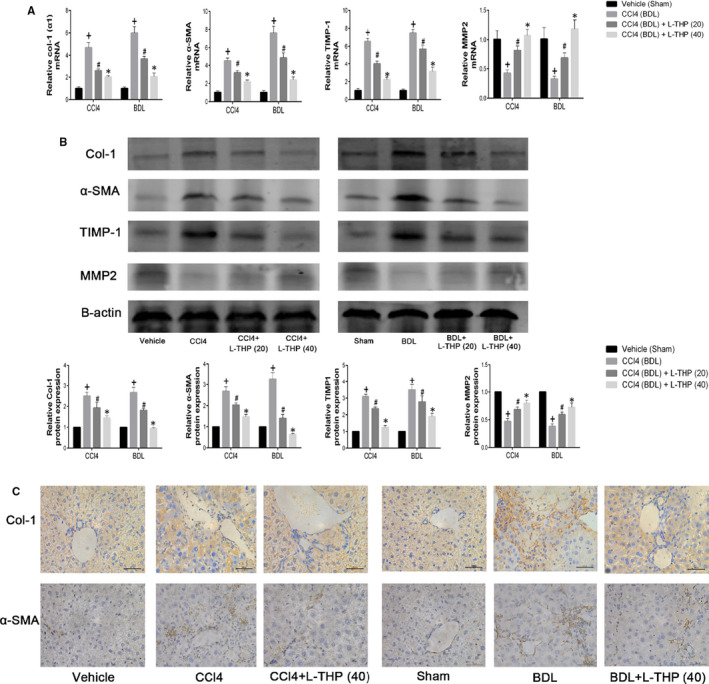
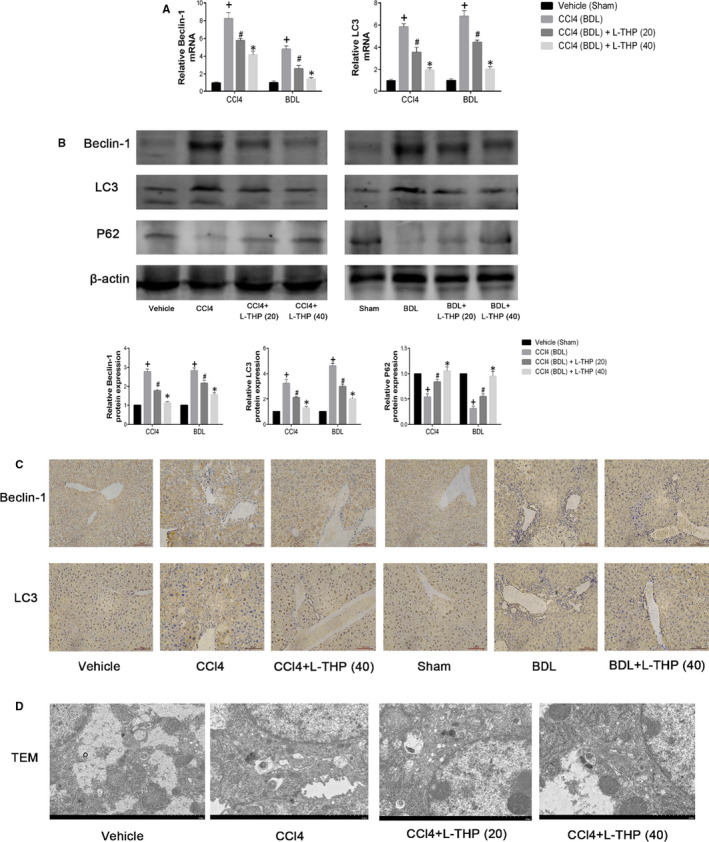
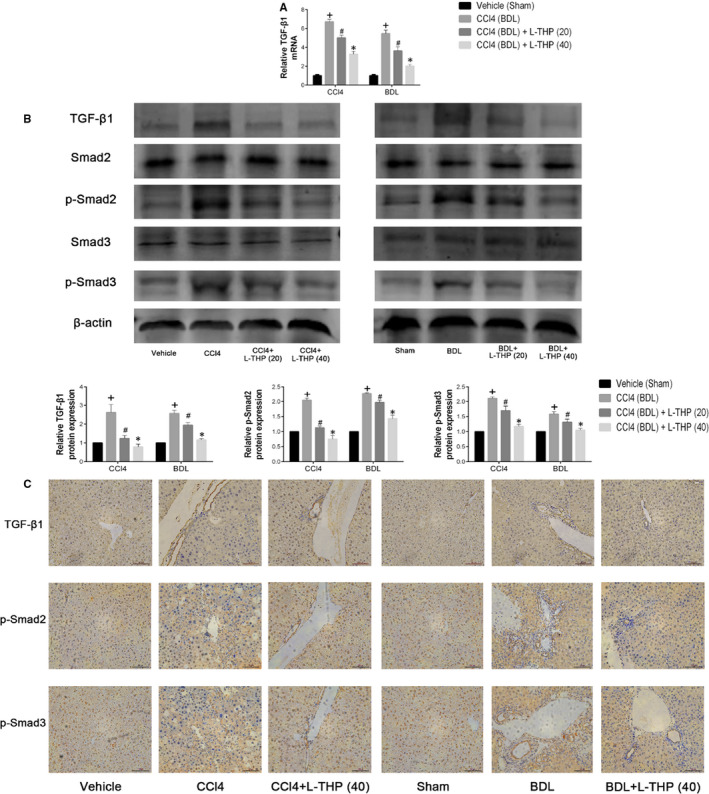
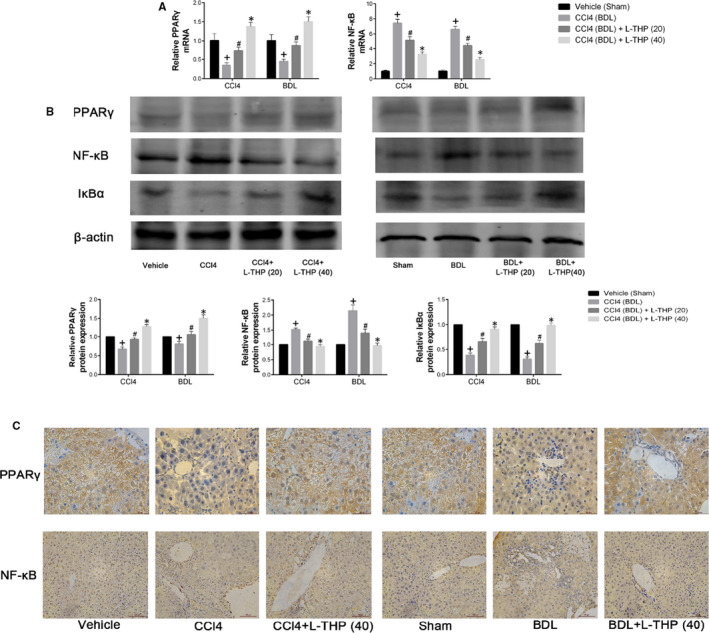
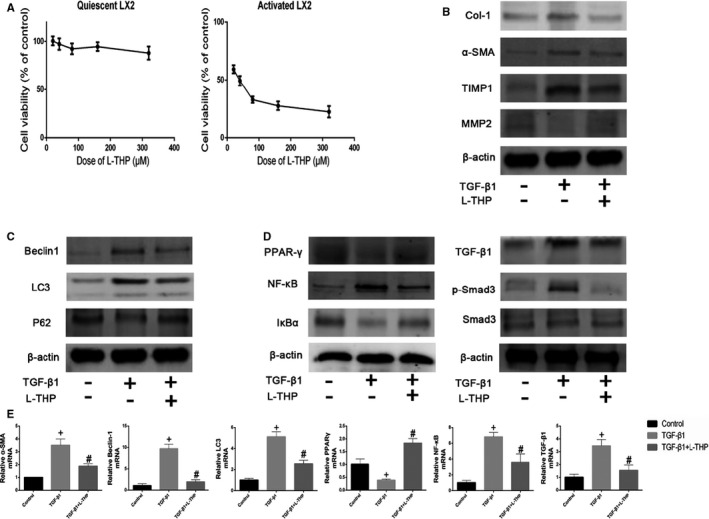
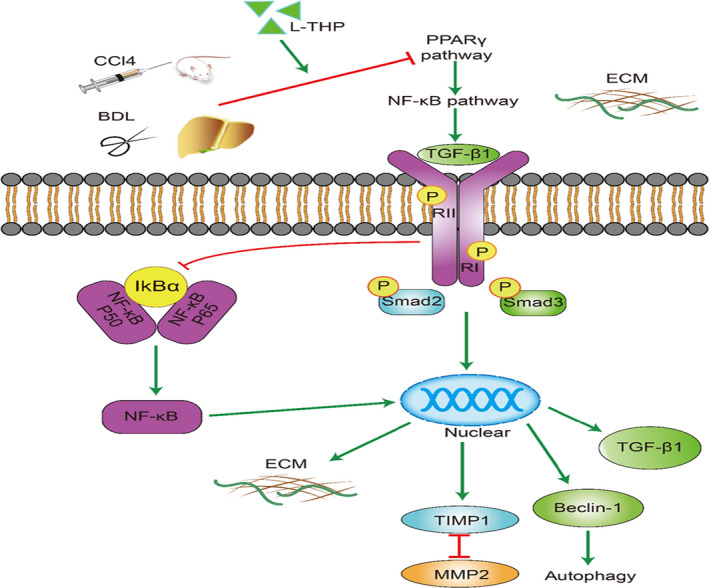
Liver fibrosis is a necessary stage in the development of chronic liver diseases to liver cirrhosis. This study aims to investigate the anti-fibrotic effects of levo-tetrahydropalmatine (L-THP) on hepatic fibrosis in mice and cell models and its underlying mechanisms. Two mouse hepatic fibrosis models were generated in male C57 mice by intraperitoneal injection of carbon tetrachloride (CCl4) for 2 months and bile duct ligation (BDL) for 14 days. Levo-tetrahydropalmatine was administered orally at doses of 20 and 40 mg/kg. An activated LX2 cell model induced by TGF-β1 was also generated. The results showed that levo-tetrahydropalmatine alleviated liver fibrosis by inhibiting the formation of extracellular matrix (ECM) and regulating the balance between TIMP1 and MMP2 in the two mice liver fibrosis models and cell model. Levo-tetrahydropalmatine inhibited activation and autophagy of hepatic stellate cells (HSCs) by modulating PPARγ/NF-κB and TGF-β1/Smad pathway in vivo and in vitro. In conclusion, levo-tetrahydropalmatine attenuated liver fibrosis by inhibiting ECM deposition and HSCs autophagy via modulation of PPARγ/NF-κB and TGF-β1/Smad pathway.

Keywords: PPARγ/NF-κB; TGF-β1/Smad; autophagy; levo-tetrahydropalmatine; liver fibrosis.


Conflict of interest statement

The authors declare no conflicts of interest.

Figures

FIGURE 1
FIGURE 1
Effects of olive oil, L‐THP (40 mg/kg), and laparotomy on normal liver tissues. A, The levels of serum ALT and AST in the four groups did not differ. Data were given as means ± SD (n = 6, P > .05). B, Hepatic levels of hydroxyproline in the four groups did not differ; data are given as means ± SD (n = 6, P > .05). C, H&E stains of liver sections in the four groups (Original magnification: ×400)
FIGURE 2
FIGURE 2
Effects of levo‐tetrahydropalmatine on liver function and pathological changes induced by CCl4 and BDL: (A and B) L‐THP decreased the serum levels of ALT, AST and hepatic levels of hydroxyproline induced by CCl4 and BDL in a dose‐dependent manner. Data are expressed as means ± SD (n = 6,+ P < .05 for CCl4 or BDL versus Vehicle or Sham; #P for CCl4+L‐THP (20) or BDL+L‐THP (20) versus CCl4 or BDL; *P for CCl4 +L‐THP (40) or BDL+L‐THP (40) versus CCl4 +L‐THP (20) or BDL+L‐THP (20)). (C and D) L‐THP ameliorated hepatic pathological change, showed by H&E and Masson’s staining (original magnification: ×400)
FIGURE 3
FIGURE 3
Effects of levo‐tetrahydropalmatine on ECM and HSCs activation in liver fibrosis. A, The PCR analysis. Levo‐tetrahydropalmatine reduced mRNA expressions of Col‐1 (α1), α‐SMA, and TIMP1 and increased mRNA expressions of MMP2 in the two mice liver fibrosis models. Data are expressed as means ± SD (n = 3,+ P < .05 for CCl4 or BDL versus Vehicle or Sham; #P for CCl4+L‐THP (20) or BDL+L‐THP (20) versus CCl4 or BDL; *P for CCl4 +L‐THP (40) or BDL+L‐THP (40) versus CCl4 +L‐THP (20) or BDL+L‐THP (20)). B, Western blot and quantitative analysis. Levo‐tetrahydropalmatine treatment significantly reduced the protein expressions of Col‐1, α‐SMA, and TIMP1 and increased the protein expression of MMP2. Data are expressed as means ± SD (n = 3,+ P < .05 for CCl4 or BDL versus Vehicle or Sham; #P for CCl4+L‐THP (20) or BDL+L‐THP (20) vs CCl4 or BDL; *P for CCl4 +L‐THP (40) or BDL+L‐THP (40) vs CCl4 +L‐THP (20) or BDL+L‐THP (20)). C, Immunohistochemical staining indicated that the increased protein expressions of Col‐1, α‐SMA in CCl4 and BDL groups were suppressed by 40 mg/kg L‐THP treatment (original magnification: ×400)
FIGURE 4
FIGURE 4
Effects of levo‐tetrahydropalmatine on autophagy in liver fibrosis. A, The PCR analysis. The mRNA levels of Beclin1 and LC3 were significantly down‐regulated by L‐THP. Data are expressed as means ± SD (n = 3, + P < .05 for CCl4 or BDL vs Vehicle or Sham; #P for CCl4+L‐THP (20) or BDL+L‐THP (20) vs CCl4 or BDL; *P for CCl4 +L‐THP (40) or BDL+L‐THP (40) versus CCl4 +L‐THP (20) or BDL+L‐THP (20)). B, Western blot and quantitative analysis. L‐THP treatment significantly reduced the protein expressions of Beclin1 and LC3 and increased the protein expression of P62. Data are expressed as means ± SD (n = 3,+ P < 0.05 for CCl4 or BDL versus Vehicle or Sham; #P for CCl4+L‐THP (20) or BDL+L‐THP (20) versus CCl4 or BDL; *P for CCl4 +L‐THP (40) or BDL+L‐THP (40) vs CCl4 +L‐THP (20) or BDL+L‐THP (20)). C, The areas of positive cells of Beclin1 and LC3 were diminished by L‐THP as shown by immunohistochemistry staining (original magnification: ×400). D, L‐THP inhibited the autophagosome formation in the liver sections from the CCl4‐induced fibrosis model (original magnification: ×7000)
FIGURE 5
FIGURE 5
Effects of levo‐tetrahydropalmatine on the TGF‐β1/Smad pathway in liver fibrosis: (A) The PCR analysis. The mRNA levels of TGF‐β1were significantly down‐regulated by L‐THP. Data are expressed as means ± SD (n = 3,+ P < .05 for CCl4 or BDL vs Vehicle or Sham; #P for CCl4+L‐THP (20) or BDL+L‐THP (20) versus CCl4 or BDL; *P for CCl4 +L‐THP (40) or BDL+L‐THP (40) vs CCl4 +L‐THP (20) or BDL+L‐THP (20)). B, Western blot and quantitative analysis. L‐THP treatment significantly reduced the protein expressions of TGF‐β1, p‐Smad2 and p‐Smad3. Data are expressed as means ± SD (n = 3, + P < .05 for CCl4 or BDL vs Vehicle or Sham; #P for CCl4+L‐THP (20) or BDL+L‐THP (20) vs CCl4 or BDL; *P for CCl4 +L‐THP (40) or BDL+L‐THP (40) vs CCl4 +L‐THP (20) or BDL+L‐THP (20)). C, Immunohistochemical staining indicated that the increased protein expressions of TGF‐β1, p‐Smad2 and p‐Smad3 in CCl4 and BDL groups were suppressed by 40 mg/kg L‐THP treatment (original magnification: ×400)
FIGURE 6
FIGURE 6
Effects of levo‐tetrahydropalmatine on the PPARγ/NF‐κB pathway in liver fibrosis: (A) The PCR analysis. L‐THP up‐regulated PPARγ while down‐regulated NF‐κB mRNA levels. Data are expressed as means ± SD (n = 3, + P < .05 for CCl4 or BDL vs Vehicle or Sham; #P for CCl4+L‐THP (20) or BDL+L‐THP (20) versus CCl4 or BDL; *P for CCl4 +L‐THP (40) or BDL+L‐THP (40) vs CCl4 +L‐THP (20) or BDL+L‐THP (20)). (B) Western blot and quantitative analysis of PPARγ, NF‐κB and IκBα. L‐THP increased PPARγ and IκBα protein expressions while reduced NF‐κB protein expressions in liver tissues. Data are expressed as means ± SD (n = 3, + P < .05 for CCl4 or BDL vs Vehicle or Sham; #P for CCl4+L‐THP (20) or BDL+L‐THP (20) vs CCl4 or BDL; *P for CCl4 +L‐THP (40) or BDL+L‐THP (40) vs CCl4 +L‐THP (20) or BDL+L‐THP (20)). C, Immunohistochemical staining indicated that 40 mg/kg L‐THP treatment increased PPARγ while inhibited NF‐κB expression in liver tissues (original magnification: ×400)
FIGURE 7
FIGURE 7
Effects of levo‐tetrahydropalmatine on the ECM synthesis, autophagy and PPARγ/NF‐κB and TGF‐β1/Smad pathway in LX2 cells in vitro: (A) Cell viability after L‐THP treatment in quiescent and activated LX2 cells (n = 3). B, C & D, The protein expressions of Col‐1, α‐SMA, TIMP1, MMP2, Beclin1, LC3, P62, PPARγ, NF‐κB, IκBα, TGF‐β1, Smad3 and p‐Smad3 were detected by Western Blotting. E, The mRNA expressions of α‐SMA, Beclin1, LC3, PPARγ, NF‐κB and TGF‐β1 were detected by PCR analysis. Data are expressed as means ± SD (n = 3, + P < .05 for TGF‐β1‐treated group versus Control group; #P for L‐THP‐treated group vs TGF‐β1‐treated group)
FIGURE 8
FIGURE 8
Protective mechanism of levo‐tetrahydropalmatine against liver fibrosis. L‐THP up‐regulated PPARγ expression, leading to the inhibition of NF‐κB pathway. Inhibited NF‐κB down‐regulated the expression of TGF‐β1 and TGF‐β1/Smad pathway, suppressing HSCs activation, ECM synthesis and autophagy

References

    1. Feng J, Chen K, Xia Y, et al. Salidroside ameliorates autophagy and activation of hepatic stellate cells in mice via NF‐kappaB and TGF‐beta1/Smad3 pathways. Drug Des Devel Ther. 2018;12:1837–1853. - PMC - PubMed
    1. Shen M, Chen K, Lu J, et al. Protective effect of astaxanthin on liver fibrosis through modulation of TGF‐beta1 expression and autophagy. Mediators Inflamm. 2014;2014:954502. - PMC - PubMed
    1. Liu T, Xu L, Wang C, et al. Alleviation of hepatic fibrosis and autophagy via inhibition of transforming growth factor‐beta1/Smads pathway through shikonin. J Gastroenterol Hepatol. 2019;34(1):263–276. - PubMed
    1. Schuppan D, Ashfaq‐Khan M, Yang AT, Kim YO. Liver fibrosis: Direct antifibrotic agents and targeted therapies. Matrix Biol. 2018;68–69:435–451. - PubMed
    1. Campana L, Iredale JP. Regression of liver fibrosis. Semin Liver Dis. 2017;37(1):1–10. - PubMed

Publication types

MeSH terms