. 2021 Mar 1;153(3):e202012751.
doi: 10.1085/jgp.202012751.

Evidence for S2 flexibility by direct visualization of quantum dot-labeled myosin heads and rods within smooth muscle myosin filaments moving on actin in vitro

Affiliations

Evidence for S2 flexibility by direct visualization of quantum dot-labeled myosin heads and rods within smooth muscle myosin filaments moving on actin in vitro

Richard K Brizendine et al. J Gen Physiol. .

Abstract

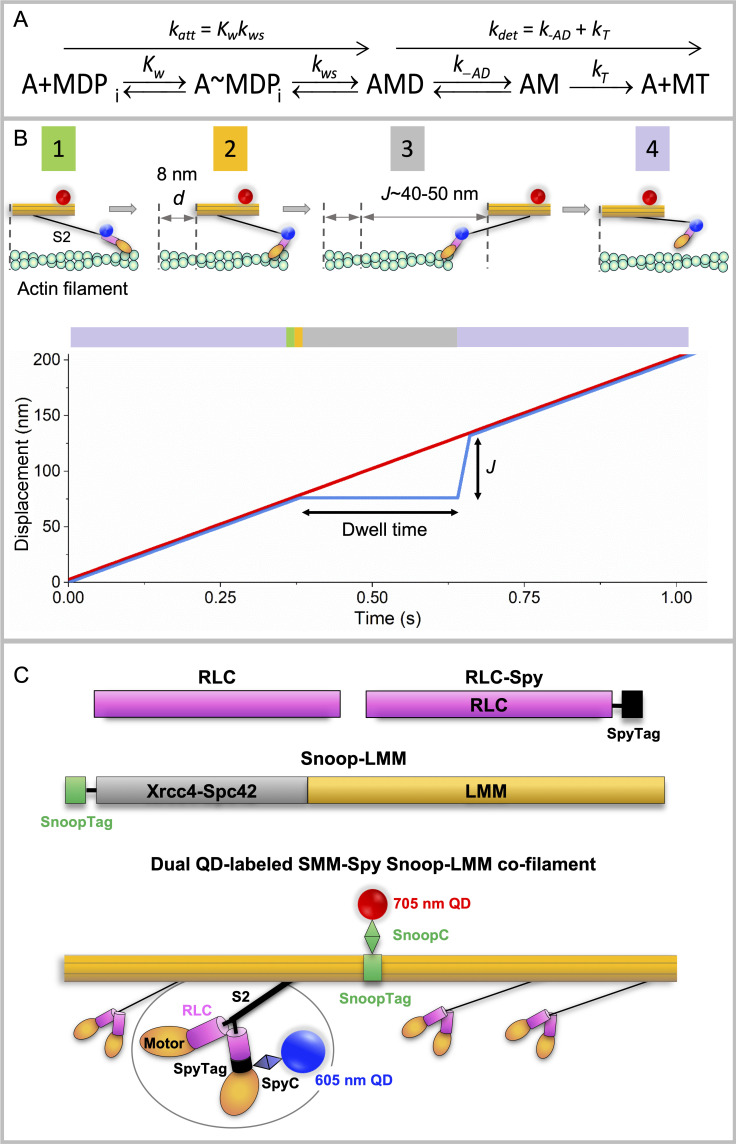
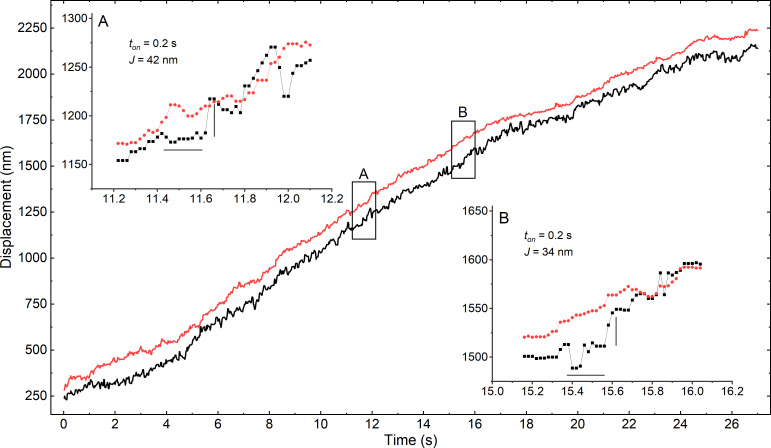
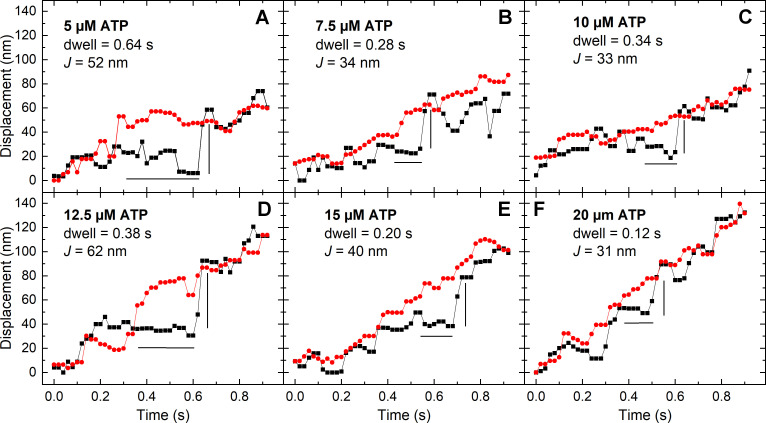
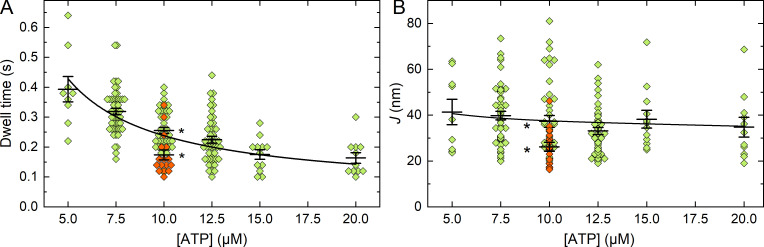
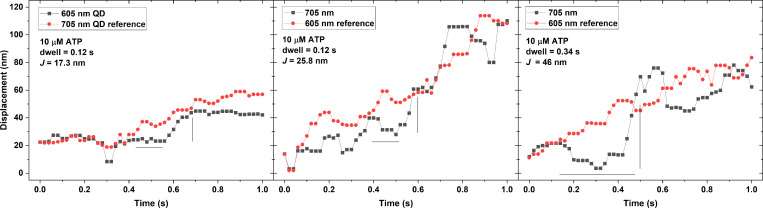
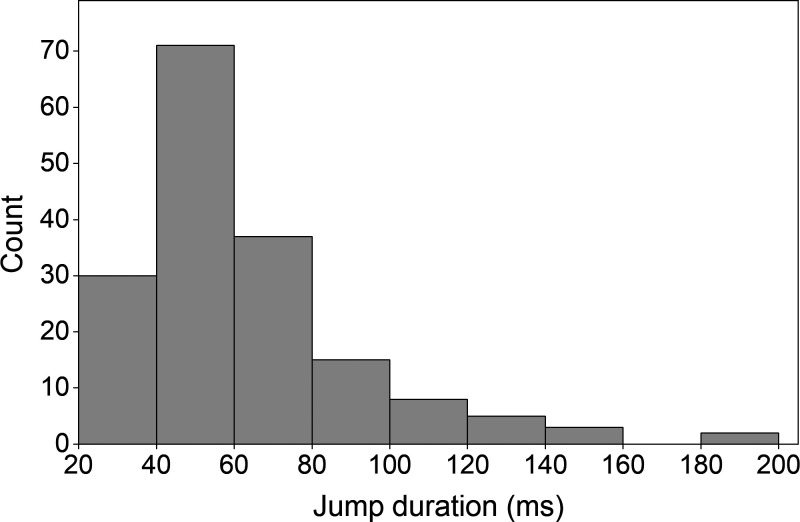
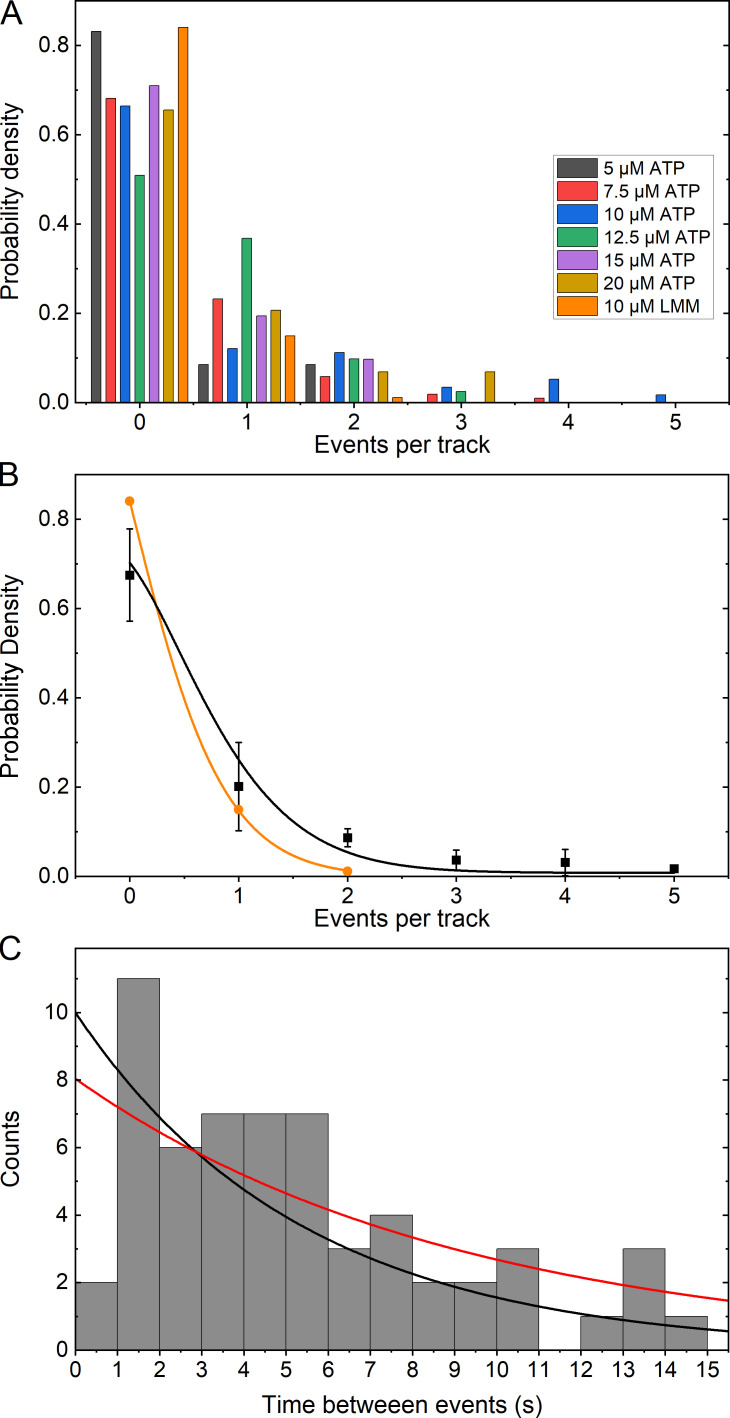
Myosins in muscle assemble into filaments by interactions between the C-terminal light meromyosin (LMM) subdomains of the coiled-coil rod domain. The two head domains are connected to LMM by the subfragment-2 (S2) subdomain of the rod. Our mixed kinetic model predicts that the flexibility and length of S2 that can be pulled away from the filament affects the maximum distance working heads can move a filament unimpeded by actin-attached heads. It also suggests that it should be possible to observe a head remain stationary relative to the filament backbone while bound to actin (dwell), followed immediately by a measurable jump upon detachment to regain the backbone trajectory. We tested these predictions by observing filaments moving along actin at varying ATP using TIRF microscopy. We simultaneously tracked two different color quantum dots (QDs), one attached to a regulatory light chain on the lever arm and the other attached to an LMM in the filament backbone. We identified events (dwells followed by jumps) by comparing the trajectories of the QDs. The average dwell times were consistent with known kinetics of the actomyosin system, and the distribution of the waiting time between observed events was consistent with a Poisson process and the expected ATPase rate. Geometric constraints suggest a maximum of ∼26 nm of S2 can be unzipped from the filament, presumably involving disruption in the coiled-coil S2, a result consistent with observations by others of S2 protruding from the filament in muscle. We propose that sufficient force is available from the working heads in the filament to overcome the stiffness imposed by filament-S2 interactions.


Figures

Figure 1.
Figure 1.
Summary of actomyosin kinetics and experimental system. (A) Kinetic scheme for myosin (M) attachment to actin (A). D, ADP; T, ATP; Pi, phosphate. Kw, equilibrium constant for weak binding of myosin to actin; kws, forward rate constant for the weak to strong transition. We assume that k-ws is insignificant. See text for other rate constants. (B) Top: Mf/A assay showing SMM-Spy Snoop-LMM (RLC-LMM) cofilament (orange) labeled with QD-SpyC (blue dot) attached to the RLC in the lever arm domain (pink) and QD-SnoopC (red dot) moving over biotinylated actin (green) attached to PEG brush-coated coverslip (not shown). Filaments are shown widely separated for clarity with S2 (black) detached completely from the filament backbone, which may not reflect the actual process (see text). Pre-working step, green box 1; post-working step, gold box 2; and after full extension of S2, gray box 3, by other working heads (not shown) giving L = 40–50 nm. The myosin head then must return to its starting position relative to the filament backbone, purple box 4. Bottom: Graph of mixed-kinetic model predictions of single head behavior in a filament. Black arrows indicate approximate predicted dwell time and J value (see text) predictions at 10 µM [ATP]. Red line, filament backbone trajectory. Blue line, predicted single myosin head behavior. Lines are shown nearly coincident for clarity but could be separated depending upon the relative positions of the two QDs. Colors in the bar above the graph correspond to the state of the myosin head. The entire cycle time is not shown for clarity. (C) Expressed constructs and proteins. Pink, RLC (UniProtKB, P02612). Black, SpyTag002 (VPTIVMVDAYKRYK; Keeble et al., 2017). Gray, Xrcc4-Spc42 (Andreas et al., 2017; Drennan et al., 2019). Green, SnoopTag (KLGDIEFIKVNK; Hatlem et al., 2019). Thin black line, GSGESG linker. Lengths reflect approximate relative sequence lengths. RLC-Spy, SpyTag on C terminus of RLC. Snoop-LMM, SnoopTag on the N terminus of the Xrcc4-Spc42 domain, then LMM 1728–1979 (National Center for Biotechnology Information accession no. NP_990605.2). In RLC-LMM cofilament, colors match constructs above. Backbone formed by assembled LMM domains (orange), two heads (orange) and S2 domain (black); Xrcc4-Spc42 domain is not visible. 705 nm QD (red dot) chemically coupled to a SnoopC (green diamond) interacting with SnoopTag (green box) of LMM construct (orange). Enlarged region shows 605 nm QD (blue dot) chemically coupled to SpyC (blue diamond) interacting with SpyTag of RLC construct in myosin head (orange). See Materials and methods for details.
Figure S1.
Figure S1.
Snoop-LMM reacts spontaneously with SnoopC. Reaction time course of 0.5 µM Snoop-LMM mixed with 1 µM SnoopC in filament buffer. Percent reactants covalently linked was determined by SDS-PAGE and gel densitometry. Error bars are SD; n = 3.
Figure S2.
Figure S2.
Snoop-LMM SMM cofilaments are stable and can be labeled with SnoopC-QDs. TIRF microscopy images of various rhodamine labeled SMM filament preparations in filament buffer. Scale bar, 5 µm. (A) Control 20 µg ml−1 SMM filaments on a glass coverslip. Arrows indicate aggregates of filaments; carrots indicate single filaments. (B) Overlaid image of 20 µg ml−1 95% SMM 5% Snoop-LMM cofilaments (red) reacted at 1 µM with 0.12 µM 585 nm QD-SnoopC overnight at 4°C. (C) Same as B, except with 0.12 µM 655 nm QD-SnoopC. For B and C, arrows point to colocalized filaments and QDs.
Figure 2.
Figure 2.
Representative displacement trajectory of SMM filament moving on stationary actin filament. Fluorescence of 605 nm QD on RLC (black trace) and 705 nm QD on LMM (red trace) incorporated into RLC-LMM cofilament was simultaneously acquired, tracked, and reoriented along the axis of motion. [ATP] = 10 µM. (A and B) Insets reveal dwells (horizontal lines) followed by jumps (vertical lines) in the RLC trace. The LMM traces were translated from the RLC traces by −80 nm in the insets for better comparison.
Figure 3.
Figure 3.
Representative events showing dwell times followed by jumps at varying [ATP]. For all panels, the black squares and line are the displacement of the SpyC-605QD (RLC), and the red circles and line are the displacement of the SnoopC-705QD (LMM). The horizontal black line is the estimated time that the RLC trace pauses (dwell time) while the LMM traces rises, and the vertical black line is the jump distance (J). (A) 5 µM ATP. (B) 7.5 µM ATP. (C) 10 µM ATP. (D) 12.5 µM ATP. (E) 15 µM ATP. (F) 20 µM ATP.
Figure 4.
Figure 4.
Dwell times (ton) and jump lengths (J) at varying [ATP]. (A) Dwell times identified before the jump at varying [ATP]. Green diamonds, RLC-LMM cofilaments, 5 µM ATP, n = 9; 7.5 µM ATP, n = 50; 10 µM ATP, n = 45; 12.5 µM ATP, n = 46; 15 µM ATP, n = 12; 20 µM ATP, n = 11. Red diamonds, LMM-LMM cofilaments, 10 µM ATP, n = 16. The asterisks for the 10 µM ATP condition indicate the two means are statistically significantly different using a two-sample t test with P = 0.000645. The black line is a fit of Eq. 1 to the means. (B) Jump lengths (J) following the dwell times identified in A. The asterisks for the 10 µM ATP data indicate the means are statistically significantly different with P = 0.01. For A and B, the black vertical whiskers indicate SEM; the longer black horizontal line is the mean.
Figure S3.
Figure S3.
Representative false-positive events from LMM-LMM trajectories. The horizontal black line is the estimated time the black trace pauses (dwell time) while the reference trace rises, and the vertical black line is the estimated jump distance (J). All data were collected at 10 µM [ATP] (see Fig. 4, A and B).
Figure 5.
Figure 5.
Distribution of jump durations. Histogram showing the distribution of the time each jump took from the end of the dwell to where it returned to the LMM trace. The average = 52.9 ± 2.3 ms (SE), n = 171.
Figure 6.
Figure 6.
Frequency of events per track and distribution of time between events. (A) Histogram of the frequency of detected events as a probability density given the total number of trajectories. All data refer to RLC-LMM except that indicated as LMM (orange) for the LMM-LMM data. Half of the tracks that contained zero events were removed from the probability calculation (see text). (B) Plot of the mean probability density (black squares) for each [ATP] from data shown in A, excluding the LMM-LMM data. The LMM-LMM data are shown in orange circles. The color-coded lines show a fit to Eq. 2. (C) Histogram showing the distribution of the time between events for all tracks that contained multiple events. The black line is an exponential distribution with the mean time between events equal to that of the data and the amplitude equal to the maximum of the data. The red line is a fit to Eq. 3.

Similar articles

Cited by

References

    1. Adamovic, I., Mijailovich S.M., and Karplus M.. 2008. The elastic properties of the structurally characterized myosin II S2 subdomain: a molecular dynamics and normal mode analysis. Biophys. J. 94:3779–3789. 10.1529/biophysj.107.122028 - DOI - PMC - PubMed
    1. Alamo, L., Qi D., Wriggers W., Pinto A., Zhu J., Bilbao A., Gillilan R.E., Hu S., and Padrón R.. 2016. Conserved intramolecular interactions maintain myosin interacting-heads motifs explaining tarantula muscle super-relaxed state structural basis. J. Mol. Biol. 428:1142–1164. 10.1016/j.jmb.2016.01.027 - DOI - PMC - PubMed
    1. Andreas, M.P., Ajay G., Gellings J.A., and Rayment I.. 2017. Design considerations in coiled-coil fusion constructs for the structural determination of a problematic region of the human cardiac myosin rod. J. Struct. Biol. 200:219–228. 10.1016/j.jsb.2017.07.006 - DOI - PMC - PubMed
    1. Ashton, F.T., Somlyo A.V., and Somlyo A.P.. 1975. The contractile apparatus of vascular smooth muscle: intermediate high voltage stereo electron microscopy. J. Mol. Biol. 98:17–29. 10.1016/S0022-2836(75)80098-2 - DOI - PubMed
    1. Baker, J.E., Brosseau C., Joel P.B., and Warshaw D.M.. 2002. The biochemical kinetics underlying actin movement generated by one and many skeletal muscle myosin molecules. Biophys. J. 82:2134–2147. 10.1016/S0006-3495(02)75560-4 - DOI - PMC - PubMed

Publication types