. 2021 Apr;121(4):1073-1085.
doi: 10.1007/s00421-020-04592-2. Epub 2021 Jan 13.

The development of mature gait patterns in children during walking and running

Affiliations

The development of mature gait patterns in children during walking and running

Margit M Bach et al. Eur J Appl Physiol. 2021 Apr.

Abstract

Purpose: We sought to identify the developing maturity of walking and running in young children. We assessed gait patterns for the presence of flight and double support phases complemented by mechanical energetics. The corresponding classification outcomes were contrasted via a shotgun approach involving several potentially informative gait characteristics. A subsequent clustering turned out very effective to classify the degree of gait maturity.

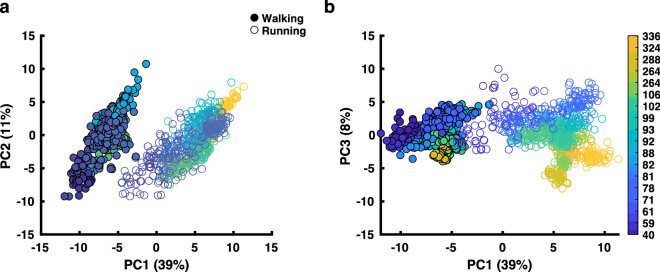
Methods: Participants (22 typically developing children aged 2-9 years and 7 young, healthy adults) walked/ran on a treadmill at comfortable speeds. We determined double support and flight phases and the relationship between potential and kinetic energy oscillations of the center-of-mass. Based on the literature, we further incorporated a total of 93 gait characteristics (including the above-mentioned ones) and employed multivariate statistics comprising principal component analysis for data compression and hierarchical clustering for classification.

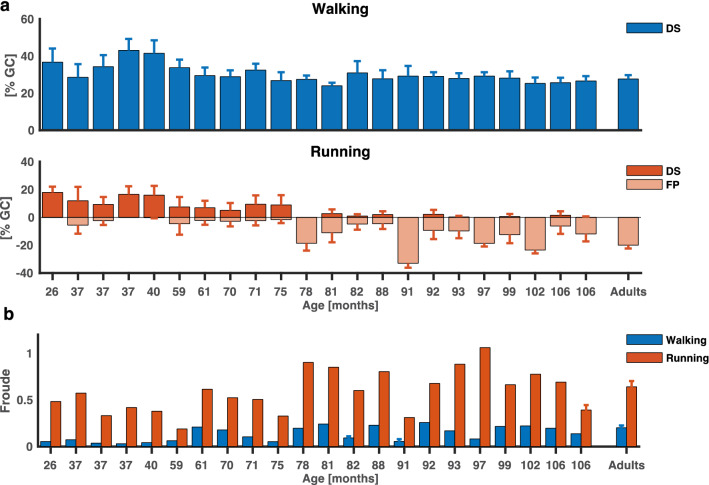
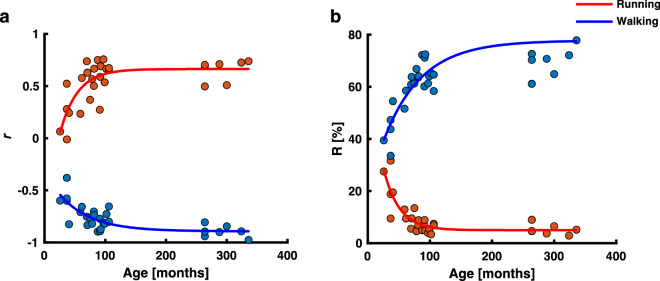
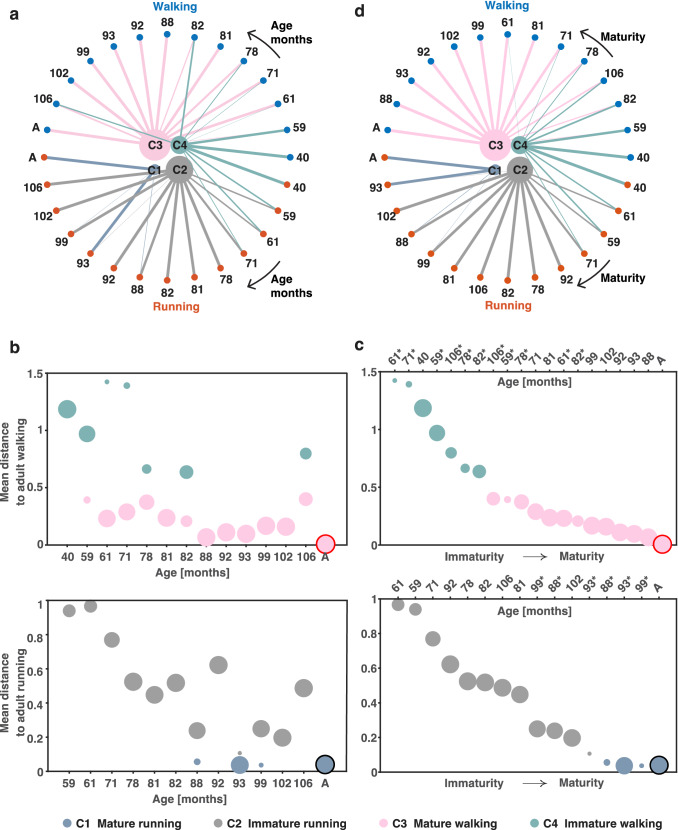
Results: While the ability to run including a flight phase increased with age, the flight phase did not reach 20% of the gait cycle. It seems that children use a walk-run-strategy when learning to run. Yet, the correlation strength between potential and kinetic energies saturated and so did the amount of recovered mechanical energy. Clustering the set of gait characteristics allowed for classifying gait in more detail. This defines a metric for maturity in terms of deviations from adult gait, which disagrees with chronological age.

Conclusions: The degree of gait maturity estimated statistically using various gait characteristics does not always relate directly to the chronological age of the child.

Keywords: Children; Clustering; Locomotion; Maturity; Mechanical energy.


Conflict of interest statement

The authors declare that they have no conflict of interest.

Figures

Fig. 1
Fig. 1
Temporal patterns during walking and running and normalized speed. a Double support phase (positive numbers) and flight phase (negative numbers) expressed as a percentage of the gait cycle (mean ± SD) for walking (upper panel) and running (lower panel), as a function of age (months-rounded to the nearest whole integer) for each child participant and adults as a grand average. b Normalized speed expressed as the Froude value (v2/g·l) for each participant and condition (walking in blue and running in red). Error bars signify standard deviations between participants for adults and differences between trials for the walking condition of the participants of 82 and 91 months and running condition for the second participant of 106 months
Fig. 2
Fig. 2
Kinematics during walking and running. Stick figures of representative strides of four representative participants during walking (upper panel) and running (lower panel). The black parts of the stick figures correspond to stance phase and the colored to the swing phase (blue for walking; red for running). Below, five representative strides are presented for each participant for left and right leg. Ensemble averages (± SD of five gait cycles) of knee joint angle and vertical hip displacement (GTv) for each participant and condition. Gait cycle bars represent mean stance and swing duration for each participant with the horizontal black bar representing the standard deviation between strides. GTv is expressed in relative units (normalized by the limb length l)
Fig. 3
Fig. 3
Effects of the mechanical energy of the CoM on age. a The correlation coefficient r between Ek and Ep as a function of age for walking (blue) and running (red). There is an exponential relationship between age and r for both walking and running. b The relative recovered energy R as a function of age for walking (blue) and running (red). There is an exponential relationship between R and age for both walking and running
Fig. 4
Fig. 4
Principal component analysis (PCA) outcomes for walking and running. a The outcome of the PCA in PC1-PC2 space. b The outcome of the PC1-PC3 space. Each dot represents a stride and the color-coding refer to the age in months of the participants. The filled circles are the prescribed walking condition and the un-filled circles are the prescribed running condition
Fig. 5
Fig. 5
Clustering output. a Output of clustering ordered based on age (months), with the youngest participant on the right side and the adults (A) on the left side for walking (blue circles) and running (red circles). The size of the clusters (C1-C4) depends on the amounts of strides belonging to each cluster, similarly the thickness of the lines connecting each cluster with a participant depends on the percentage of data from each participant belonging to that cluster. b Calculated average pairwise correlation distance to the mature walking patterns of the adults (A) (upper panel) and to the mature running patterns of the adults (A) (lower panel) as a function of age. c Calculated average pairwise correlation distance to the mature walking patterns of the adults (A) (upper panel) and the mature running patterns of the adults (A) (lower panel) as a function of gait maturity. The upper axis in both plots represents the age of the participants in months (rounded to nearest whole integer). Note that the increase in age is not monotonic as it is a function of gait maturity (immature from left going to mature on right). Note also that the lower axis in both plots is not in units of the correlation distance (which is shown on the y-axis) but set to arbitrary values (indices of sorting); that is, the seeming exponential decay should not be interpreted as such. Color notation is the same as in a), C4 represents immature walking, C3 represents mature walking, C2 represents immature running and C1 represents mature running. The size of the circles depends on the amounts of strides belonging to each cluster. d Output of clustering based on maturity with the least mature patterns on the right side and the most mature (adults: A) on the left side. For a full overview of the percentage of strides belonging to each cluster, see Online Resource 6

References

    1. Alexander R. Mechanics of bipedal locomotion Perspectives in experimental biology. Perspect Exp Biol. 1976;1:493–504.
    1. Alexander RM, Jayes AS. a dynamic similarity hypothesis for the gaits of quadrupedal mammals. J Zool. 1983;201:135–152. doi: 10.1111/j.1469-7998.1983.tb04266.x. - DOI
    1. Booth ATC, van der Krogt MM, Harlaar J, Dominici N, Buizer AI. Muscle synergies in response to biofeedback-driven gait adaptations in children with cerebral palsy. Front Physiol. 2019;10:1208. doi: 10.3389/fphys.2019.01208. - DOI - PMC - PubMed
    1. Cappellini G, Ivanenko YP, Martino G, MacLellan MJ, Sacco A, Morelli D, Lacquaniti F. Immature spinal locomotor output in children with cerebral palsy. Front Physiol. 2016;7:478. doi: 10.3389/fphys.2016.00478. - DOI - PMC - PubMed
    1. Carriero A, Zavatsky A, Stebbins J, Theologis T, Shefelbine SJ. Determination of gait patterns in children with spastic diplegic cerebral palsy using principal components. Gait Posture. 2009;29:71–75. doi: 10.1016/j.gaitpost.2008.06.011. - DOI - PubMed