

CT quantification of the heterogeneity of fibrosis boundaries in idiopathic pulmonary fibrosis
- PMID: 33439318
- PMCID: PMC7804589
- DOI: 10.1007/s00330-020-07594-y
CT quantification of the heterogeneity of fibrosis boundaries in idiopathic pulmonary fibrosis
Abstract
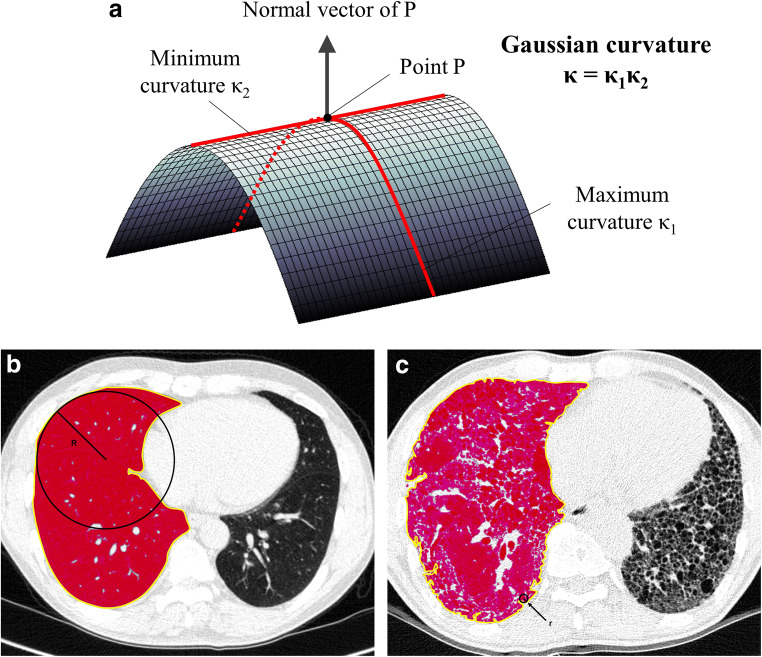
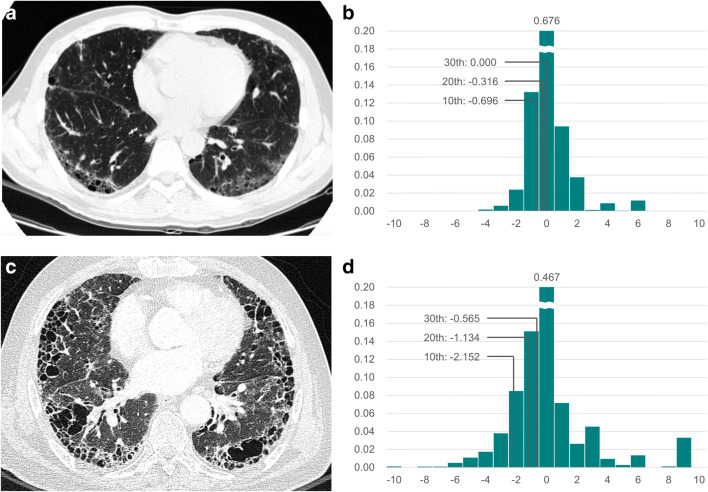
Objectives: To quantify the heterogeneity of fibrosis boundaries in idiopathic pulmonary fibrosis (IPF) using the Gaussian curvature analysis for evaluating disease severity and predicting survival.
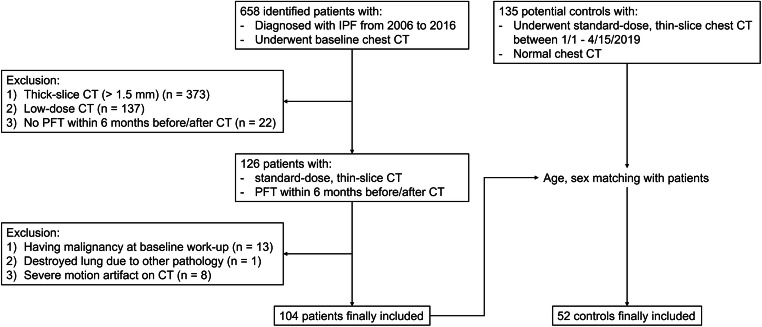
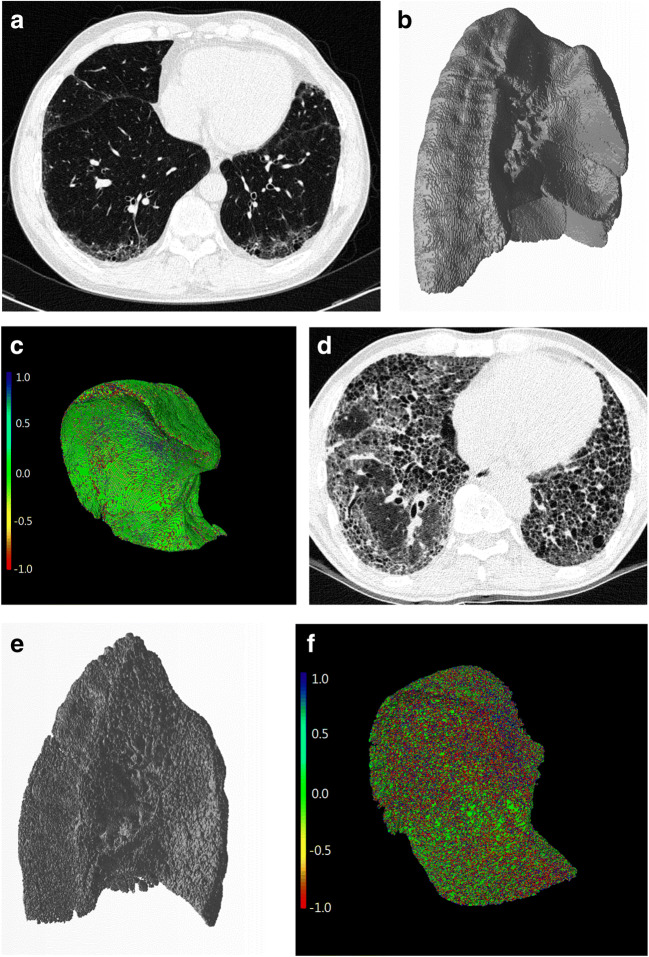
Methods: We retrospectively included 104 IPF patients and 52 controls who underwent baseline chest CT scans. Normal lungs below - 500 HU were segmented, and the boundary was three-dimensionally reconstructed using in-house software. Gaussian curvature analysis provided histogram features on the heterogeneity of the fibrosis boundary. We analyzed the correlations between histogram features and the gender-age-physiology (GAP) and CT fibrosis scores. We built a regression model to predict diffusing capacity of carbon monoxide (DLCO) using the histogram features and calculated the modified GAP (mGAP) score by replacing DLCO with the predicted DLCO. The performances of the GAP, CT-GAP, and mGAP scores were compared using 100 repeated random-split sets.
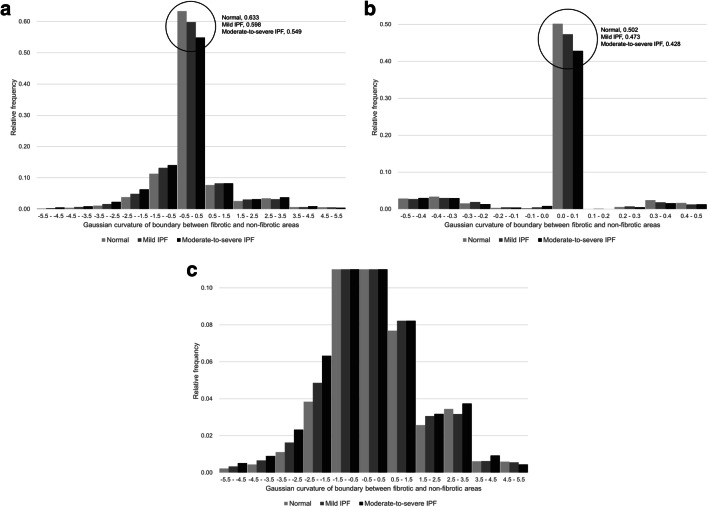
Results: Patients with moderate-to-severe IPF had more numerous Gaussian curvatures at the fibrosis boundary, lower uniformity, and lower 10th to 30th percentiles of Gaussian curvature than controls or patients with mild IPF (all p < 0.0033). The 20th percentile was most significantly correlated with the GAP score (r = - 0.357; p < 0.001) and the CT fibrosis score (r = - 0.343; p = 0.001). More numerous Gaussian curvatures, higher entropy, lower uniformity, and 10th to 30th percentiles (p < 0.001-0.041) were associated with mortality. The mGAP score was comparable to the GAP and CT-GAP scores for survival prediction (mean C-indices, 0.76 vs. 0.79 vs. 0.77, respectively).
Conclusions: Gaussian curvatures of fibrosis boundaries became more heterogeneous as the disease progressed, and heterogeneity was negatively associated with survival in IPF.
Key points: • Gaussian curvature of the fibrotic lung boundary was more heterogeneous in patients with moderate-to-severe IPF than those with mild IPF or normal controls. • The 20th percentile of the Gaussian curvature of the fibrosis boundary was linearly correlated with the GAP score and the CT fibrosis score. • A modified GAP score that replaced the diffusing capacity of carbon monoxide with a composite measure using histogram features of the Gaussian curvature of the fibrosis boundary showed a comparable ability to predict survival to both the GAP and the CT-GAP score.
Keywords: Idiopathic pulmonary fibrosis; Lung; Quantitative evaluation; Tomography, X-ray computed.
Conflict of interest statement
Soon Ho Yoon is the chief medical officer of MEDICAL IP Co. Ltd. outside this work. Other authors of this manuscript declare no relationships with any companies whose products or services may be related to the subject matter of the article.
Figures
Similar articles
-
Quantitative CT analysis of idiopathic pulmonary fibrosis and correlation with lung function study.BMC Pulm Med. 2024 Sep 5;24(1):437. doi: 10.1186/s12890-024-03254-9. BMC Pulm Med. 2024. PMID: 39238010 Free PMC article.
-
Prognostic value of deep learning-based fibrosis quantification on chest CT in idiopathic pulmonary fibrosis.Eur Radiol. 2023 May;33(5):3144-3155. doi: 10.1007/s00330-023-09534-y. Epub 2023 Mar 16. Eur Radiol. 2023. PMID: 36928568
-
Comparison of the quantitative CT imaging biomarkers of idiopathic pulmonary fibrosis at baseline and early change with an interval of 7 months.Acad Radiol. 2015 Jan;22(1):70-80. doi: 10.1016/j.acra.2014.08.004. Epub 2014 Sep 26. Acad Radiol. 2015. PMID: 25262954
-
Computer-based quantitative computed tomography image analysis in idiopathic pulmonary fibrosis: A mini review.Respir Investig. 2018 Jan;56(1):5-13. doi: 10.1016/j.resinv.2017.10.003. Epub 2017 Dec 7. Respir Investig. 2018. PMID: 29325682 Review.
-
The applications of CT with artificial intelligence in the prognostic model of idiopathic pulmonary fibrosis.Ther Adv Respir Dis. 2024 Jan-Dec;18:17534666241282538. doi: 10.1177/17534666241282538. Ther Adv Respir Dis. 2024. PMID: 39382448 Free PMC article. Review.
Cited by
-
Otilonium bromide ameliorates pulmonary fibrosis in mice through activating phosphatase PPM1A.Acta Pharmacol Sin. 2025 Jan;46(1):107-121. doi: 10.1038/s41401-024-01368-8. Epub 2024 Aug 19. Acta Pharmacol Sin. 2025. PMID: 39160244
-
Idiopathic pulmonary fibrosis: Current and future treatment.Clin Respir J. 2022 Feb;16(2):84-96. doi: 10.1111/crj.13466. Epub 2022 Jan 10. Clin Respir J. 2022. PMID: 35001525 Free PMC article. Review.
-
Identification of risk factors for acute exacerbation of idiopathic pulmonary fibrosis based on baseline high-resolution computed tomography: a prospective observational study.BMC Pulm Med. 2024 Jul 19;24(1):352. doi: 10.1186/s12890-024-03172-w. BMC Pulm Med. 2024. PMID: 39030536 Free PMC article.
-
Developing an IPF Prognostic Model and Screening for Key Genes Based on Cold Exposure-Related Genes Using Bioinformatics Approaches.Biomedicines. 2025 Mar 11;13(3):690. doi: 10.3390/biomedicines13030690. Biomedicines. 2025. PMID: 40149666 Free PMC article.
References
MeSH terms
Grants and funding
LinkOut - more resources
Full Text Sources
Other Literature Sources
Miscellaneous
