. 2021 Apr 1;320(4):R438-R451.
doi: 10.1152/ajpregu.00281.2020. Epub 2021 Jan 13.

Dissociable effects of dietary sodium in early life upon somatic growth, fluid homeostasis, and spatial memory in mice of both sexes

Affiliations

Dissociable effects of dietary sodium in early life upon somatic growth, fluid homeostasis, and spatial memory in mice of both sexes

Jeffrey L Segar et al. Am J Physiol Regul Integr Comp Physiol. .

Abstract

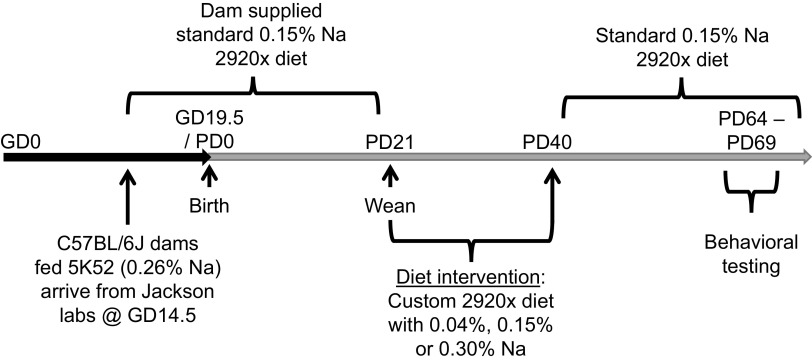
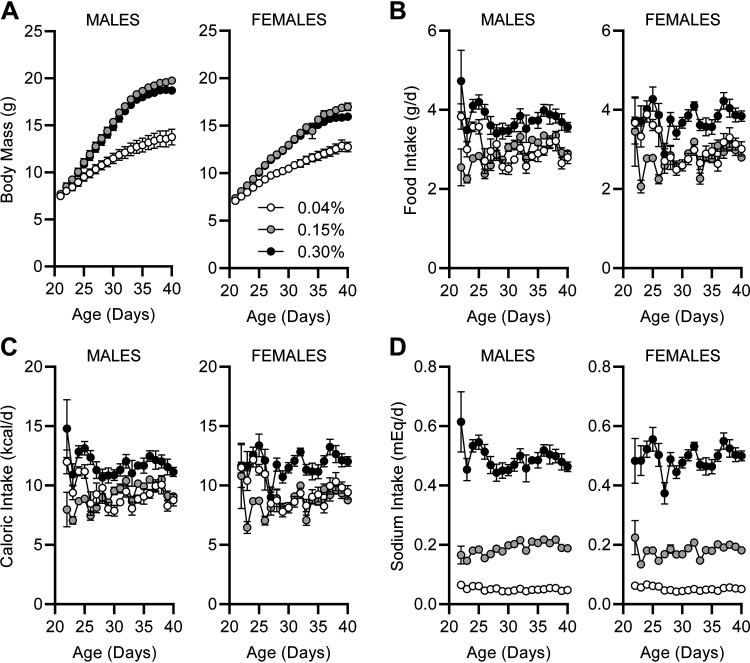
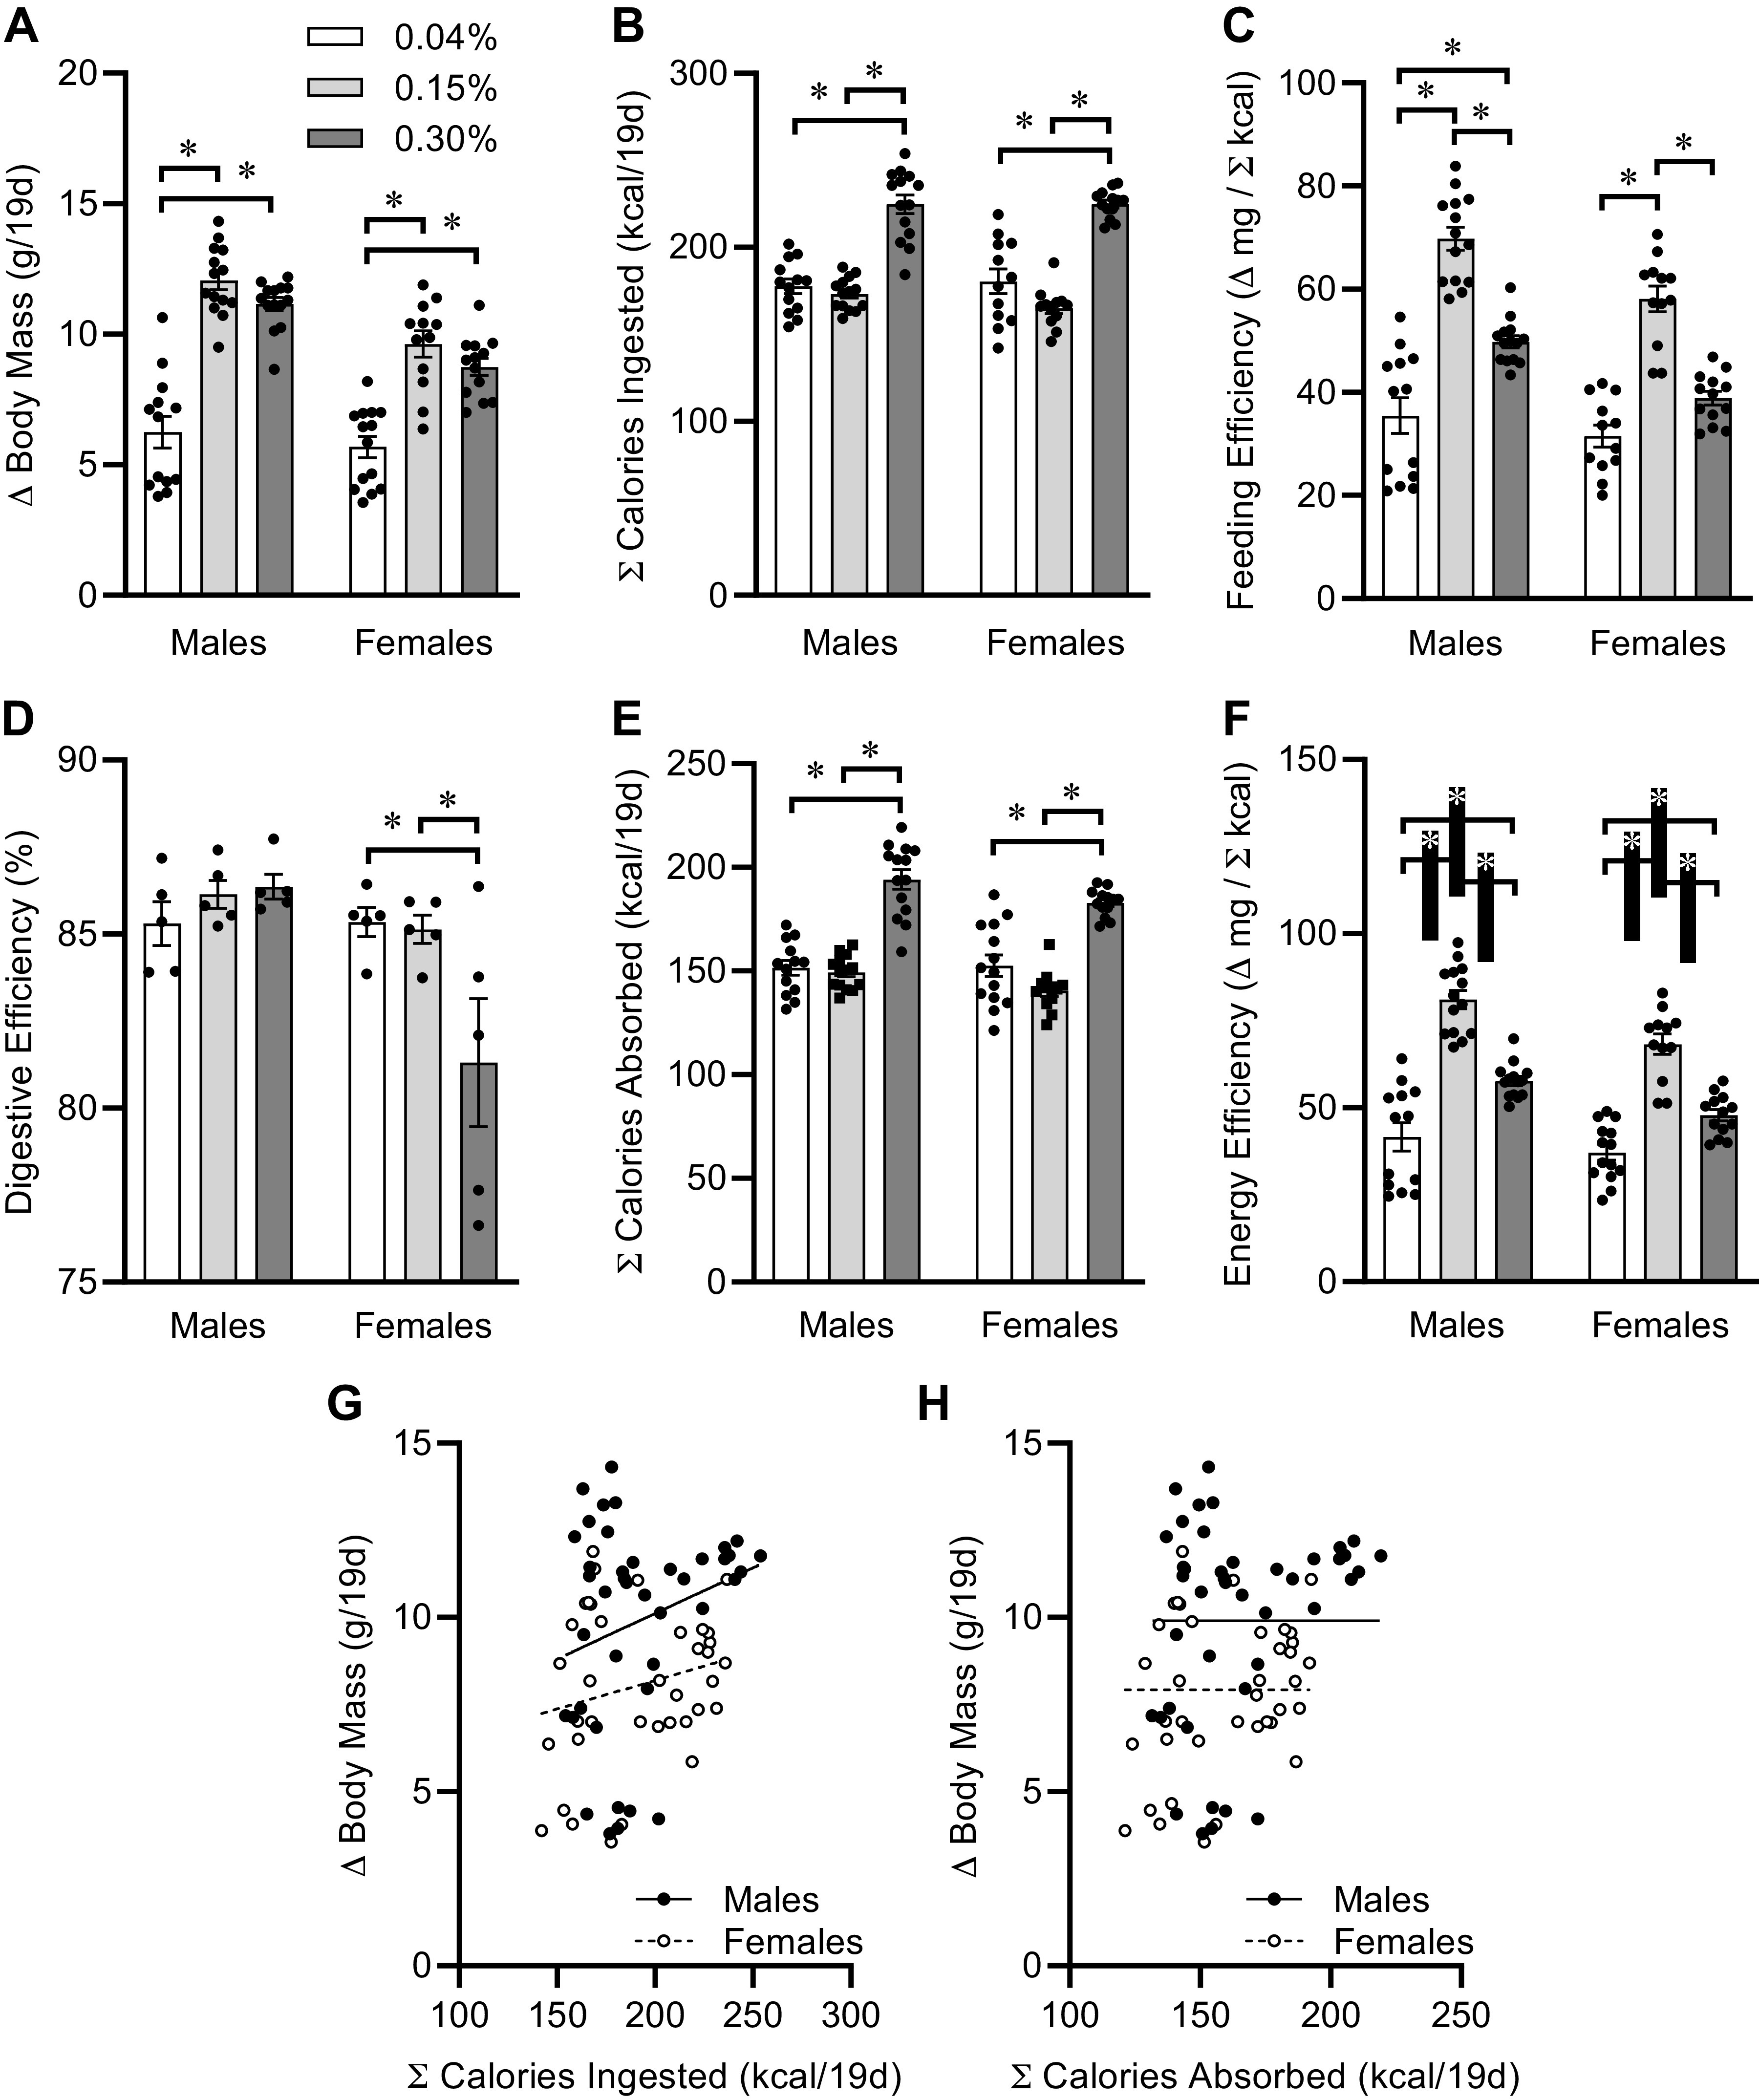
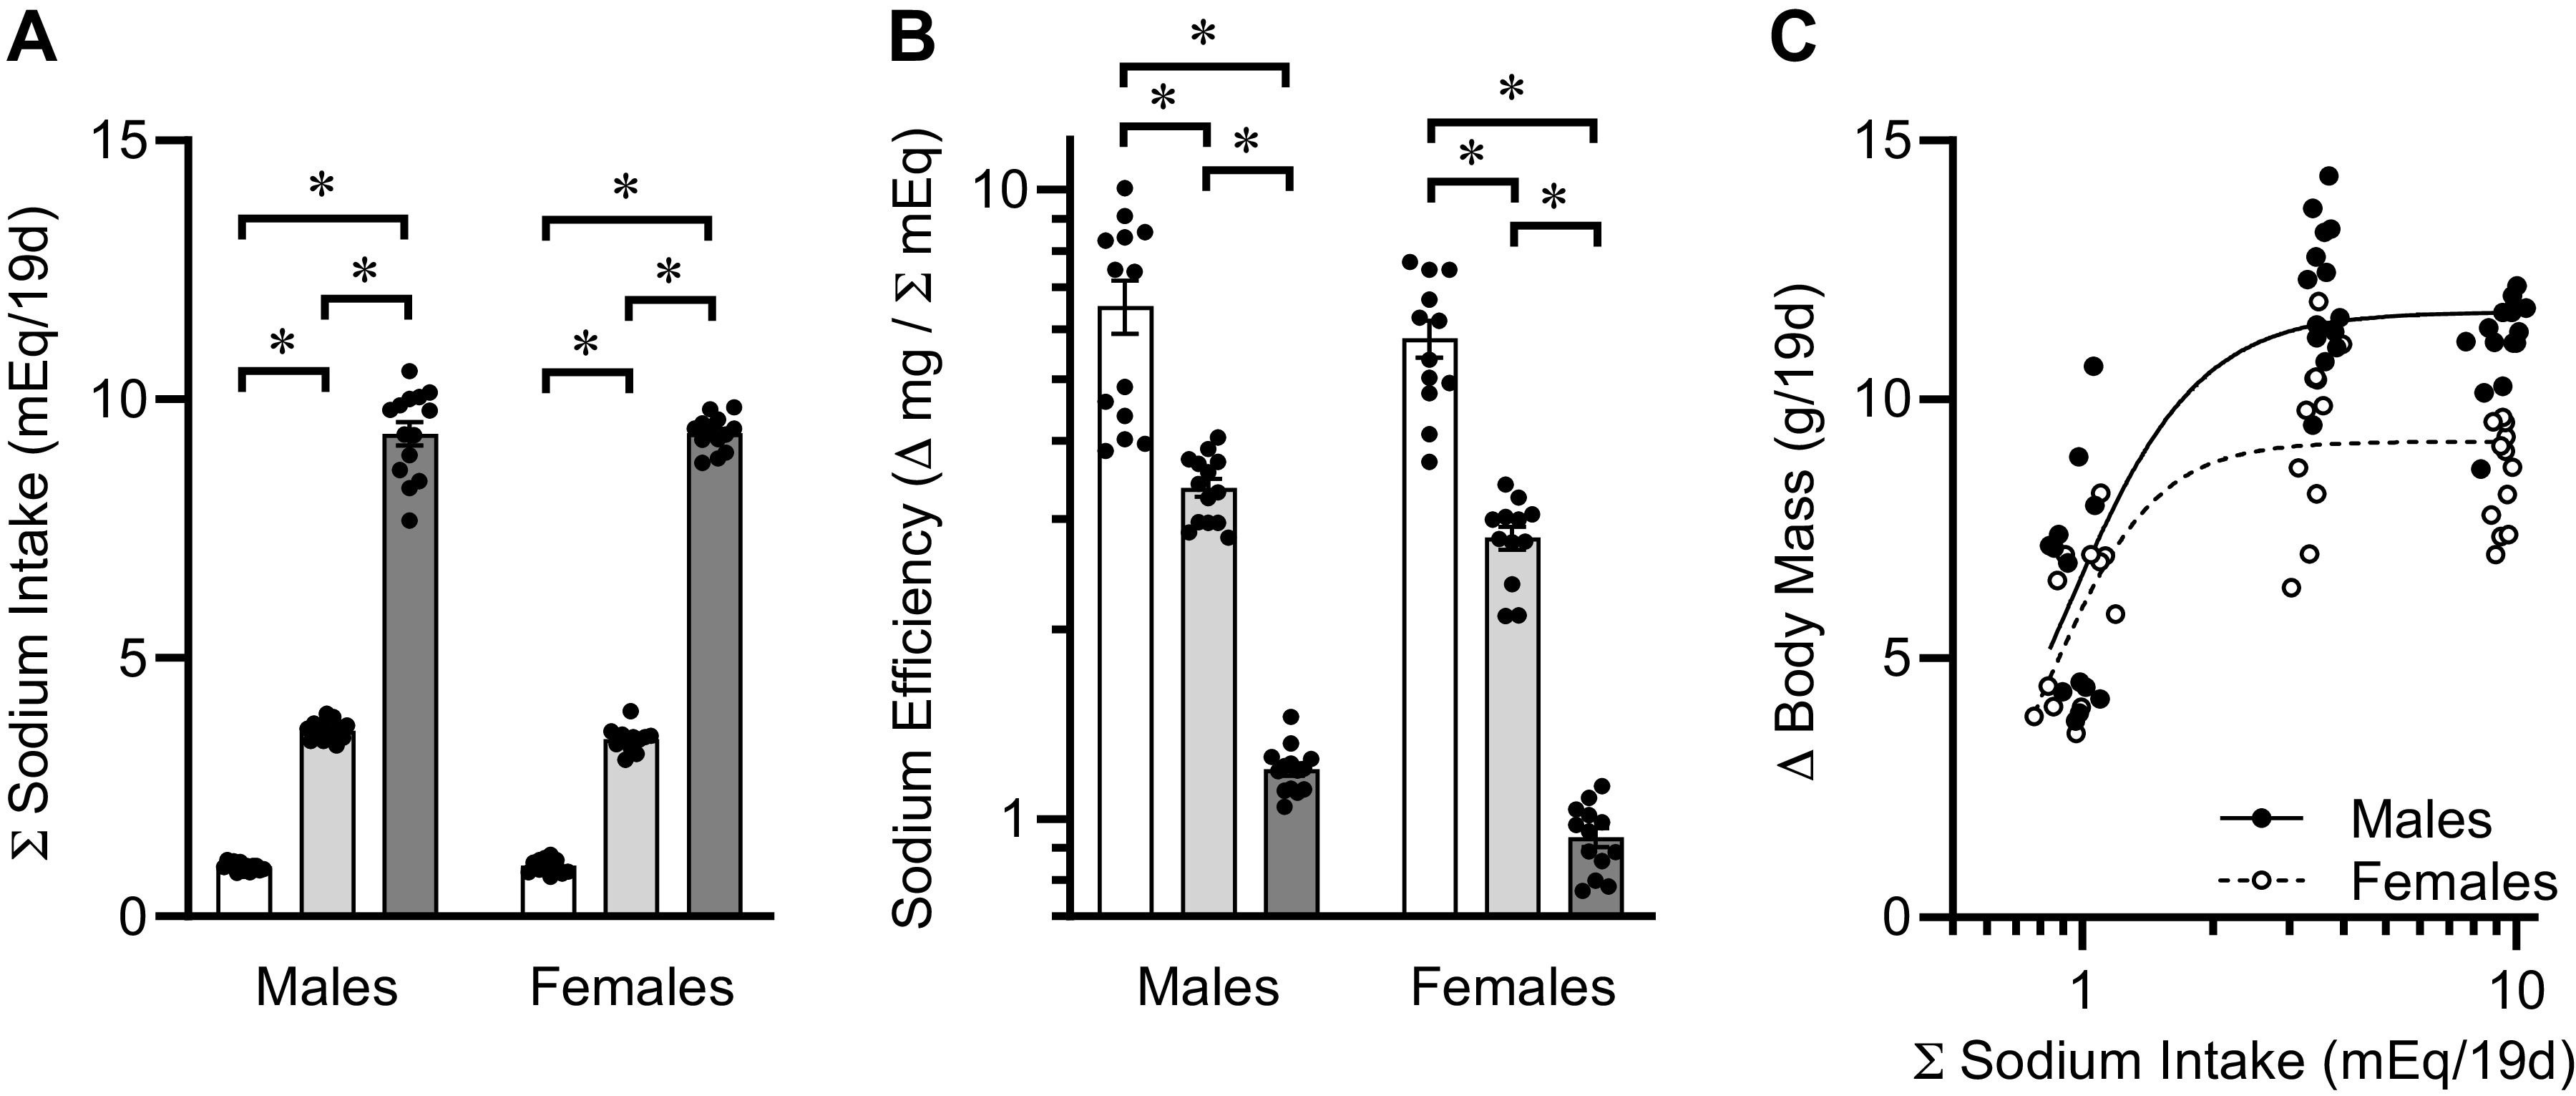
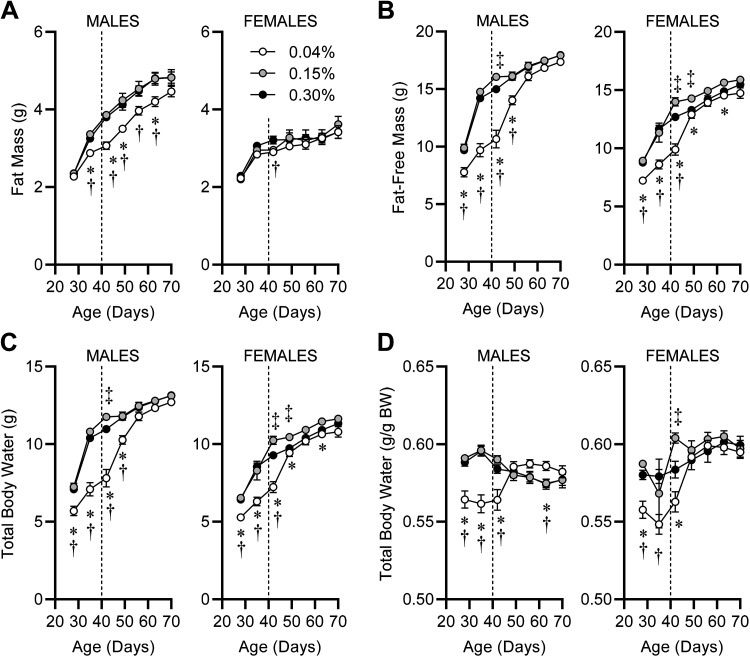
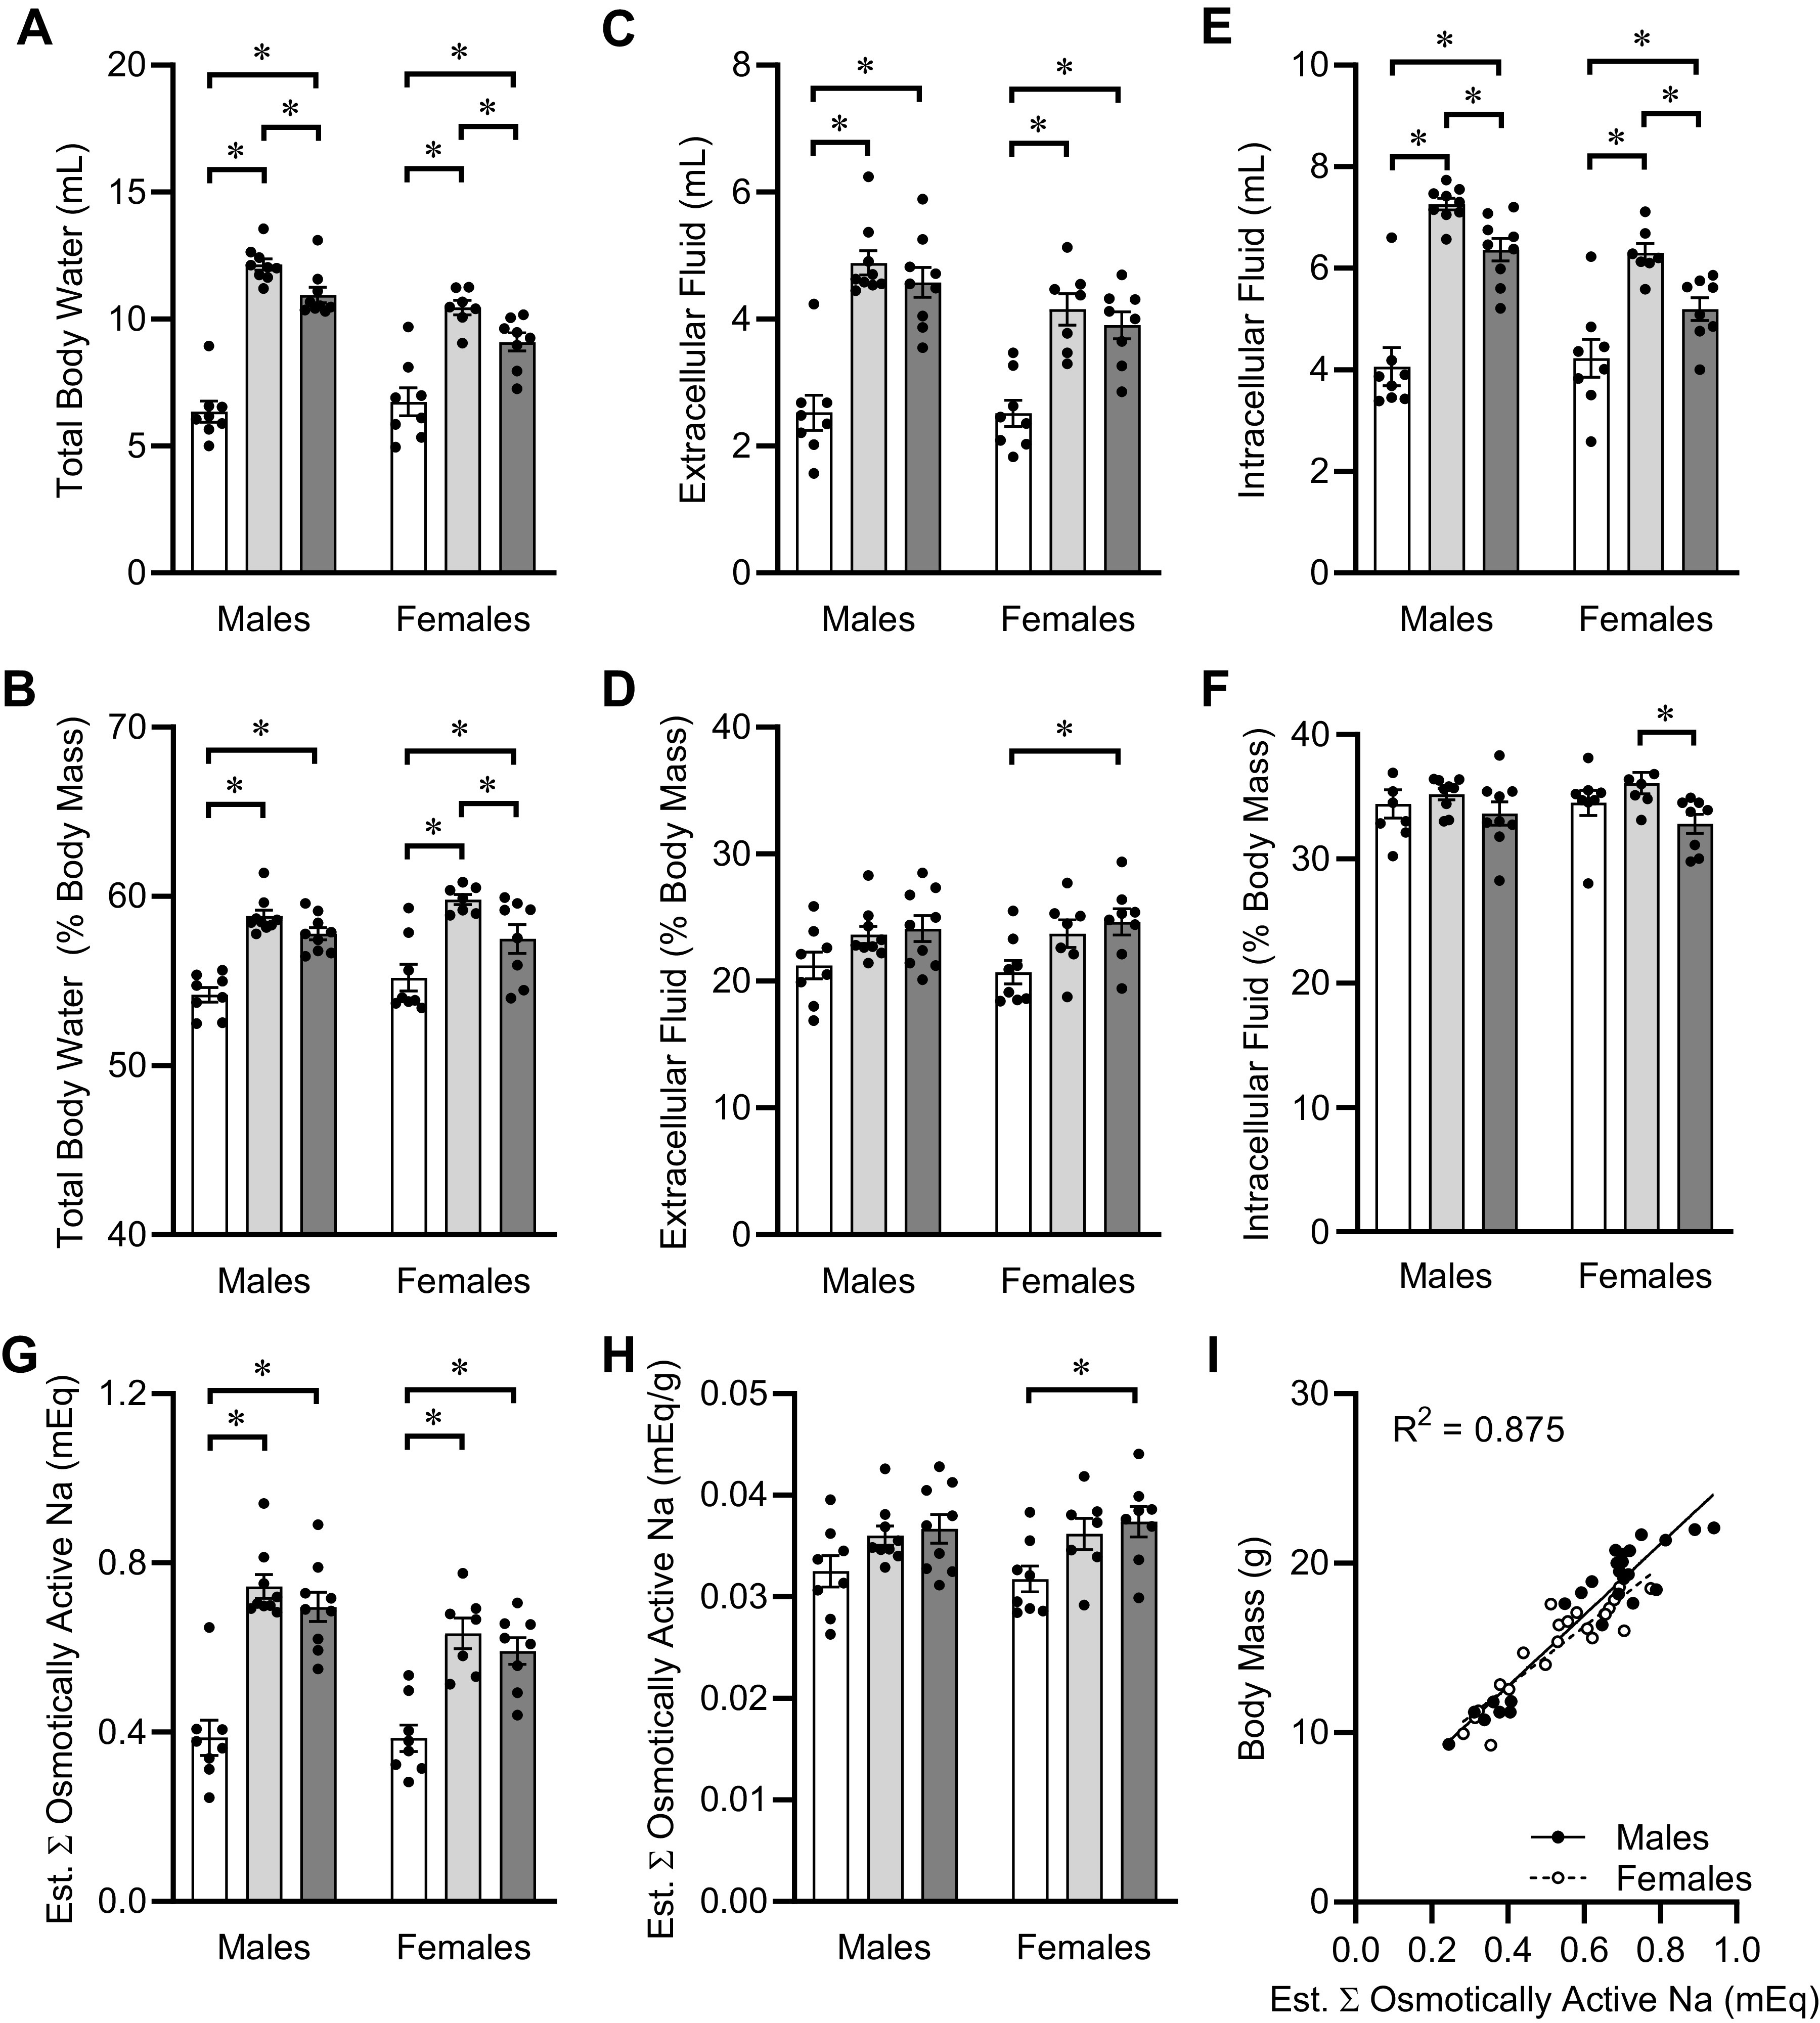
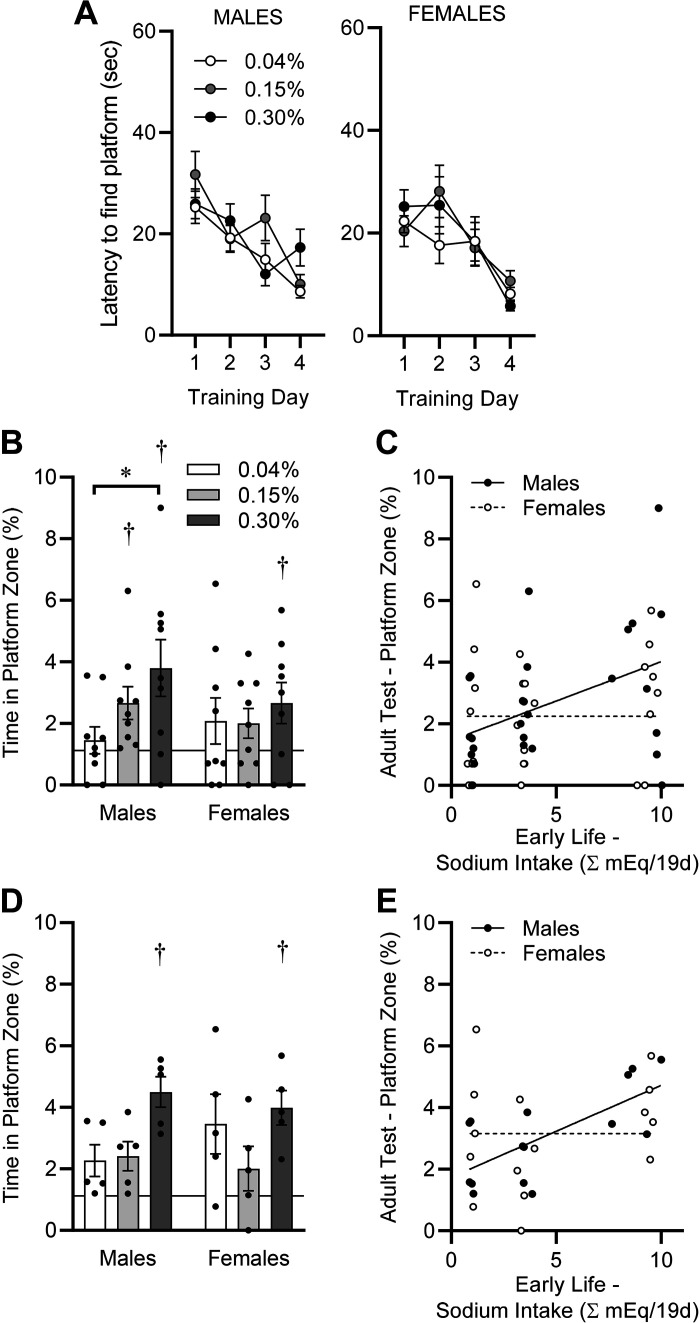
Postnatal growth failure is a common morbidity for preterm infants and is associated with adverse neurodevelopmental outcomes. Although sodium (Na) deficiency early in life impairs somatic growth, its impact on neurocognitive functions has not been extensively studied. We hypothesized that Na deficiency during early life is sufficient to cause growth failure and program neurobehavioral impairments in later life. C57BL/6J mice were placed on low- (0.4), normal- (1.5), or high- (3 g/kg) Na chow at weaning (PD22) and continued on the diet for 3 wk (to PD40). Body composition and fluid distribution were determined serially by time-domain NMR and bioimpedance spectroscopy, and anxiety, learning, and memory were assessed using the elevated plus maze and Morris water maze paradigms in later adulthood (PD63-PD69). During the diet intervention, body mass gains were suppressed in the low- compared with normal- and high-Na groups despite similar caloric uptake rates across groups. Fat mass was reduced in males but not in females fed low-Na diet. Fat-free mass and hydration were significantly reduced in both males and females fed the low-Na diet, although rapidly corrected after return to normal diet. Measures of anxiety-like behavior and learning in adulthood were not affected by diet in either sex, yet memory performance was modified by a complex interaction between sex and early life Na intake. These data support the concepts that Na deficiency impairs growth and that the amount of Na intake which supports optimal somatic growth during early life may be insufficient to fully support neurocognitive development.

Keywords: growth; neurobehavior; sodium.


Conflict of interest statement

No conflicts of interest, financial or otherwise, are declared by the authors.

Figures

Figure 1.
Figure 1.
Study design. Graphic illustrating experiment design.
Figure 2.
Figure 2.
Effects of postweaning dietary Na manipulation upon body mass and ingestive behaviors. A: body masses of mice while receiving custom-modified 2920 diets containing 0.04%, 0.15%, or 0.30% Na from weaning at PD21, for 3 wk. For both sexes, diet P < 0.05, age P < 0.005, and diet × age P < 0.05. By Tukey’s multiple comparisons procedure, 0.04% Na diet caused reduced weight gain (P < 0.05) vs. the other two diet groups starting at PD25. B: daily food intake by mass. For both sexes, diet P < 0.05, age P < 0.05, and diet × age P < 0.05. C: daily caloric ingestion. For both sexes, diet P < 0.05, age P < 0.05, and diet × age P < 0.05. D: daily Na ingestion. For males, diet P < 0.05, age P = 0.12, and diet × age P < 0.05, and for females, diet P < 0.05, age P = 0.05, and diet × age P = 0.08. For all panels, males: 0.04%, n = 13; 0.15%, n = 14; 0.30%, n = 14; and females: 0.04%, n = 14; 0.15%, n = 12; 0.30%, n = 13.
Figure 3.
Figure 3.
Contribution of caloric intake to postweaning growth. A: change in body masses from weaning at PD21 to PD40, of mice fed custom-modified 2920 diets containing 0.04%, 0.15%, or 0.30% Na. Diet P < 0.05, sex P < 0.05, diet × sex P < 0.05. B: total calories ingested PD21 to PD40. Diet P < 0.05, sex P = 0.63, diet × sex P = 0.43. C: feeding efficiency. Diet P < 0.05, sex P < 0.05, diet × sex P = 0.18. D: digestive efficiency determined on PD40 in a subset of animals. Diet P = 0.10, sex P < 0.05, diet × sex P < 0.05. E: estimate of total calories absorbed PD21 to PD40. Diet P < 0.05, sex P < 0.05, diet × sex P = 0.21. F: energy efficiency. Diet P < 0.05, sex P < 0.05, diet × sex P = 0.27. G: linear regression of change in body mass vs. total calories ingested, PD21 to PD40. Males R2 = 0.06, P = 0.12 vs. slope 0; females R2 = 0.05, P = 0.19 vs. slope 0. H: linear regression of change in body mass vs. total calories absorbed, PD21 to PD40. Males R2 = 0.07, P = 0.09 vs. slope 0; females R2 = 0.06, P = 0.14 vs. slope 0. For all panels, summary data presented as means ± SE, *P < 0.05 by Tukey’s multiple comparison procedure. Dots represent individual animals. For A–C and E–H, males: 0.04%, n = 13; 0.15%, n = 14; 0.30%, n = 14; and females: 0.04%, n = 12; 0.15%, n = 12; 0.30%, n = 13. For D, n = 5 for each group.
Figure 4.
Figure 4.
Contribution of Na intake to postweaning growth. A: total Na intake, PD21 to PD40, of mice fed custom-modified 2920 diets containing 0.04%, 0.15%, or 0.30% Na. Diet P < 0.05, sex P = 0.60, diet × sex P = 0.66. B: Na efficiency. Diet P < 0.05, sex P < 0.05, diet × sex P = 0.34. C: regression of body mass gains vs. total Na intake, PD21 to PD40. Nonlinear regression was performed using 4-parameter fit, with minimum constrained at 0. Hillslope for males = 2.85 ± 1.56 and females = 3.52 ± 1.63, P = 0.69. EC50 for males = 0.91 ± 0.06 and females = 0.84 ± 0.07, P = 0.40. Max growth for males = 11.69 ± 0.43 and females = 9.19 ± 0.31, P < 0.05. For all panels, summary data presented as means ± SE, *P < 0.05 by Tukey’s multiple comparison procedure. Dots represent individual animals. For all panels, males: 0.04%, n = 13; 0.15%, n = 14; 0.30%, n = 14; and females: 0.04%, n = 12; 0.15%, n = 12; 0.30%, n = 13.
Figure 5.
Figure 5.
Body composition during and following postwean dietary Na manipulation. A: fat masses from PD21 to PD70 of mice fed custom-modified 2920 diets containing 0.04%, 0.15%, or 0.30% Na. For males, diet P < 0.05, age P < 0.05, diet × age P < 0.05. For females, diet P = 0.41, age P < 0.05, diet × age P = 0.69. B: fat-free masses. For both sexes, diet P < 0.05, age P < 0.05, diet × age P < 0.05. C: total body water, estimated as 73.2% of fat-free mass. For both sexes, diet P < 0.05, age P < 0.05, diet × age P < 0.05. D: total body water normalized to total body mass. For males, diet P = 0.09, age P = 0.07, diet × age P < 0.05. For females, diet P = 0.05, age P < 0.05, diet × age P < 0.05. For all panels, *P < 0.05 for 0.04% vs. 0.15% Na diet; †P < 0.05 for 0.04% vs. 0.30% Na diet. ‡P < 0.05 for 0.15% vs. 0.30% Na diet by Tukey’s multiple comparison procedure. For all panels PD28PD42, males: 0.04%, n = 13; 0.15%, n = 14; 0.30%, n = 14; and females: 0.04%, n = 14; 0.15%, n = 12; 0.30%, n = 13. For all panels PD49PD70, n = 9 for all groups.
Figure 6.
Figure 6.
Fluid compartmentalization and total body Na content at PD40. A: total body water, estimated at 73.2% of fat-free mass by nuclear magnetic resonance (NMR). Diet P < 0.05, sex P < 0.05, diet × sex P < 0.05. B: total body water normalized to total body mass. Diet P < 0.05, sex P = 0.23, diet × sex P = 0.40. C: extracellular fluid, determined by bioimpedance spectroscopy (BIS). Diet P < 0.05, sex P < 0.05, diet × sex P = 0.24. D: extracellular fluid normalized to total body mass. Diet P < 0.05, sex P = 0.98, diet × sex P = 0.86. E: intracellular fluid, determined by BIS. Diet P < 0.05, sex P < 0.05, diet × sex P < 0.05. F: intracellular fluid normalized to total body mass. Diet P < 0.05, sex P = 0.94, diet × sex P = 0.61. G: estimated total osmotically active Na, assuming extracellular fluid at 145 mmol/L Na and intracellular fluid at 5 mmol/L Na. Diet P < 0.05, sex P < 0.05, diet × sex P = 0.21. H: osmotically active Na normalized to total body mass. Diet P < 0.05, sex P = 0.97, diet × sex P = 0.86. I: linear regression of total body mass vs. total osmotically active Na at PD40. Males R2 = 0.89, slope 20.98 ± 1.48 P < 0.05, vs. females R2 = 0.82, slope 17.66 ± 1.83 P < 0.05; comparison of slopes P = 0.18. For all panels, males: 0.04%, n = 8; 0.15%, n = 9; 0.30%, n = 9; and females: 0.04%, n = 8; 0.15%, n = 7; 0.30%, n = 8. *P < 0.05 by Tukey's multiple comparisons procedure.
Figure 7.
Figure 7.
Spatial learning and memory, assessed by Morris water maze paradigm, in adulthood (PD65PD69). A: latency to find platform on training days. Platform was visible on training day 1 and submerged on subsequent training days. Males: diet P = 0.34, day P < 0.05, diet × day P = 0.05; females: diet P = 0.70, day P < 0.05, diet × day P = 0.36. B: time spent within area previously occupied by submerged platform during 30-s probe trial, performed 24 h after final training day. Horizontal line at 1.12% represents chance performance. Diet P = 0.09, sex P = 0.47, diet × sex P = 0.39. C: simple linear regression comparing probe trial performance on PD69 vs. integrated Na intake between PD21 and PD40. Males R2 = 0.18, and P = 0.03 vs. a slope of zero. Females R2 = 0.03 and P = 0.40 vs. a slope of zero. D: reanalysis of data from B, excluding animals that were exposed to isoflurane on PD40. Diet P = 0.01, sex P = 0.86, diet × sex P = 0.36. E: reanalysis of data from C, excluding animals that were exposed to isoflurane on PD40. Males R2 = 0.48 and P < 0.01 vs. a slope of zero. Females R2 = 0.06 and P = 0.39 vs. a slope of zero. For all panels, *P < 0.05 by Tukey’s multiple comparisons procedure, and †P < 0.05 vs. chance performance (1.12%) by one-sample t test. For A–C, n = 9 for all groups; for D and E, n = 5 for all groups.

Similar articles

Cited by

References

    1. Mitchell HH, Carman GG. Does the addition of sodium chloride increase the value of a corn ration for growing animals? J Biol Chem 68: 165–181, 1926. doi:10.1016/S0021-9258(18)84683-X. - DOI
    1. Wassner SJ. Altered growth and protein turnover in rats fed sodium-deficient diets. Pediatr Res 26: 608–613, 1989. doi:10.1203/00006450-198912000-00019. - DOI - PubMed
    1. World Health Organization, International Atomic Energy. Minor and Trace Elements in Breast Milk: Report of a Joint WHO/IAEA Collaborative Study. Atlanta, Geneva: World Health Organization, 1989.
    1. Segar JL, Grobe CC, Grobe JL. Fetal storage of osmotically inactive sodium. Am J Physiol Regul Integr Comp Physiol 318: R512–R514, 2020. doi:10.1152/ajpregu.00336.2019. - DOI - PMC - PubMed
    1. Segar DE, Segar EK, Harshman LA, Dagle JM, Carlson SJ, Segar JL. Physiological approach to sodium supplementation in preterm infants. Amer J Perinatol 35: 994–1000, 2018. doi:10.1055/s-0038-1632366. - DOI - PMC - PubMed

Publication types

Substances

LinkOut - more resources