Comparative Study
. 2021 May 1;320(5):C778-C793.
doi: 10.1152/ajpcell.00460.2020. Epub 2021 Jan 13.

Global changes to HepG2 cell metabolism in response to galactose treatment

Affiliations
Comparative Study

Global changes to HepG2 cell metabolism in response to galactose treatment

R A Skolik et al. Am J Physiol Cell Physiol. .

Abstract

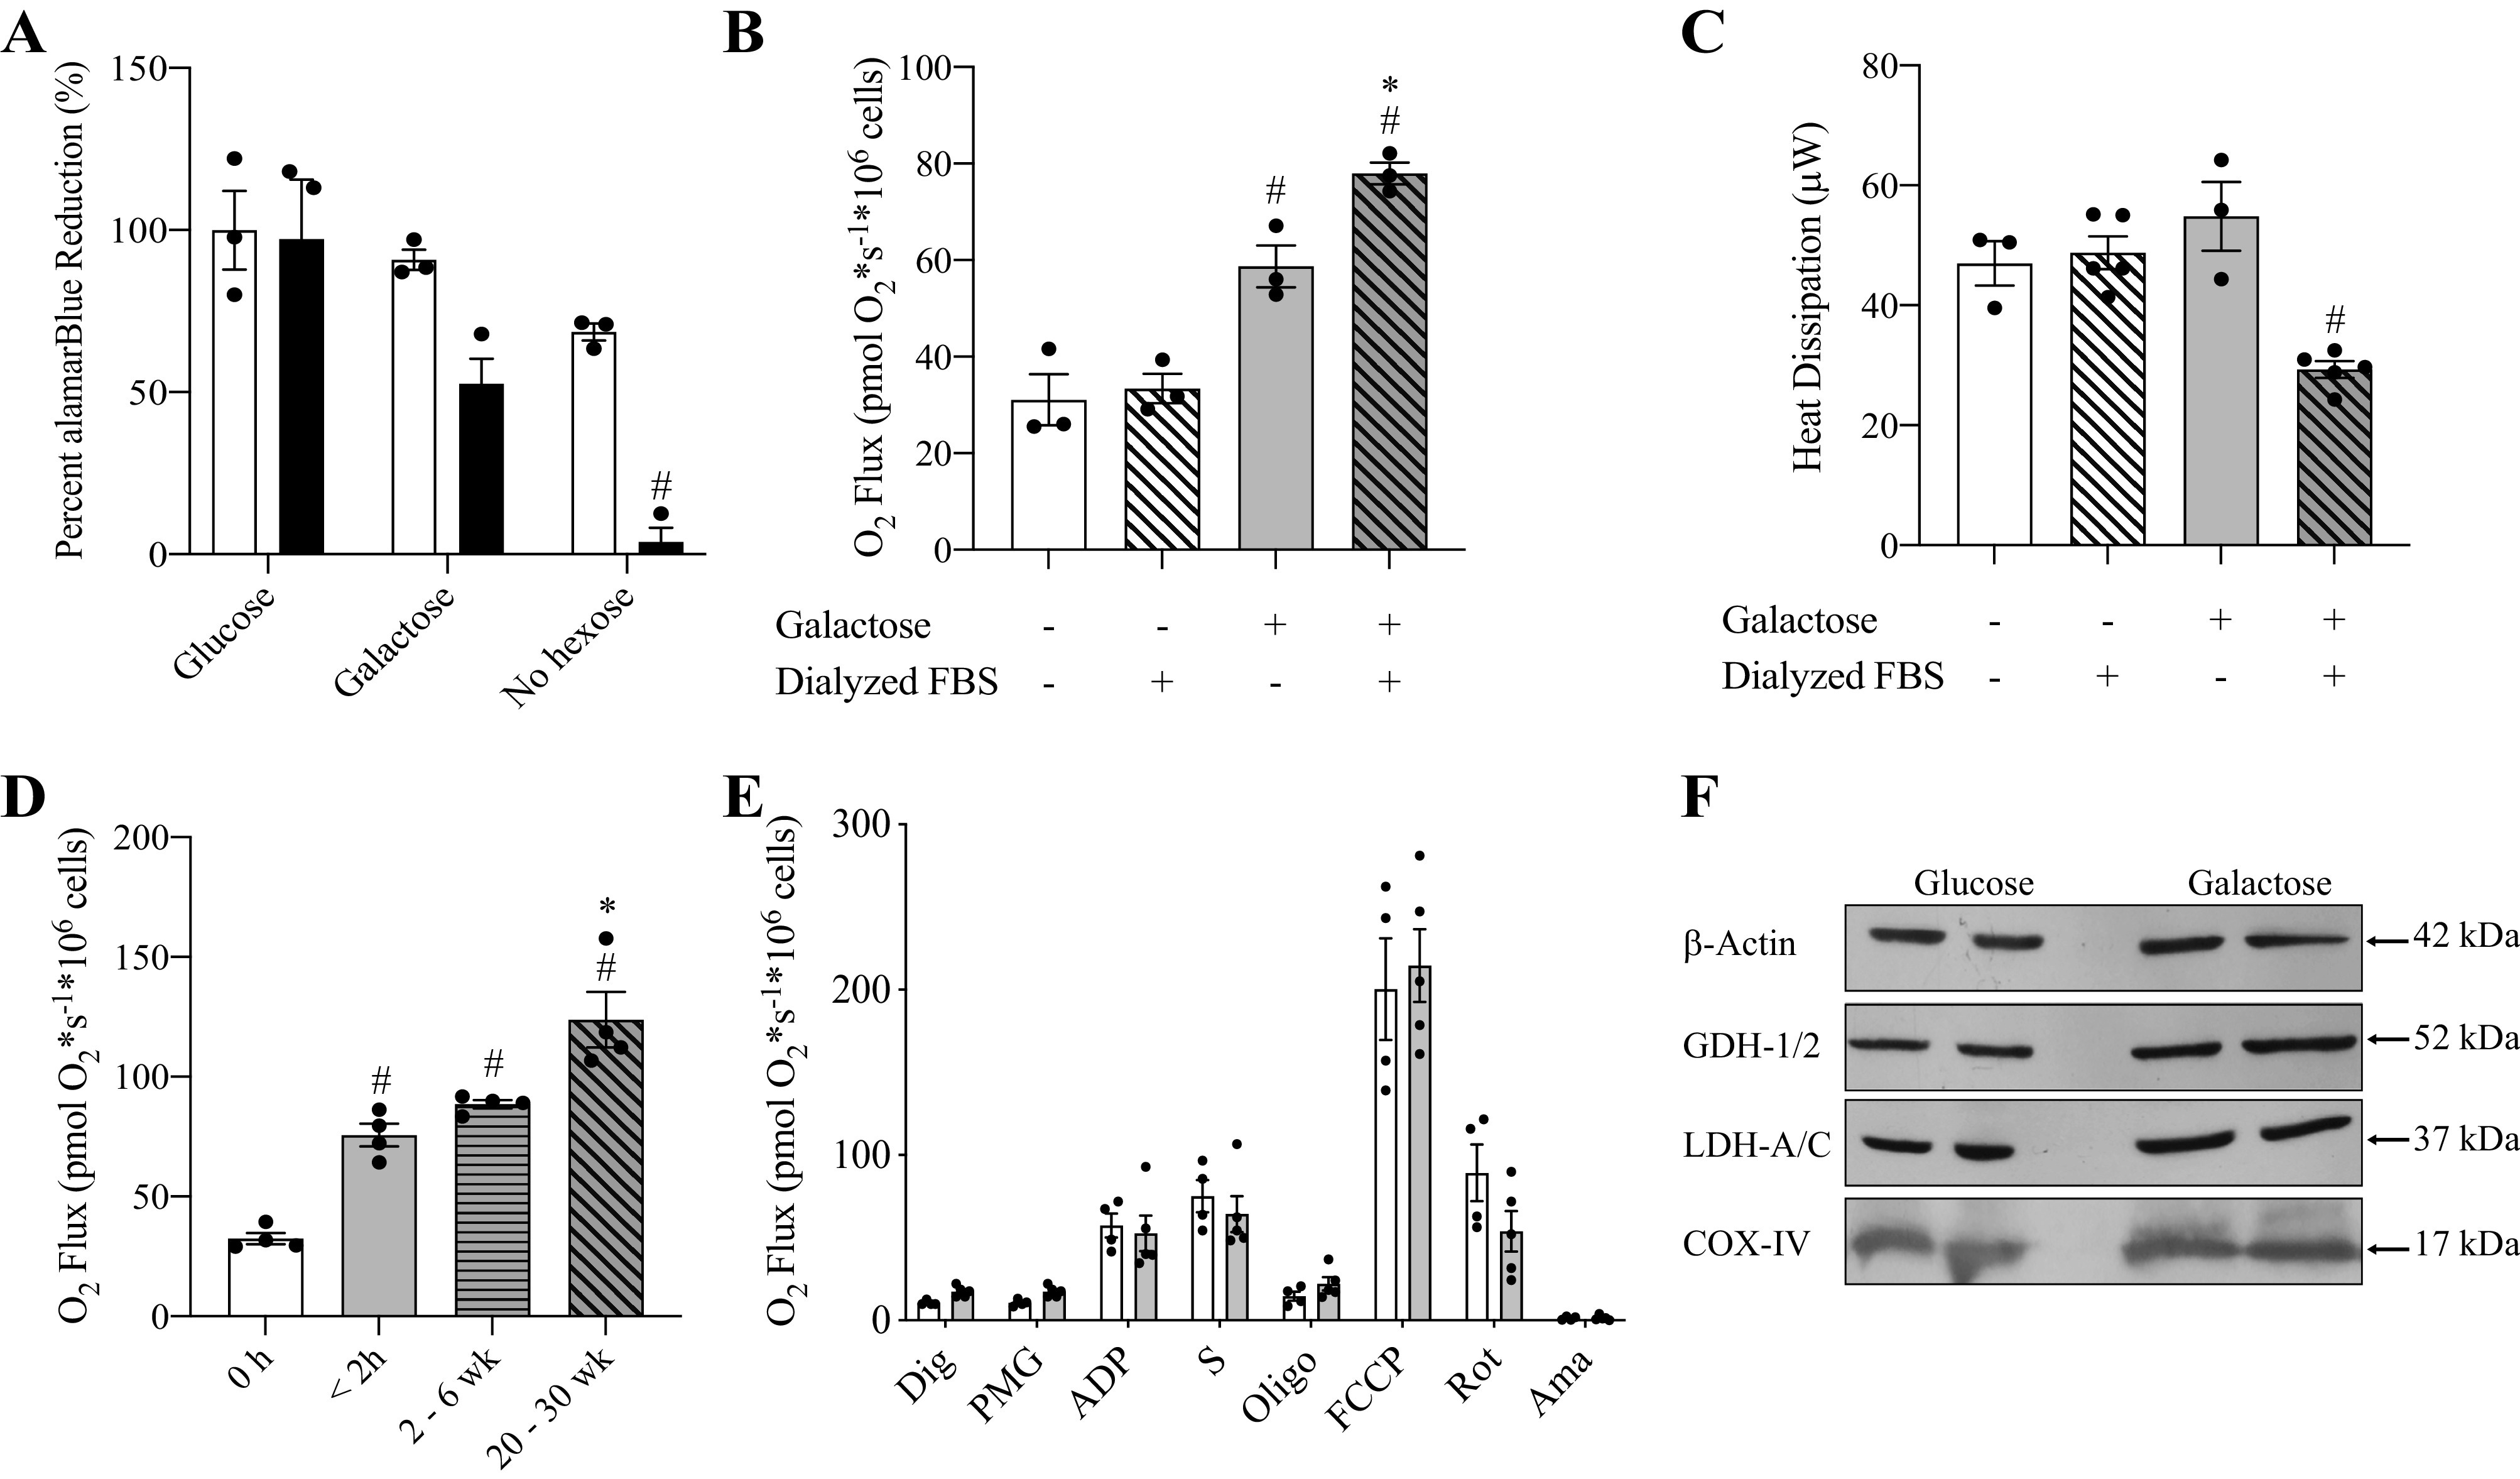
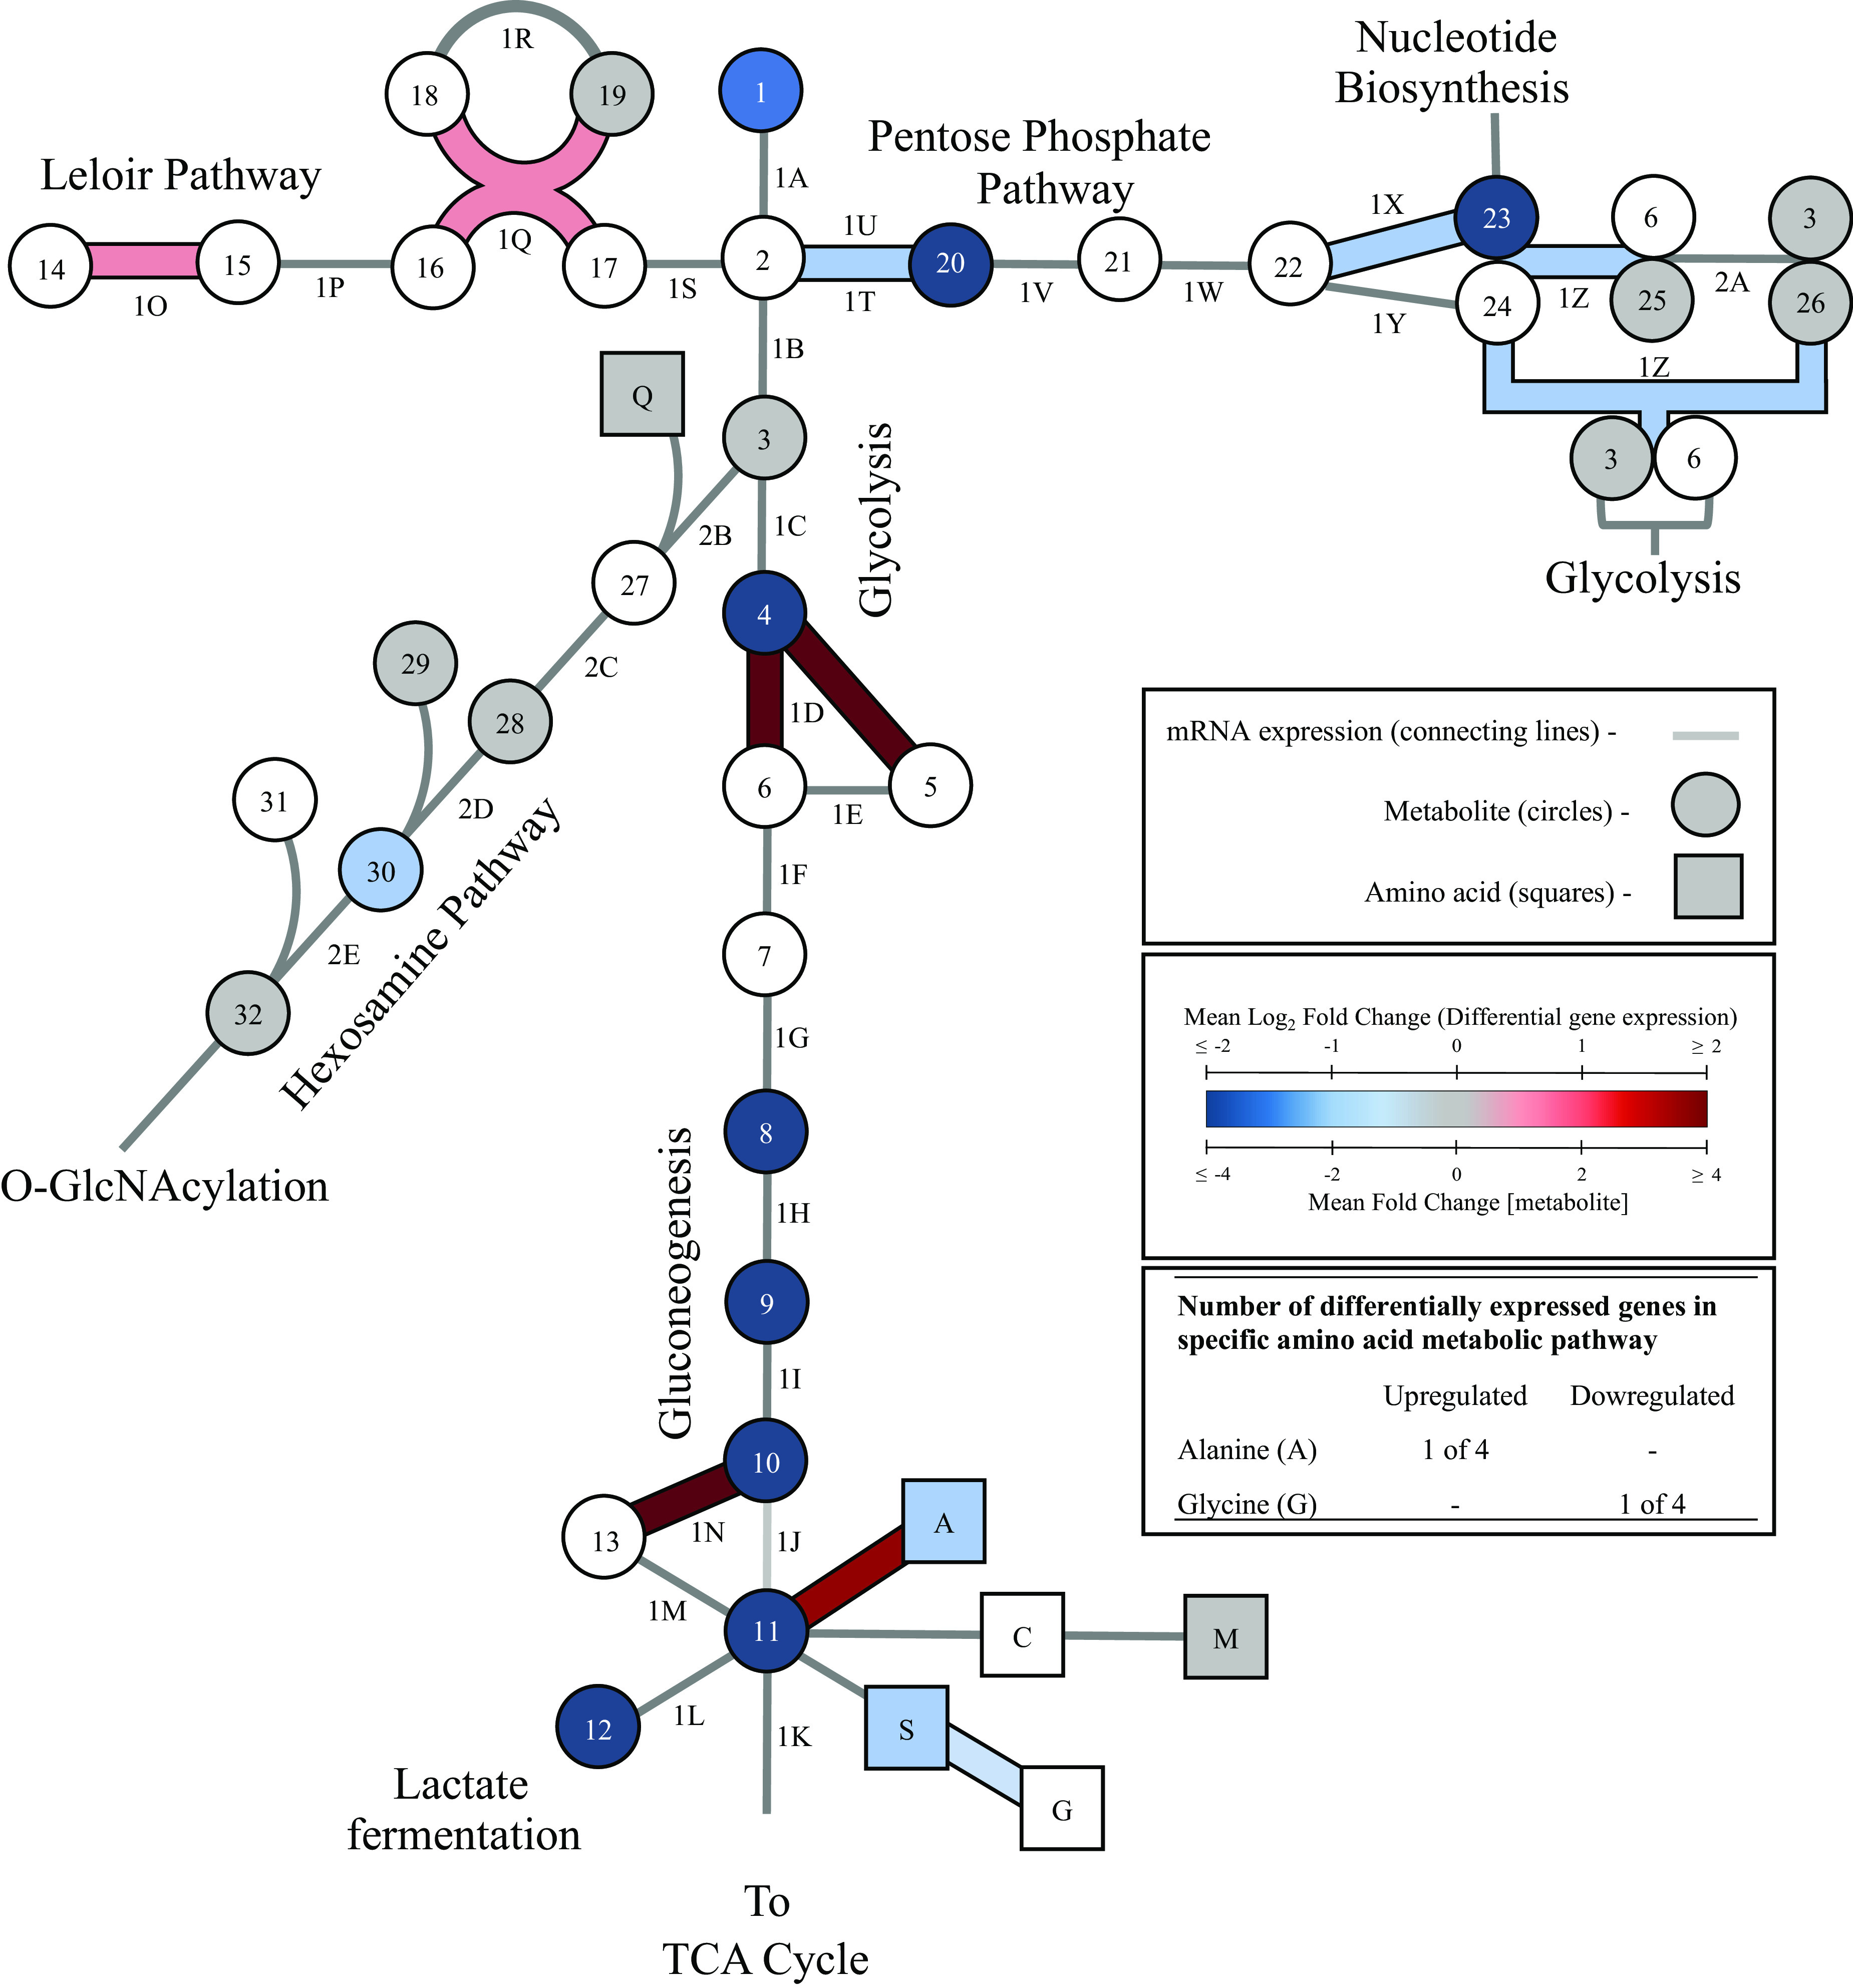
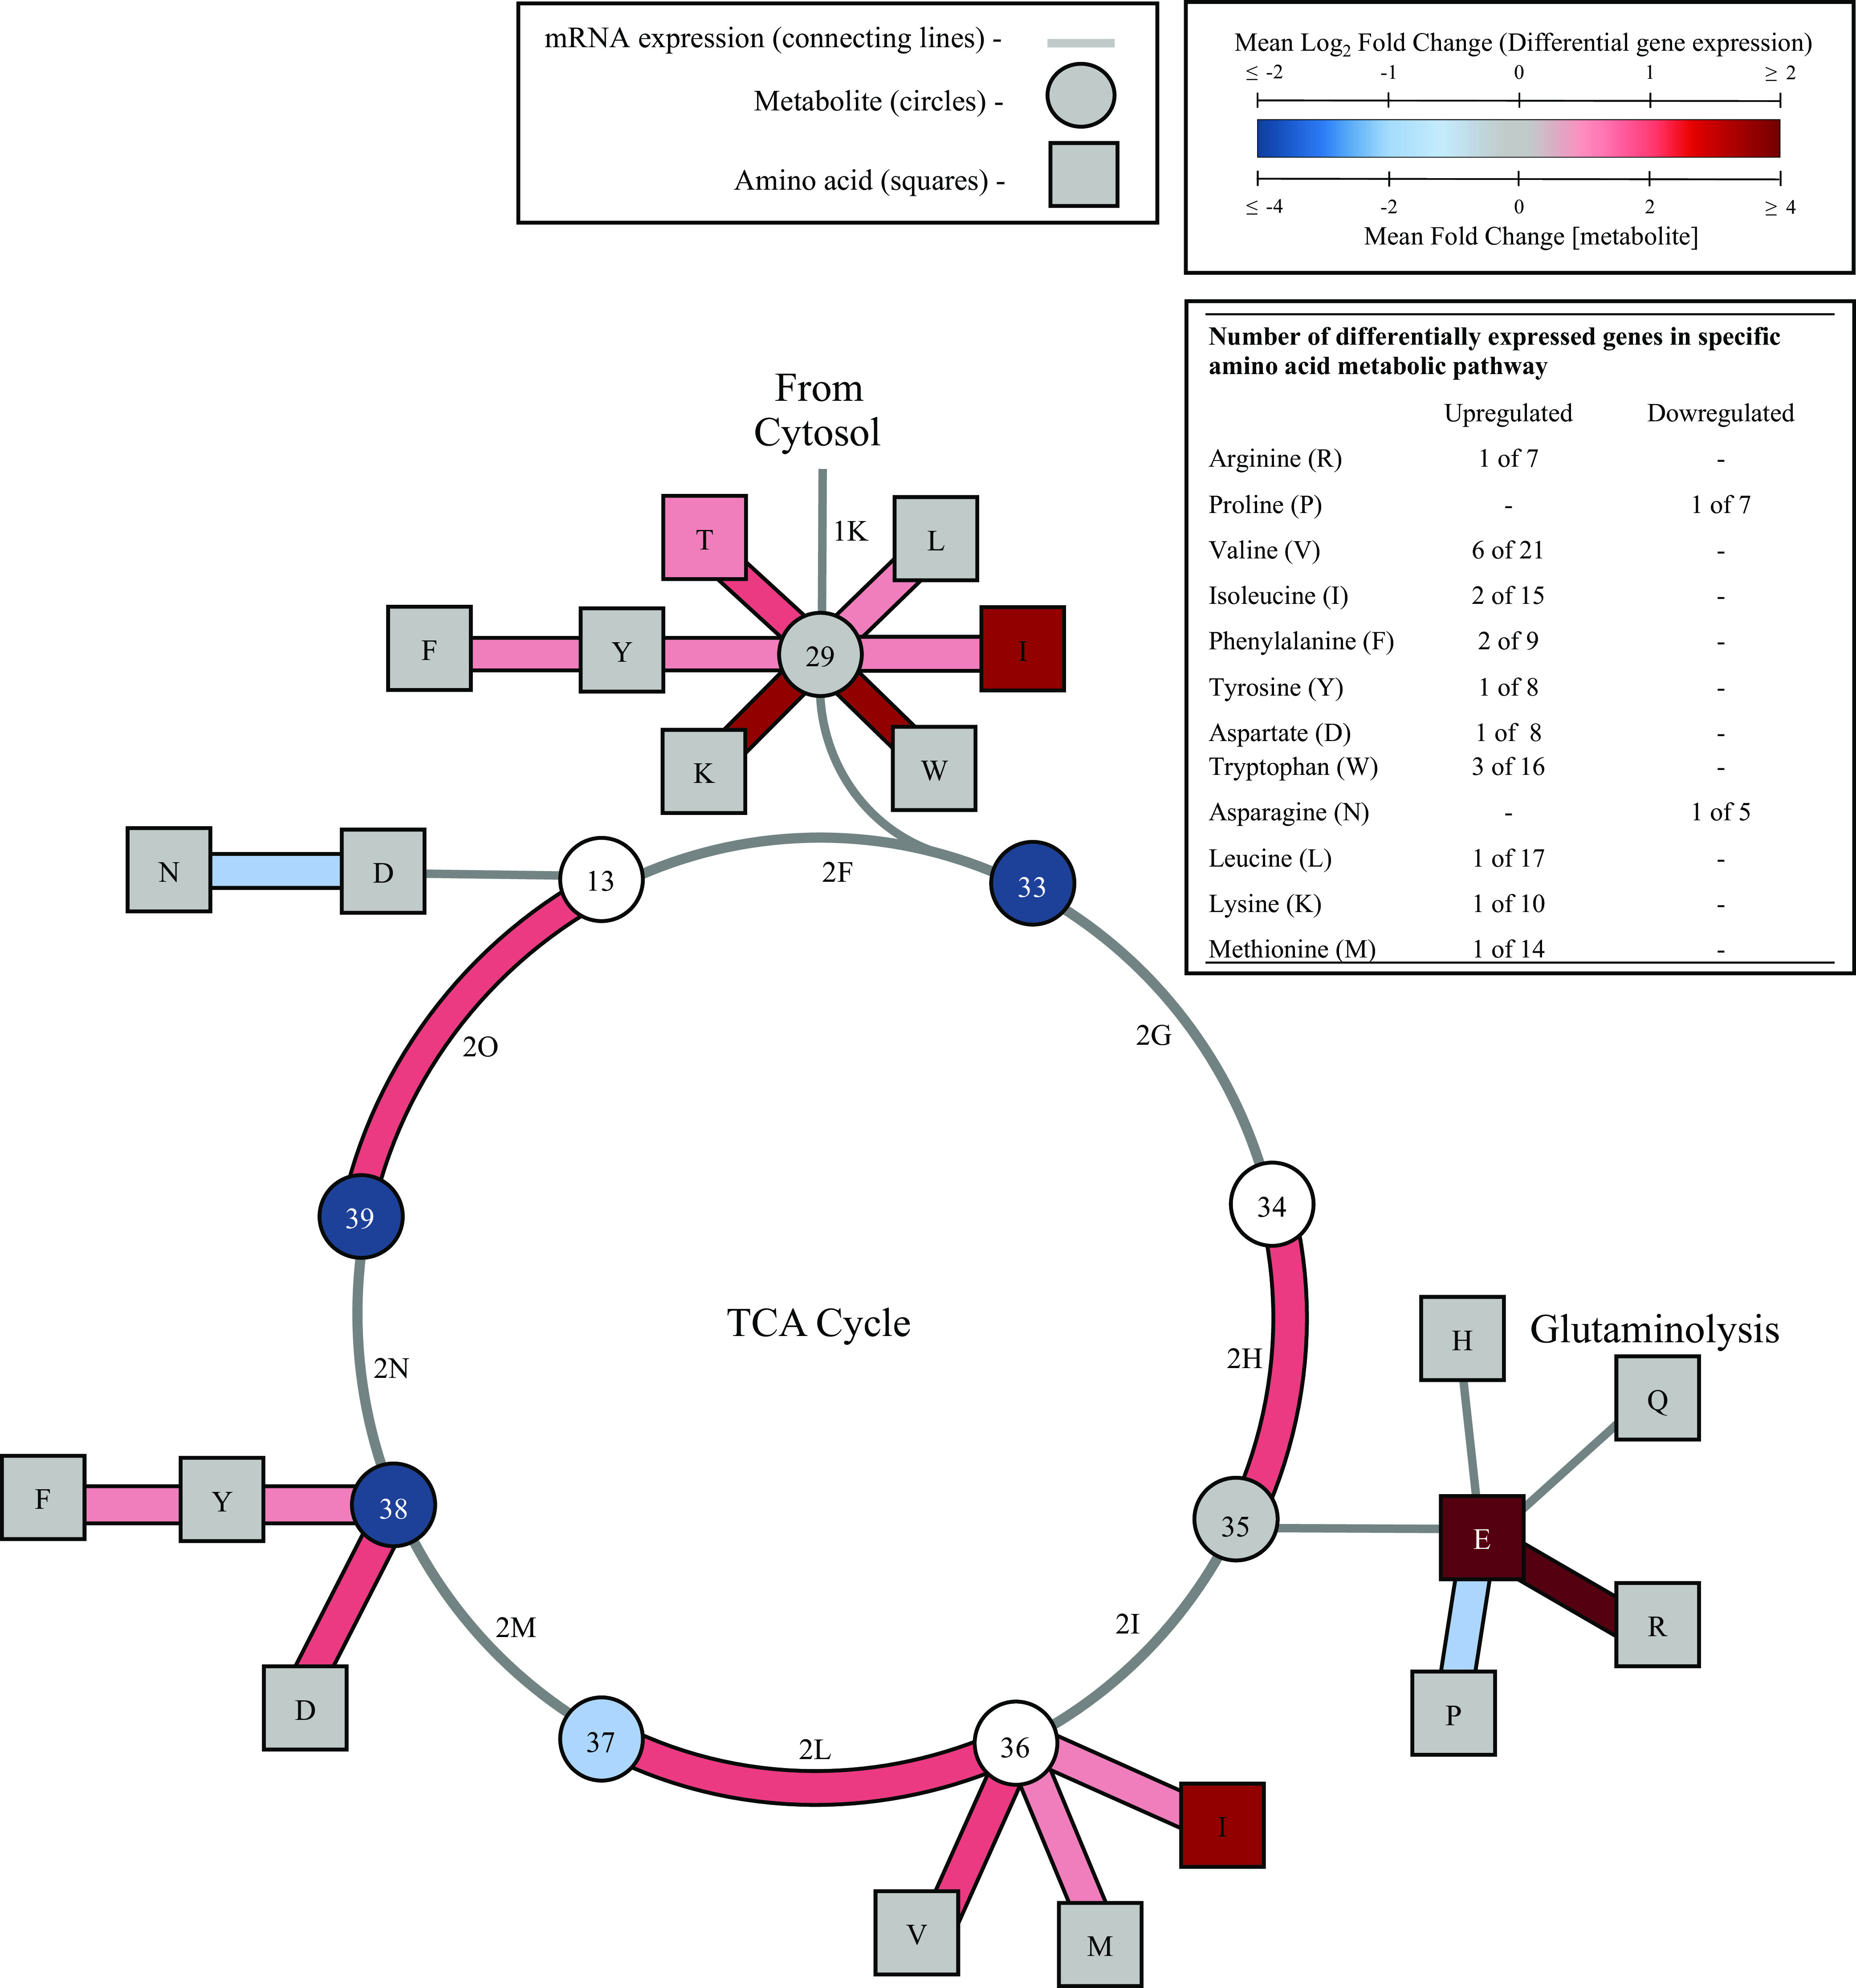
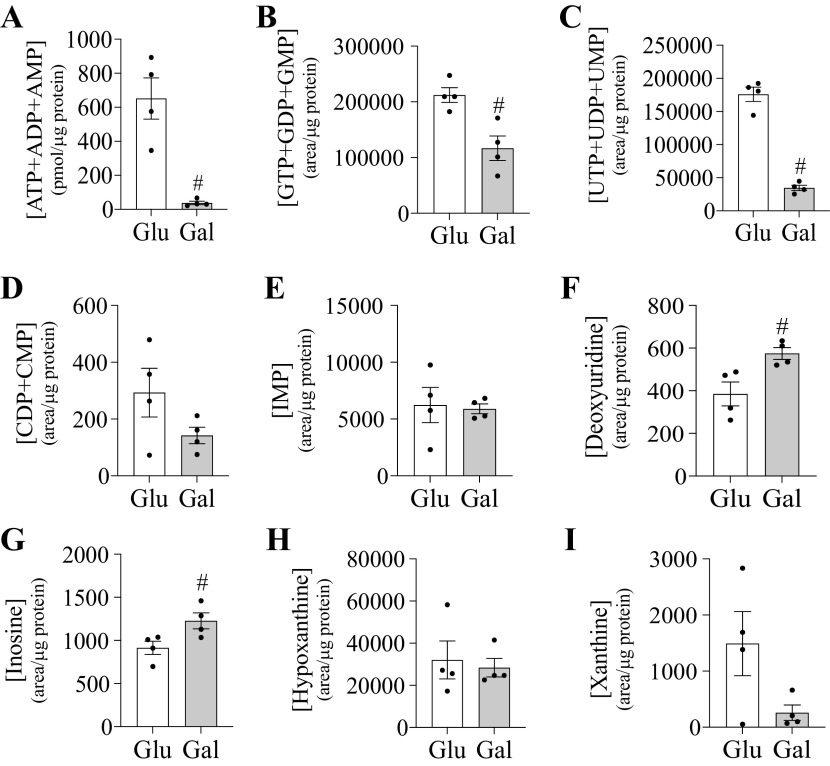
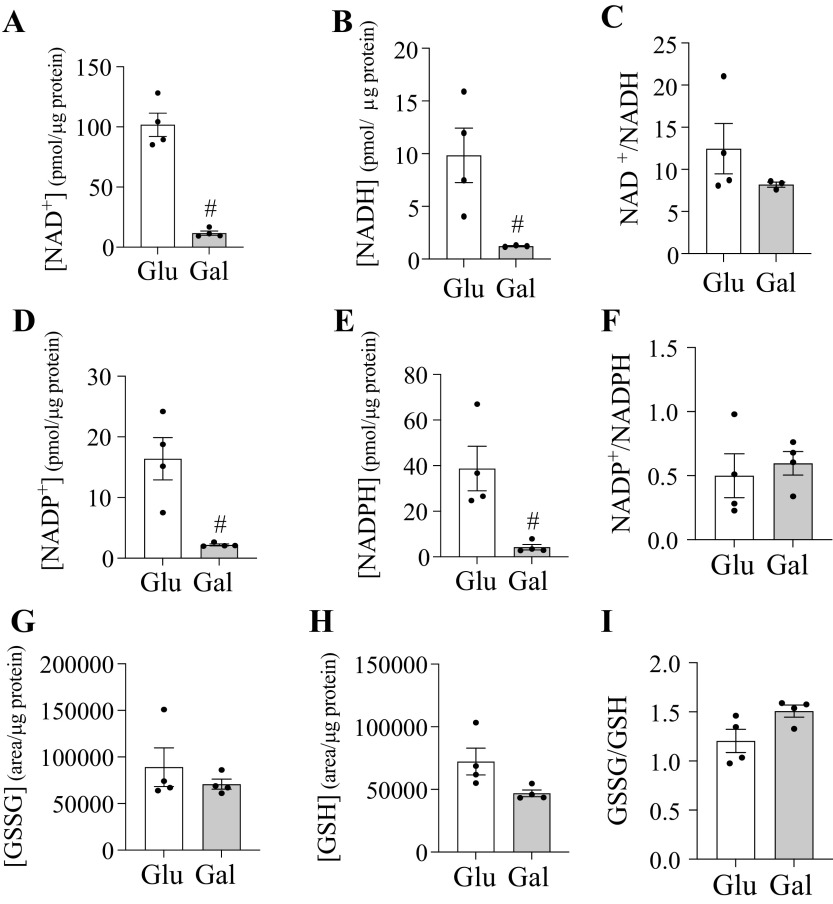
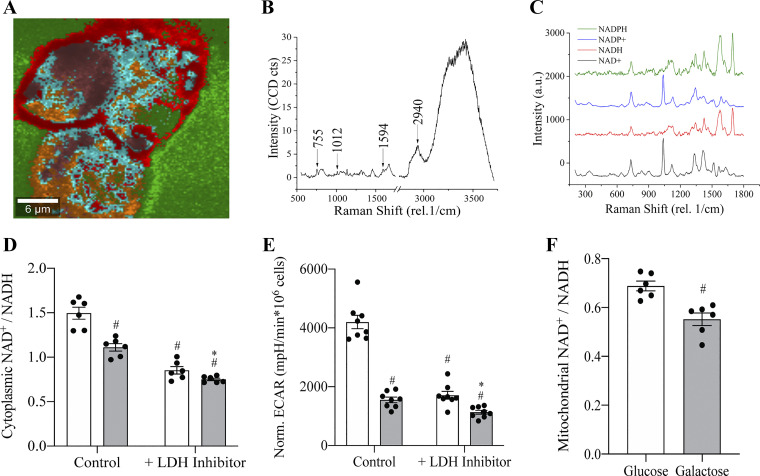
Tumor cell proliferation requires sufficient metabolic flux through the pentose phosphate pathway to meet the demand for biosynthetic precursors and to increase protection against oxidative stress which in turn requires an upregulation of substrate flow through glycolysis. This metabolic poise is often coupled with a shift in ATP production from mitochondrial OXPHOS to substrate-level phosphorylation. Despite major advances that were facilitated by using tumor-derived cell lines in research areas spanning from membrane to cytoskeletal biology, this distorted metabolic profile limits their impact as a model in physiology and toxicology. Substitution of glucose with galactose in the cell culture medium has been demonstrated to shift ATP production from substrate-level phosphorylation to mitochondrial OXPHOS. This increase in oxygen utilization is coupled to a global metabolic reorganization with potential impacts on macromolecule biosynthesis and cellular redox homeostasis, but a comprehensive analysis on the effects of sugar substitution in tumor-derived cells is still missing. To address this gap in knowledge we performed transcriptomic and metabolomic analyses on human hepatocellular carcinoma (HepG2) cells adapted to either glucose or galactose as the aldohexose source. We observed a shift toward oxidative metabolism in all primary metabolic pathways at both transcriptomic and metabolomic levels. We also observed a decrease in nicotinamide dinucleotide (NAD(P)) levels and subcellular NAD+-to-NADH ratios in cells cultured with galactose compared with glucose control cells. Our results suggest that galactose reduces both glycolytic and biosynthetic flux and restores a metabolic poise in HepG2 cells that closely reflects the metabolic state observed in primary hepatocytes.

Keywords: HepG2; NAD; galactose; mitochondria; redox state.


Figures

Figure 1.
Figure 1.
Time-dependent increase in mitochondrial respiration of HepG2 cells cultured with galactose medium. A: alamarBlue reduction by HepG2 cells cultured 24 h with DMEM supplemented with either nondialyzed (white bars) or dialyzed FBS (black bars). Certain media were further supplemented with glucose or galactose. #Indicates statistically significant differences in conditions compared with control (glucose + nondialyzed FBS). (Two-way ANOVA, P < 0.05, n =5, average ± SEM). B: respiration rates of HepG2 cells cultured in glucose medium (white bars) or galactose medium (gray bars) with either 10% nondialyzed FBS (solid) or 10% dialyzed FBS (slanted lines) for 24 h. #Indicates statistically significant differences in conditions compared with control (glucose + nondialyzed FBS). *Indicates statistically significant differences between galactose conditions. (One-way ANOVA, P < 0.05, n =3, average ± SEM). C: heat dissipation of HepG2 cells cultured in glucose medium (white bars) or galactose medium (gray bars) with either 10% nondialyzed FBS (solid) or 10% dialyzed FBS (slanted lines) for 24 h. #Indicates statistically significant differences in conditions compared with control (glucose + nondialyzed FBS) (One-way ANOVA, P < 0.05, n =3–5, average ± SEM). D: respiration rates of HepG2 cells cultured for increasing time in galactose medium with 10% dialyzed FBS. Cells cultured in glucose medium with dialyzed FBS (white bars) served as the control. HepG2 cells were cultured with galactose for 2 h (solid gray bar), 2-6 weeks (horizontal gray bar), or 20-30 weeks (slanted gray bar). #Indicates statistically significant differences in conditions compared with control (glucose + dialyzed FBS). *Indicates statistically significant differences in cells for cultured 20-30 weeks in galactose compared with shorter galactose exposures. (One-way ANOVA, P < 0.05, n =4, average ± SEM). E: oxygen consumption of permeabilized HepG2 cells cultured in glucose or galactose medium (4-5 weeks) (unpaired t-test, P < 0.05, n =4-5, average ± SEM). F: Western blot analysis of GDH-1/2, LDH-A/C, and COX-IV proteins levels in HepG2 cells cultured 4 weeks in galactose medium compared with cells cultured in glucose medium. β−actin served as loading control.
Figure 2.
Figure 2.
Transcriptomic and metabolomic profiling of the glycolytic, gluconeogenic, PPP, hexosamine, and Leloir pathways for HepG2 cells cultured in galactose medium. HepG2 cells were cultured for 4-5 weeks in glucose or galactose medium and glucose conditions were used as the control. Metabolites in glycolytic, gluconeogenic, Leloir, and pentose phosphate pathways are represented with circles and amino acids levels are represented with squares along with a one letter amino acid code. S, succinate; A, alanine; W, tryptophan; G, glycine; T, threonine. Blue symbols represent metabolites with decreased levels, red represents increased levels, gray represents no change, and white indicates the metabolite level was not analyzed (unpaired t-test, P < 0.05, n =4, average ± SEM). Differentially expressed genes were assessed under the same conditions for all enzymes involved in the metabolic diagram. The same color-code used for metabolite concentration is used to represent changes in expression and differentially expressed genes are bolded. The represented catabolic pathways for certain amino acids are simplified to one reaction and do not represent all enzymatic steps and if differential expression was observed for one or more gene in a catabolic pathway, the single step reflected in the figure is bolded and colored to indicate this. A P-value cutoff ≤ 0.05, q-value cutoff ≤ 1 with |FC| ≥ 1 was used to determine differential expression (n =3).
Figure 3.
Figure 3.
Transcriptomic and metabolomic profiling of the TCA cycle and amino acid metabolism for HepG2 cells cultured in galactose medium. HepG2 cells were cultured 4-5 weeks in glucose or galactose medium and glucose conditions were used as the control. Metabolites in the TCA cycle are represented with circles and amino acids levels are represented with squares along with a one letter amino acid code. L, leucine; I, isoleucine; Y, tyrosine; W, tryptophan; N, asparagine; D, aspartate; F, phenylalanine; V, valine; M, methionine; T, threonine; H, histidine; Q, glutamine; R, arginine; P, proline; E, glutamate. Blue symbols represent metabolites with decreased levels, red represents increased levels, gray represents no change, and white indicates the metabolite level was not analyzed (unpaired t-test, P < 0.05, n =4, average ± SEM). Differentially expressed genes were assessed under the same conditions for all enzymes involved in the metabolic diagram according to KEGG pathways. The same color-code used for metabolite concentration is used for gene expression data and differentially expressed genes are bolded. Represented catabolic pathways for certain amino acids are simplified to one reaction and do not represent all enzymatic steps. If differential expression was observed for one or more gene in a catabolic pathway, the single step reflected in the figure is bolded and colored to indicate differential expression. A P-value cutoff ≤ 0.05, q-value cutoff ≤ 1 with |FC| ≥ 1 was used to determine differential expression (n =3).
Figure 4.
Figure 4.
Galactose impacts nucleotide levels in HepG2 cells. Metabolite level of nucleotide phosphates and related metabolites in HepG2 cells cultured in glucose or galactose medium for 4-5 weeks. Represented metabolites include ATP+ADP+AMP (A), GTP+GDP+GMP (B), UTP+UDP+UMP (C), CDP+CMP (D), IMP (E), deoxyuridine (F), inosine (G), hypoxanthine (H), and xanthine (I). #Indicates statistically significant differences between cells cultured with galactose compared with glucose (unpaired t-test, P < 0.05, n =4, average ± SEM).
Figure 5.
Figure 5.
Galactose decreases NAD(P) levels in HepG2 cells. Metabolite level of selected redox couples in HepG2 cells cultured in glucose or galactose medium for 4-5 weeks. Represented metabolites include NAD+ (A), NADH (B), NADP+ (D), NADPH (E), GSSG (G), and GSH (H). The redox ratio (oxidized/reduced) represents the redox poise for each couple NAD+/NADH (C), NADP+/NADPH (F), and GSSG/GSH (I). #Indicates statistically significant differences between cells cultured with galactose compared with glucose (Unpaired t-test, P < 0.05, n =4, average ± SEM).
Figure 6.
Figure 6.
Galactose lowers cytoplasmic and mitochondrial NAD+-to-NADH ratios. Acquisition of Raman spectra of pure NAD+, NADH, NADP+, and NADPH compounds and identification in HepG2 cells. The fingerprint region of each of each of the compounds were used to spatially correlated with the intracellular distribution of the compounds. A: representative Raman spectra of a cluster average. B: intensity of 755 rel. 1/cm peak, representing cytochrome C, increasing as function of cluster degree. C: cascade graph of Raman spectra for four related NAD compounds. D: extracellular acidification of HepG2 cells cultured with glucose or galactose in presence or absence of the LDH inhibitor, GSK 2837808 A (20 µM). #Indicates statistically significant differences compared with glucose control. *Indicates statistically significant between glucose and galactose condition in presence of LDH inhibitor (One-way ANOVA, P < 0.05, n =8, average ± SEM). E: cytoplasmic NAD+/NADH ratio obtained from Raman spectra for HepG2 cells cultured with glucose or galactose in presence or absence of GSK 2837808 A (20 µM). #Indicates statistically significant differences compared with glucose control. *Indicates statistically significant between glucose and galactose condition in presence of LDH inhibitor. (One-way ANOVA, P < 0.05, n =6, average ± SEM). F: mitochondrial NAD+/NADH obtained from Raman spectra for HepG2 cells cultured in glucose or galactose. #Indicates statistically significant differences compared with glucose control. (Unpaired t-test, P < 0.05, n =6, average ± SEM).

Similar articles

Cited by

References

    1. Warburg O. On the origin of cancer cells. Science 123: 309–314, 1956. doi:10.1126/science.123.3191.309. - DOI - PubMed
    1. Moreno-Sanchez R, Rodriguez-Enriquez S, Marin-Hernandez A, Saavedra E. Energy metabolism in tumor cells. FEBS J 274: 1393–1418, 2007. doi:10.1111/j.1742-4658.2007.05686.x. - DOI - PubMed
    1. Warburg O. On respiratory impairment in cancer cells. Science 124: 269–270, 1956. - PubMed
    1. Vander Heiden MG, Cantley LC, Thompson CB. Understanding the Warburg effect: the metabolic requirements of cell proliferation. Science 324: 1029–1033, 2009. doi:10.1126/science.1160809. - DOI - PMC - PubMed
    1. DeBerardinis RJ, Lum JJ, Hatzivassiliou G, Thompson CB. The biology of cancer: metabolic reprogramming fuels cell growth and proliferation. Cell Metab 7: 11–20, 2008. doi:10.1016/j.cmet.2007.10.002. - DOI - PubMed

Publication types

MeSH terms