

Pathophysiological subtypes of Alzheimer's disease based on cerebrospinal fluid proteomics
- PMID: 33439986
- PMCID: PMC7805814
- DOI: 10.1093/brain/awaa325
Pathophysiological subtypes of Alzheimer's disease based on cerebrospinal fluid proteomics
Abstract
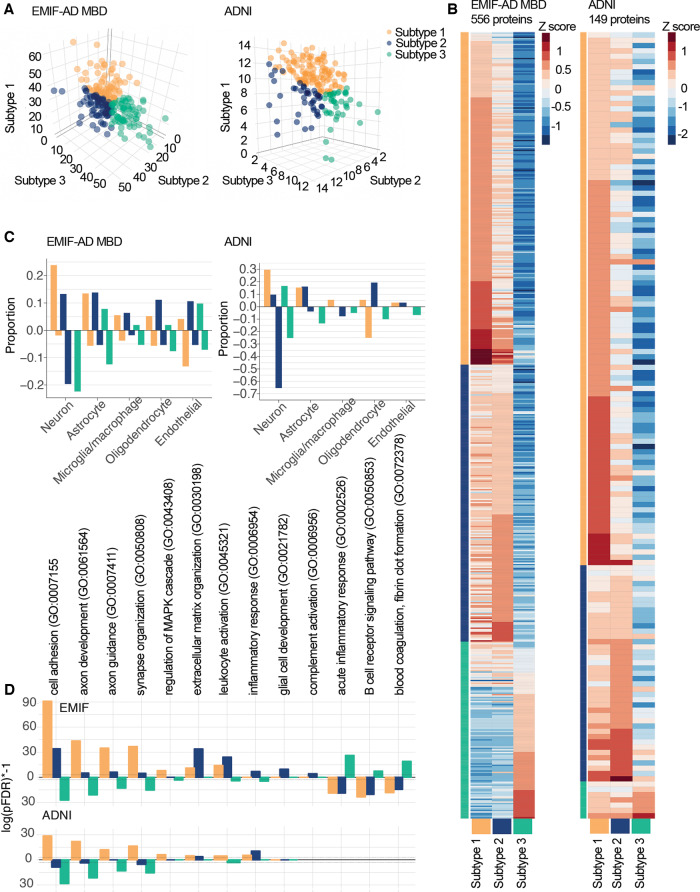
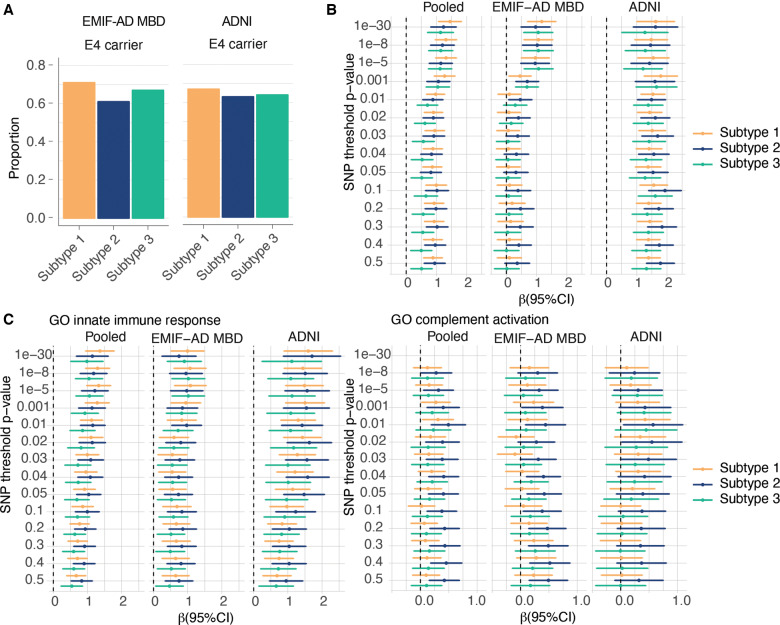
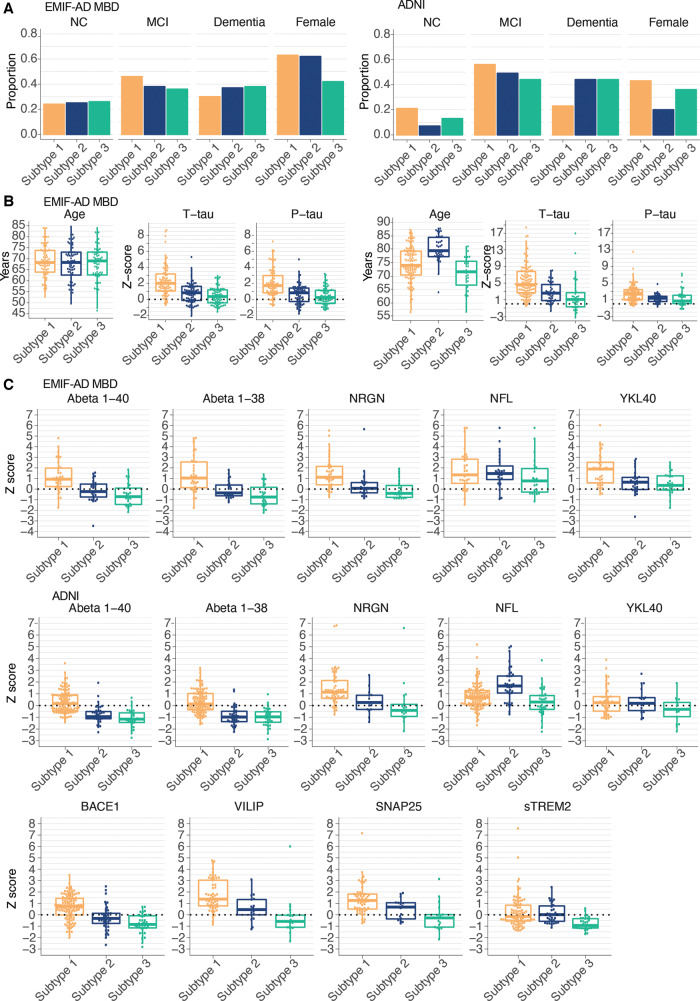
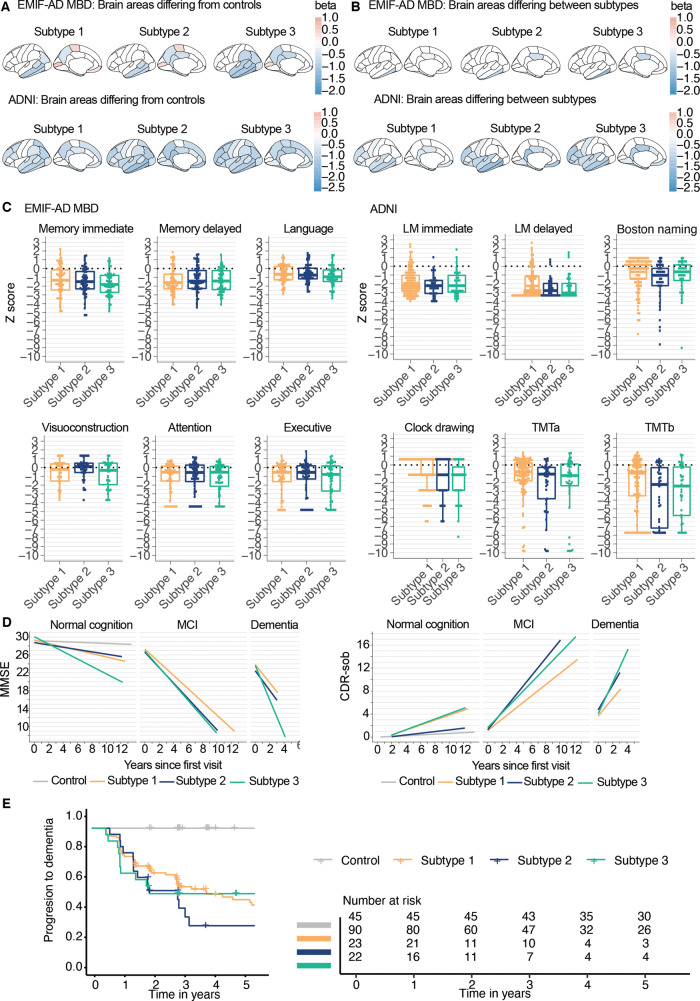
Alzheimer's disease is biologically heterogeneous, and detailed understanding of the processes involved in patients is critical for development of treatments. CSF contains hundreds of proteins, with concentrations reflecting ongoing (patho)physiological processes. This provides the opportunity to study many biological processes at the same time in patients. We studied whether Alzheimer's disease biological subtypes can be detected in CSF proteomics using the dual clustering technique non-negative matrix factorization. In two independent cohorts (EMIF-AD MBD and ADNI) we found that 705 (77% of 911 tested) proteins differed between Alzheimer's disease (defined as having abnormal amyloid, n = 425) and controls (defined as having normal CSF amyloid and tau and normal cognition, n = 127). Using these proteins for data-driven clustering, we identified three robust pathophysiological Alzheimer's disease subtypes within each cohort showing (i) hyperplasticity and increased BACE1 levels; (ii) innate immune activation; and (iii) blood-brain barrier dysfunction with low BACE1 levels. In both cohorts, the majority of individuals were labelled as having subtype 1 (80, 36% in EMIF-AD MBD; 117, 59% in ADNI), 71 (32%) in EMIF-AD MBD and 41 (21%) in ADNI were labelled as subtype 2, and 72 (32%) in EMIF-AD MBD and 39 (20%) individuals in ADNI were labelled as subtype 3. Genetic analyses showed that all subtypes had an excess of genetic risk for Alzheimer's disease (all P > 0.01). Additional pathological comparisons that were available for a subset in ADNI suggested that subtypes showed similar severity of Alzheimer's disease pathology, and did not differ in the frequencies of co-pathologies, providing further support that found subtypes truly reflect Alzheimer's disease heterogeneity. Compared to controls, all non-demented Alzheimer's disease individuals had increased risk of showing clinical progression (all P < 0.01). Compared to subtype 1, subtype 2 showed faster clinical progression after correcting for age, sex, level of education and tau levels (hazard ratio = 2.5; 95% confidence interval = 1.2, 5.1; P = 0.01), and subtype 3 at trend level (hazard ratio = 2.1; 95% confidence interval = 1.0, 4.4; P = 0.06). Together, these results demonstrate the value of CSF proteomics in studying the biological heterogeneity in Alzheimer's disease patients, and suggest that subtypes may require tailored therapy.
Keywords: Alzheimer’s disease; cerebrospinal fluid; proteomics; subtypes.
© The Author(s) (2020). Published by Oxford University Press on behalf of the Guarantors of Brain.
Figures
References
-
- Abildayeva K, Berbée JFP, Blokland A, Jansen PJ, Hoek FJ, Meijer O, et al. Human apolipoprotein C-I expression in mice impairs learning and memory functions. J Lipid Res 2008; 49: 856–69. - PubMed
-
- Albert MS, DeKosky ST, Dickson D, Dubois B, Feldman HH, Fox NC, et al. The diagnosis of mild cognitive impairment due to Alzheimer’s disease: recommendations from the National Institute on Aging-Alzheimer’s Association workgroups on diagnostic guidelines for Alzheimer's disease. Alzheimers Dement 2011; 7: 270–9. - PMC - PubMed
-
- Ballas N, Mandel G.. The many faces of REST oversee epigenetic programming of neuronal genes. Curr Opin Neurobiol 2005; 15: 500–6. - PubMed
-
- Batth TS, Francavilla C, Olsen JV.. Off-line high-pH reversed-phase fractionation for in-depth phosphoproteomics. J Proteome Res 2014; 13: 6176–86. - PubMed
Publication types
MeSH terms
Substances
Grants and funding
LinkOut - more resources
Full Text Sources
Medical
