. 2021 Jul 1;115(7):807-819.
doi: 10.1093/trstmh/traa140.

The benefits and costs of social distancing in high- and low-income countries

Affiliations

The benefits and costs of social distancing in high- and low-income countries

Zachary Barnett-Howell et al. Trans R Soc Trop Med Hyg. .

Abstract

Background: Widespread social distancing and lockdowns of everyday activity have been the primary policy prescription across many countries throughout the coronavirus disease 2019 (COVID-19) pandemic. Despite their uniformity, these measures may be differentially valuable for different countries.

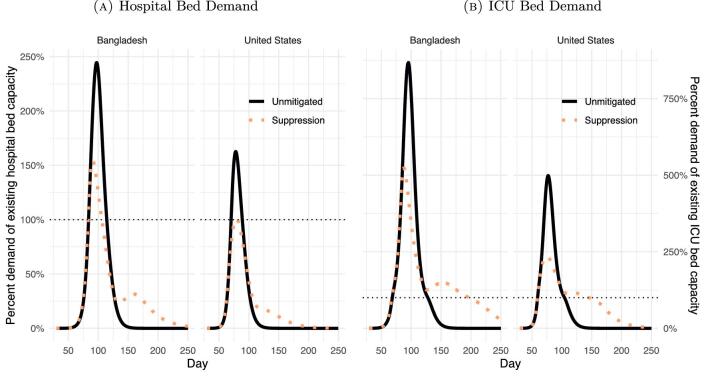
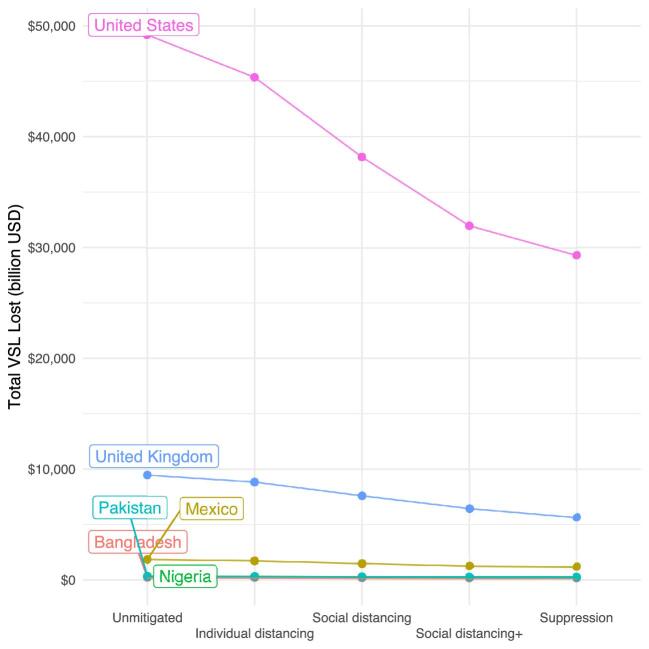
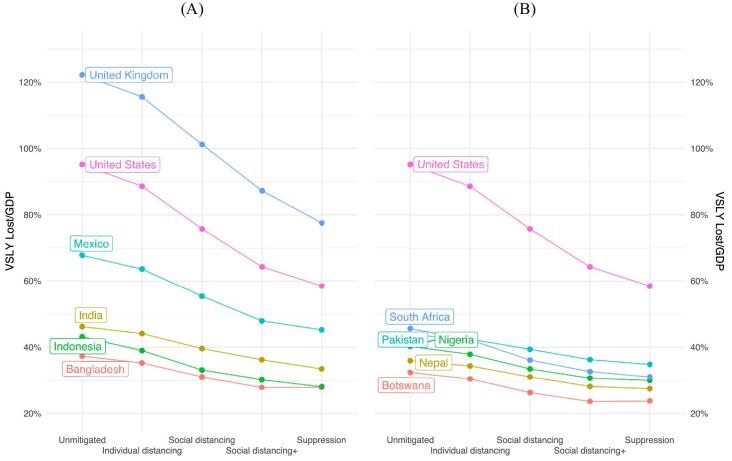
Methods: We use a compartmental epidemiological model to project the spread of COVID-19 across policy scenarios in high- and low-income countries. We embed estimates of the welfare value of disease avoidance into the epidemiological projections to estimate the return to more stringent lockdown policies.

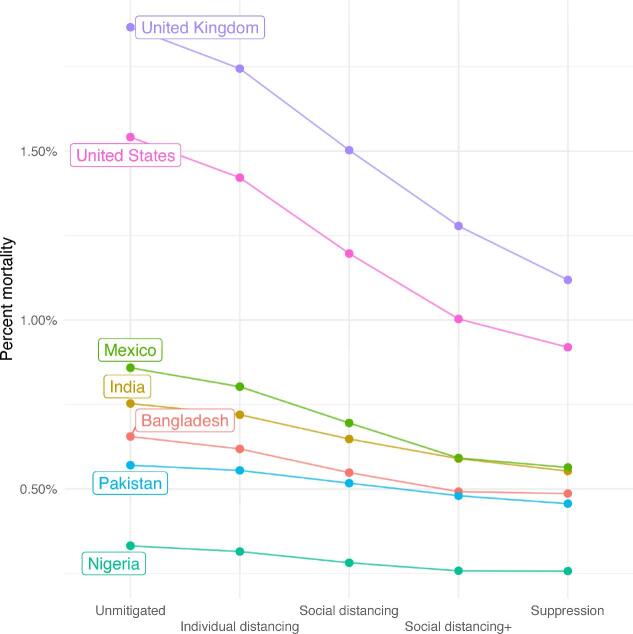
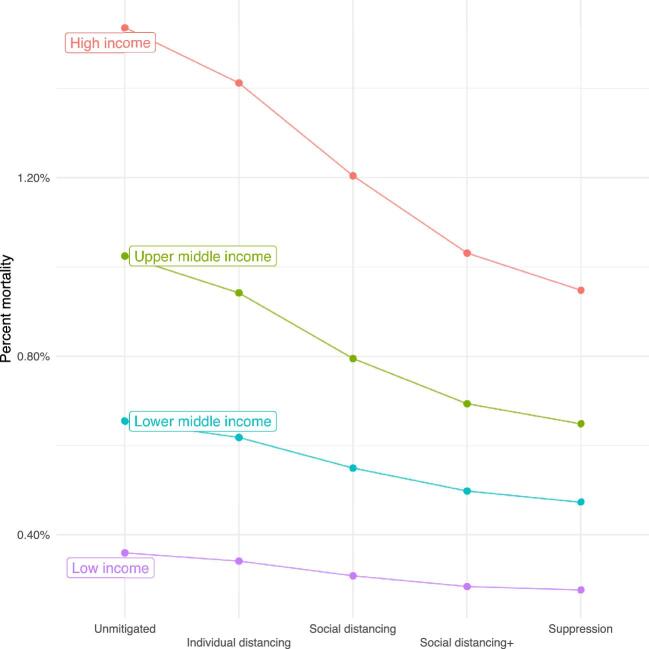
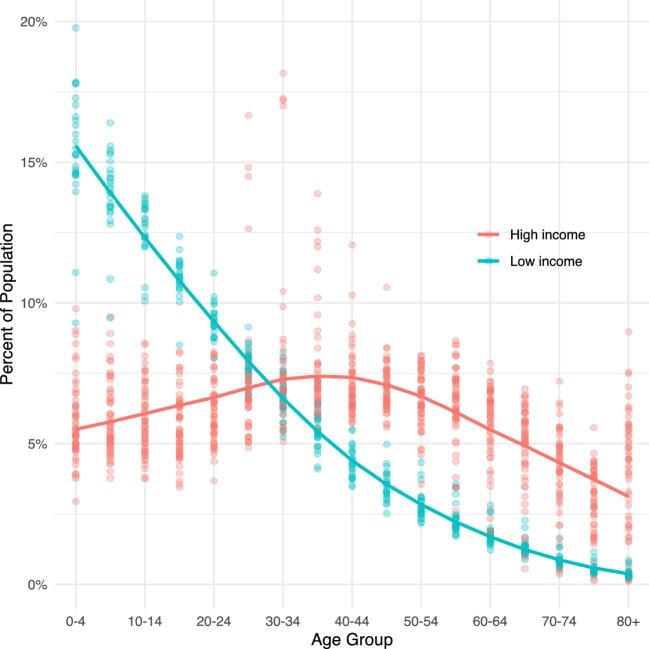
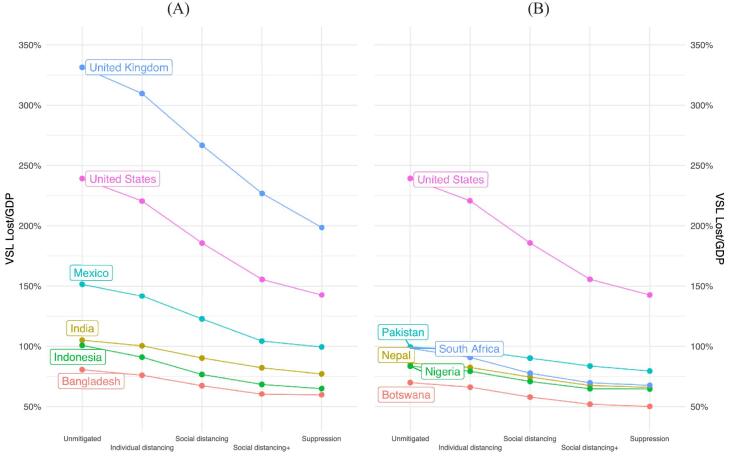
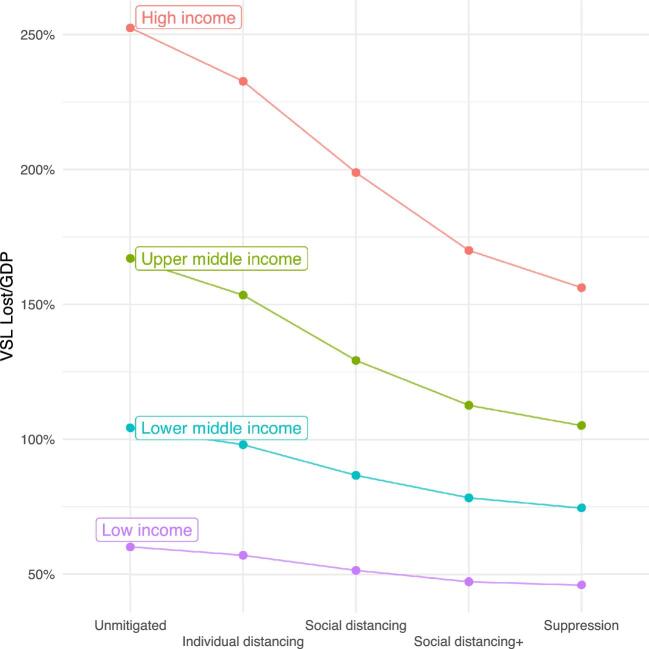
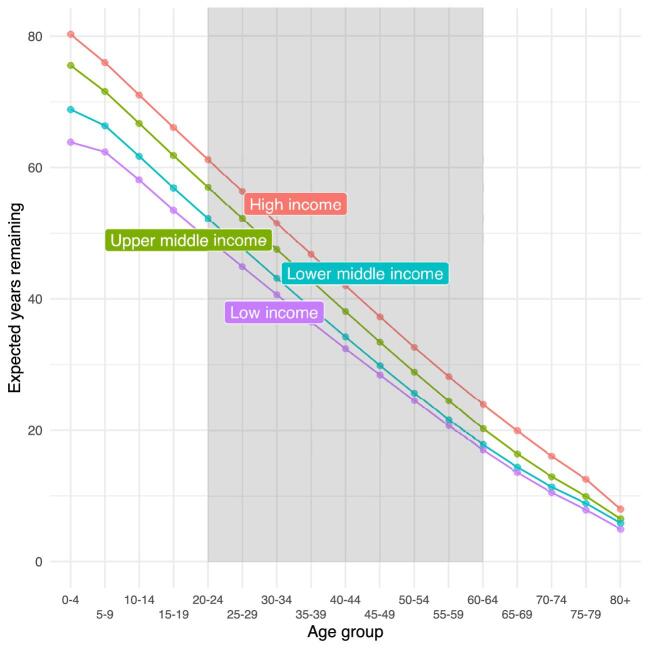
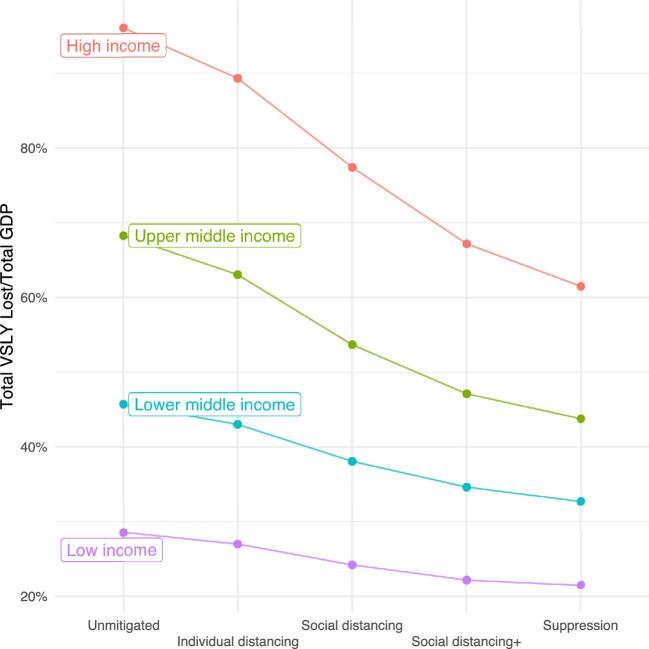
Results: Social distancing measures that 'flatten the curve' of the disease provide immense welfare value in upper-income countries. However, social distancing policies deliver significantly less value in lower-income countries that have younger populations, which are less vulnerable to COVID-19. Equally important, social distancing mandates a trade-off between disease risk and economic activity. Poorer people are less able to make those economic sacrifices.

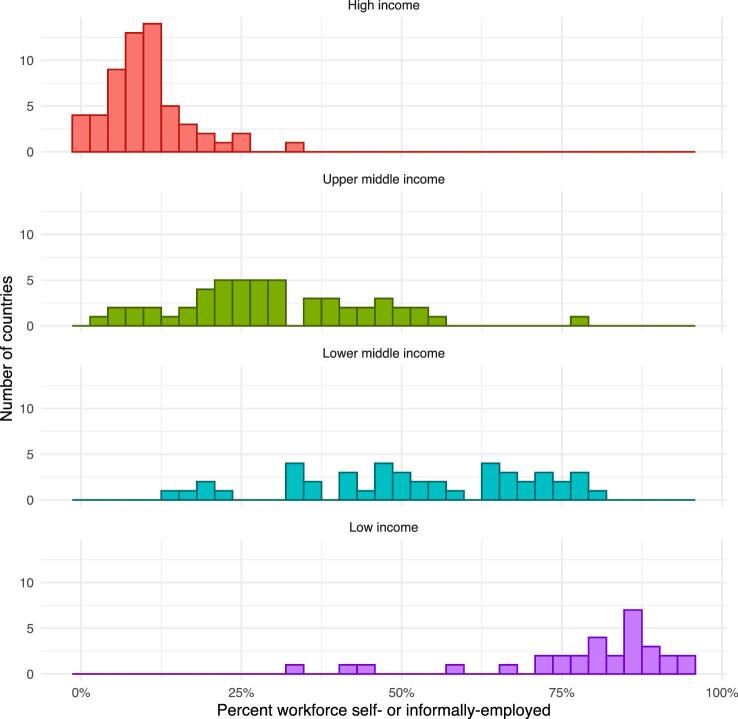
Conclusions: The epidemiological and welfare value of social distancing is smaller in lower-income countries and such policies may exact a heavy toll on the poorest and most vulnerable. Workers in the informal sector often lack the resources and social protections that enable them to isolate themselves until the virus passes. By limiting these households' ability to earn a living, social distancing can lead to an increase in hunger, deprivation, and related mortality and morbidity.

Keywords: COVID-19; VSL; global health; pandemics; social distancing; welfare economics.


Figures

Figure 1.
Figure 1.
The total mortality risk from COVID-19 by country. Note: Point estimates of total COVID-19 population mortality in each country are derived from the squire model under increasing levels of policy intervention.
Figure 2.
Figure 2.
Mortality risk by income group and intervention. Note: Point estimates of total COVID-19 population mortality are derived from the squire model under increasing levels of policy intervention, aggregated by World Bank income classification.
Figure 3.
Figure 3.
Estimated risks of COVID-19 by age group. Note: Estimated risk of COVID-19 hospitalization and conditional mortality as given in Verity et al. The risk of hospitalization climbs dramatically with age and cases requiring hospitalization are assigned a separate mortality likelihood based on whether they require critical care.
Figure 4.
Figure 4.
Population distribution of high- and low-income countries. Note: Each point represents the fraction of the population in that age range for one country, with a smoothed line showing averages for countries that are classified as high or low income.
Figure 5.
Figure 5.
Healthcare demand in Bangladesh and the USA. Note: Hospital and ICU bed demand and capacity estimated using the squire model. The plots compare demand for healthcare resources in a scenario where there are no policy interventions and a scenario in which lockdown and suppression measures are enacted for a 40-d period.
Figure 6.
Figure 6.
Value of the total statistical life (VSL) lost for each country. Note: Point estimates of total VSL lost for each country are derived by embedding the VSL from Viscusi and Masterman into the mortality predictions of the squire model under increasing levels of policy intervention. Data on GDP is given by the World Bank. The magnitude of the loss in the US reflects the high level of mortality as well as the high VSL.
Figure 7.
Figure 7.
Relative value of statistical life (VSL) lost for each country. Note: Point estimates of relative VSL lost for each country are derived by embedding the VSL from Viscusi and Masterman into the mortality predictions of the squire model under increasing levels of policy intervention. Data on GDP is given by the World Bank. The USA is used as a benchmark for relative losses.
Figure 8.
Figure 8.
Estimated value of COVID-19 intervention by income group. Note: Point estimates of the relative VSL lost for each country are derived by embedding the VSL from Viscusi and Masterman into the mortality predictions of the squire model under increasing levels of policy intervention. Data on GDP is given by the World Bank. These are totalled by World Bank income group designation over the combined World Bank estimate for that income group's total GDP.
Figure 9.
Figure 9.
Population averaged life expectancy by income group classification. Note: Population-weighted average life expectancy at each age by World Bank income classification. Data on life expectancy for each age group are provided by the World Health Organization Global Health Observatory. Working ages for VSLY are 20–60 y (shaded in grey). Expected years remaining is higher in higher-income countries at all ages, although the difference narrows for the elderly.
Figure 10.
Figure 10.
Relative value of statistical life years (VSLY) lost for each country. Note: Point estimates of the relative VSLY lost for each country are derived by embedding the VSL from Viscusi and Masterman and estimates of life expectancy from the World Health Organization into the mortality predictions of the squire model under increasing levels of policy intervention. Data on GDP is given by the World Bank. The USA is used as a benchmark for relative losses.
Figure 11.
Figure 11.
Relative value of statistical life years (VSLY) lost by income group. Note: Point estimates of the relative VSLY lost for each country are derived by embedding the VSL from Viscusi and Masterman and estimates of life expectancy from the World Health Organization into the mortality predictions of the squire model under increasing levels of policy intervention. Data on GDP is given by the World Bank. These are totalled by the World Bank income group designation over the combined World Bank estimate for that income group's total GDP.
Figure 12.
Figure 12.
Distribution of self- or informally employed workforce by income group. Note: Estimated fraction of workforce in each country that is either self-employed or employed in the informal sector. The fraction of the workforce in the formal sector increases with income level. Data are given by the World Bank indicator SL.EMP.VULN.ZS.

Similar articles

Cited by

References

    1. Ferguson NM, Laydon D, Nedjati-Gilani G et al. Impact of non-pharmaceutical interventions (NPIs) to reduce COVID-19 mortality and healthcare demand. London: Imperial College London, 2020. Available from 10.25561/77482 (accessed 17 December 2020). - DOI - PMC - PubMed
    1. Verity R, Okell LC, Dorigatti I et al. Estimates of the severity of coronavirus disease 2019: a model-based analysis. Lancet Infect Dis. 2020;20(6):669–77. - PMC - PubMed
    1. Watson OJ, Walker P, Whittaker C et al. squire version 0.4.34. Available from: https://mrc-ide.github.io/squire/index.html (accessed 17 December 2020).
    1. Tan-Torres Edejer T, Hanssen O, Mirelman A et al. Projected health-care resource needs for an effective response to COVID-19 in 73 low-income and middle-income countries: a modelling study. Lancet Global Health. 2020;8(11):E1372–9. - PMC - PubMed
    1. COVID-19 community mobility reports. Available from: https://www.google.com/covid19/mobility/ (accessed 17 December 2020).

Publication types