. 2021 Jan 12;34(2):108615.
doi: 10.1016/j.celrep.2020.108615.

Familial Alzheimer's Disease Mutations in PSEN1 Lead to Premature Human Stem Cell Neurogenesis

Affiliations

Familial Alzheimer's Disease Mutations in PSEN1 Lead to Premature Human Stem Cell Neurogenesis

Charles Arber et al. Cell Rep. .

Abstract

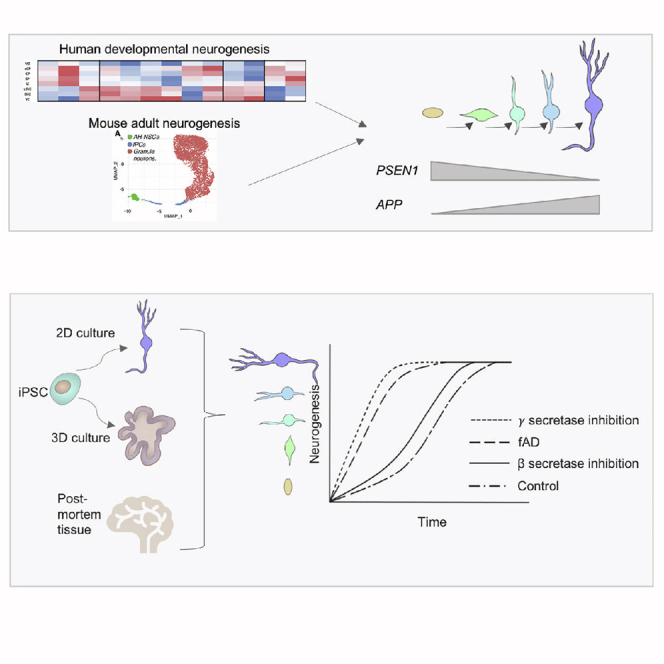
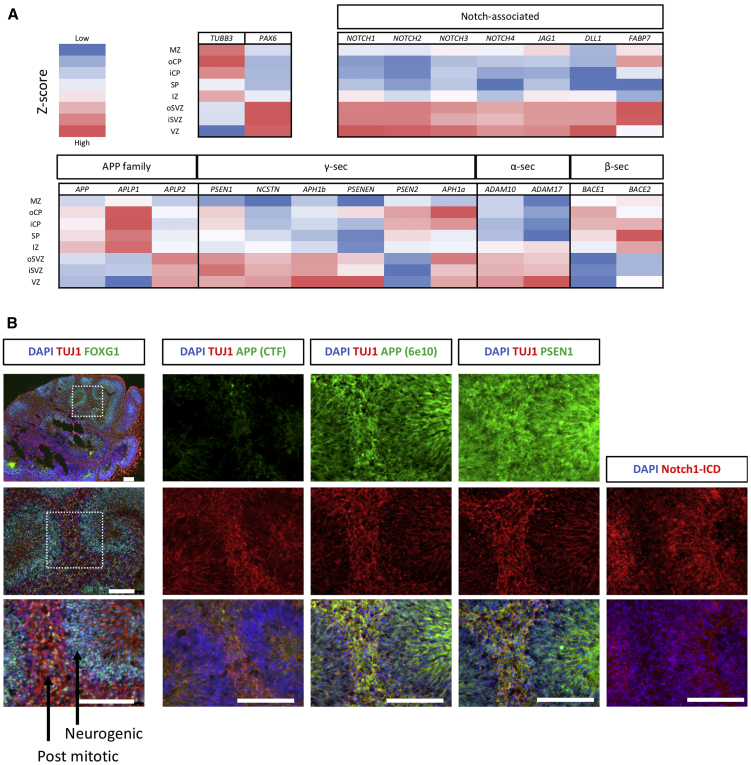
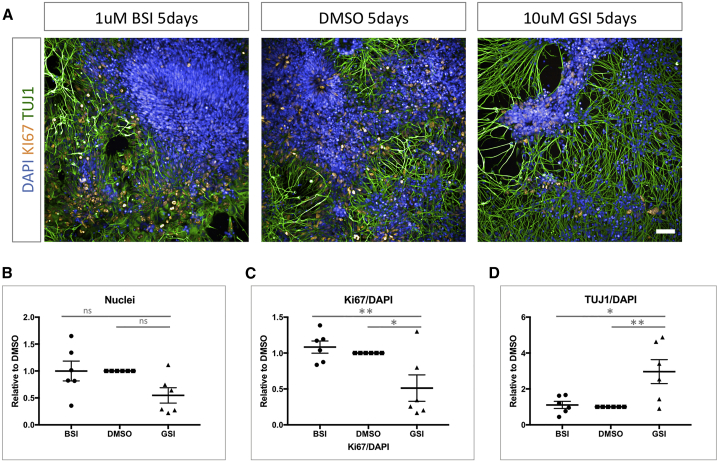
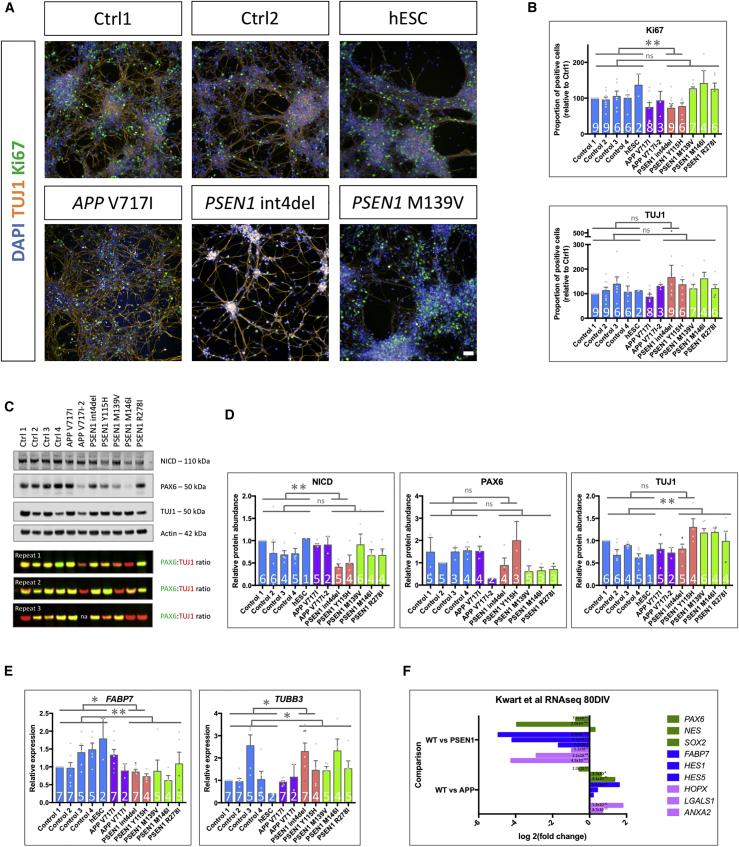
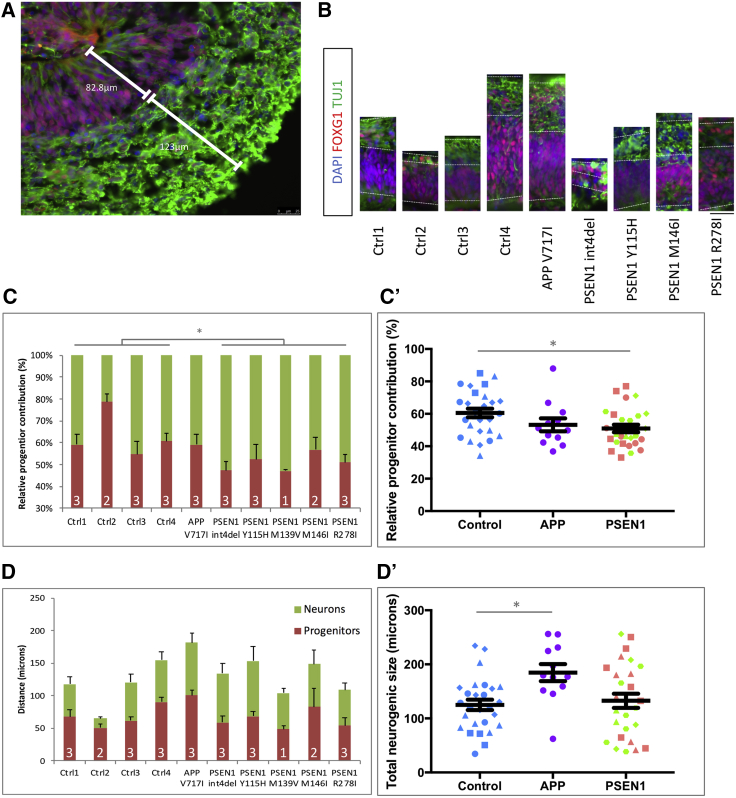
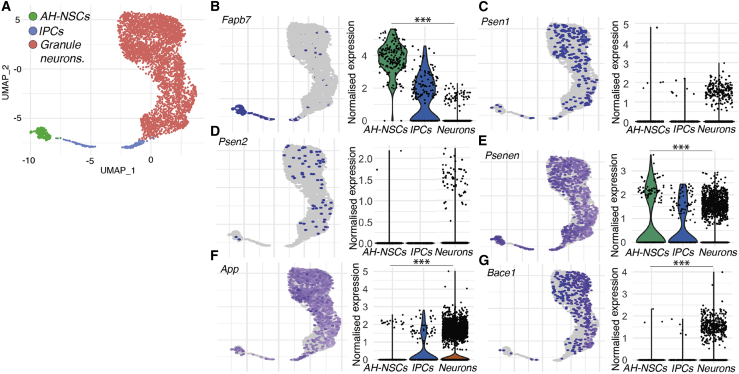
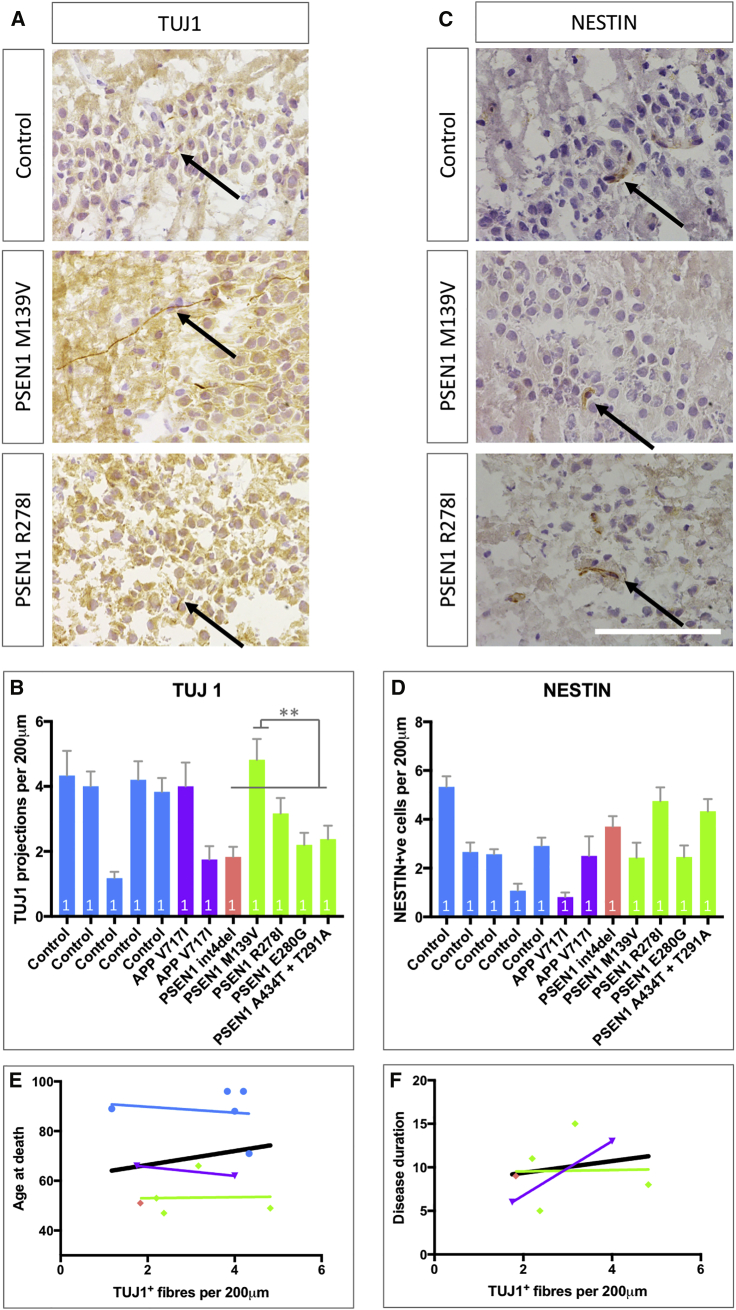
Mutations in presenilin 1 (PSEN1) or presenilin 2 (PSEN2), the catalytic subunit of γ-secretase, cause familial Alzheimer's disease (fAD). We hypothesized that mutations in PSEN1 reduce Notch signaling and alter neurogenesis. Expression data from developmental and adult neurogenesis show relative enrichment of Notch and γ-secretase expression in stem cells, whereas expression of APP and β-secretase is enriched in neurons. We observe premature neurogenesis in fAD iPSCs harboring PSEN1 mutations using two orthogonal systems: cortical differentiation in 2D and cerebral organoid generation in 3D. This is partly driven by reduced Notch signaling. We extend these studies to adult hippocampal neurogenesis in mutation-confirmed postmortem tissue. fAD cases show mutation-specific effects and a trend toward reduced abundance of newborn neurons, supporting a premature aging phenotype. Altogether, these results support altered neurogenesis as a result of fAD mutations and suggest that neural stem cell biology is affected in aging and disease.

Keywords: Alzheimer’s disease; NOTCH; PSEN1; hippocampus; iPSC; neurogenesis; organoid; γ-secretase.


Conflict of interest statement

Declaration of Interests H.Z. has served at scientific advisory boards for Denali, Roche Diagnostics, Wave, Samumed, Siemens Healthineers, Pinteon Therapeutics, and CogRx; has given lectures in symposia sponsored by Fujirebio, Alzecure, and Biogen; and is a co-founder of Brain Biomarker Solutions in Gothenburg AB (BBS), which is a part of the GU Ventures Incubator Program. The other authors have no conflicts of interest to declare.

Figures

None
Graphical abstract
Figure 1
Figure 1
Notch, APP, and Their Cleavage Enzymes Are Spatiotemporally Restricted in Human Neurogenesis (A) Expression pattern across the cortical layers of human tissue between 15 and 21 weeks after conception using data from BrainSpan (Miller et al., 2014). TUBB3 and PAX6 are controls for neurons and precursors, respectively. Notch receptors (NOTCH1NOTCH4), ligands (JAG1 and DLL1), and the Notch readout gene FABP7 (alias BLBP) are enriched in the progenitor layers. α-secretase displays enrichment in the progenitor layers, as does γ-secretase, which shows subunit-specific expression patterns. APP and β-secretase enzymes are enriched in neuronal layers. (B) Serial sections and immunocytochemical staining from a representative iPSC-derived cerebral organoid at 45 days post induction. FOXG1 staining confirms forebrain identity. APP is enriched in neuronal regions (marked by TUJ1) and cleaved; active Notch is found in proliferative regions. PSEN1 is more evenly distributed. Scale bar represents 100 μm. γ-, β-, and α-sec, γ-, β-, and α-secretase, respectively; MZ, marginal zone; oCP and iCP, outer and inner cortical plate, respectively; SP, subplate; IZ, intermediate zone; iSVZ and oSVZ, inner and outer subventricular zone respectively; VZ, ventricular zone.
Figure 2
Figure 2
β-Secretase and γ-Secretase Inhibition Differentially Affect Neurogenesis (A) Representative images of day 27 iPSC-derived neural precursors treated with β-secretase inhibitor (BSI; LY2886721, 1 μM), vehicle (DMSO), and γ-secretase inhibitor (GSI; DAPT, 10 μM). Ki67 marks dividing cells, and TUJ1 depicts terminally differentiated neurons. (B–D) Quantification of 6 independent inductions and the effect of β- and γ-secretase inhibition on total cell number, dividing cells (Ki67), and TUJ1 postmitotic neurons via high-content imaging. p < 0.05, ∗∗p < 0.01 via ANOVA with post hoc Tukey’s analysis, as indicated in Table S1. Scale bar represents 50 μm. Error bars represent standard error of the mean.
Figure 3
Figure 3
Mutations in PSEN1 Reduce Notch Signaling and Lead to Premature Terminal Differentiation (A) Representative images of day 27 iPSC-derived neural progenitors labeled for dividing cells (Ki67) and postmitotic neurons (TUJ1). (B) High-content analysis and quantification of the relative proportion of proliferative (Ki67 positive) and neuronal (TUJ1 positive) cells. (C and D) Representative western blot and quantification for the cleaved, active Notch intracellular domain (NICD), PAX6 neural progenitor marker, and TUJ1 neuronal marker. Note, due to variability in Ctrl1, PAX6 data were normalized to Ctrl2. Due to similar molecular weights, the ratio of PAX6 to TUJ1 intensity represents a measure of terminal differentiation. na, not available. (E) qPCR analysis of the expression of the Notch readout gene FABP7 (alias BLBP) and TUBB3 (neuronal tubulin). (F) RNA sequencing (RNA-seq) expression data from Kwart et al. (2019), demonstrating expression of neural stem cell (NSC) markers (PAX6, NES, and SOX2), Notch signaling readout genes (FABP7, HES1, and HES5), and adult NSC markers (HOPX, LGALS1, and ANXA2) (Berg et al., 2019; Edri et al., 2015) in 80 days in vitro (DIV) iPSC-derived neurons from wild type (WT) compared with isogenic PSEN1 or APP mutant lines. Adjusted p values are represented within the histogram. Blue, control; purple, APP mutant cells; pink, mutations in the PSEN1 extracellular loop; green, mutations in PSEN1 transmembrane and intracellular domains. The number of independent neural inductions is shown within the histograms. Data from different iPSC clones are depicted by gray data points (APP V717I, PSEN1 int4del, and PSEN1 R278I). p < 0.05, ∗∗p < 0.01, ∗∗∗p < 0.001 via ANOVA with post hoc Tukey’s analysis (normal distribution tested via the Shapiro-Wilk test), as indicated in Table S1. Scale bar represents 50 μm. Error bars represent standard error of the mean.
Figure 4
Figure 4
iPSC-Derived Cerebral Organoids Exhibit Premature Neurogenesis in PSEN1 Mutant Lines (A and B) Depictions of the relative contribution of proliferative progenitors (FOXG1+/TUJ1−) and committed neurons (TUJ1+) within the neurogenic niches of iPSC-derived cerebral organoids. Quantifications were made from the basement membrane to the neural boundary (in micrometers) in at least two neurogenic regions per organoid. (B) is to scale, and the scale bar represents 25 μm. (C) Quantification of the relative contribution of the neural progenitors and neurons for individual control, APP, and PSEN1 mutation lines. (C′) shows the same data grouped by genotype. (D) Quantification of the overall size of the neurogenic regions for each line (progenitor contribution plus neural contribution). (D′) shows the same data grouped by genotype. The number of independent organoid batches is shown within the histograms. p < 0.05, ∗∗p < 0.01, ∗∗∗p < 0.001 via ANOVA with post hoc Tukey’s analysis, as indicated in Table S1. Ctrl1, blue circles; Ctrl2, blue squares; Ctrl3, blue triangles; Ctrl4, blue diamonds; APP V717I, purple circles; PSEN1 int4del, pink circles; PSEN1 Y115H, pink squares; PSEN1 M139V, green triangles; PSEN1 M146I, green diamonds; PSEN1 R278I, green hexagons. Error bars represent standard error of the mean.
Figure 5
Figure 5
Expression of Notch Signaling Components and AD-Related Genes in the Mouse Adult Hippocampal Neurogenic Lineage (A) Low-dimensional representation of transcriptional space (UMAP plot), showing single-cell transcriptomes of adult hippocampal neural stem cells (AH-NSCs, green), intermediate neuronal progenitor cells (IPCs, blue), and granule neurons (red) derived from the hippocampus of postnatal mice from a publicly available dataset (Hochgerner et al., 2018). (B) Expression of the Notch signaling target gene Fabp7 is higher in NSCs than in neurons. (C–E) γ-secretase genes Psen1 and Psen2 are expressed in all cell types but below the threshold for differential gene expression analyses. The Psenen subunit of γ-secretase is significantly higher in NSCs than in neurons. (F) Expression of App is enriched in neurons compared with NSCs. (G) Expression of the β-secretase gene Bace1 is enriched in neurons. Wilcoxon rank-sum test, with the genome-wide false discovery rate (FDR)-corrected p value in (B)–(G). ∗∗∗p < 0.001, n.s., p > 0.05.
Figure 6
Figure 6
Analysis of Neurogenesis in Mutation-Confirmed fAD Postmortem Hippocampal Tissue (A) TUJ1-positive projections (black arrows) crossing the granule layer of the dentate gyrus in the hippocampus, employed as a marker for newly generated neurons. (B) Quantification of newborn neurons in the hippocampi per 200 μm. (C) NESTIN was used as a marker for NSCs. (D) Quantification of the number of NESTIN-positive cells in contact with the granule layer of the dentate gyrus per 200 μm. (E) Correlation of TUJ1 fibers (newborn neurons) with age at death per case. The black line is the regression line for all data. (F) Correlation of TUJ1 fibers (newborn neurons) with disease duration. The black line is the regression line for all data. Scale bar represents 100 μm. ∗∗p < 0.01 via ANOVA with post hoc Tukey’s analysis, as indicated in Table S1. R-squared values are shown in Table S1. Comparisons represent multiple fields of view for each brain (n = 1). Blue, control; purple, APP V717I; pink, mutations in the PSEN1 extracellular loop; green, mutations in PSEN1 transmembrane and intracellular domains. Error bars represent standard error of the mean.

References

    1. Adeosun S.O., Hou X., Zheng B., Stockmeier C., Ou X., Paul I., Mosley T., Weisgraber K., Wang J.M. Cognitive deficits and disruption of neurogenesis in a mouse model of apolipoprotein E4 domain interaction. J. Biol. Chem. 2014;289:2946–2959. - PMC - PubMed
    1. Altman J., Das G.D. Autoradiographic and histological evidence of postnatal hippocampal neurogenesis in rats. J. Comp. Neurol. 1965;124:319–335. - PubMed
    1. Anthony T.E., Mason H.A., Gridley T., Fishell G., Heintz N. Brain lipid-binding protein is a direct target of Notch signaling in radial glial cells. Genes Dev. 2005;19:1028–1033. - PMC - PubMed
    1. Arber C., Toombs J., Lovejoy C., Ryan N.S., Paterson R.W., Willumsen N., Gkanatsiou E., Portelius E., Blennow K., Heslegrave A. Familial Alzheimer’s disease patient-derived neurons reveal distinct mutation-specific effects on amyloid beta. Mol. Psychiatry. 2020;25:2919–2931. - PMC - PubMed
    1. Arber C., Villegas-Llerena C., Toombs J., Pocock J.M., Ryan N.S., Fox N.C., Zetterberg H., Hardy J., Wray S. Amyloid precursor protein processing in human neurons with an allelic series of the PSEN1 intron 4 deletion mutation and total presenilin-1 knockout. Brain Commun. 2019;1:fcz024. - PMC - PubMed

Publication types

MeSH terms