. 2021 Jan 12;34(2):108628.
doi: 10.1016/j.celrep.2020.108628.

MDA5 Governs the Innate Immune Response to SARS-CoV-2 in Lung Epithelial Cells

Affiliations

MDA5 Governs the Innate Immune Response to SARS-CoV-2 in Lung Epithelial Cells

Xin Yin et al. Cell Rep. .

Abstract

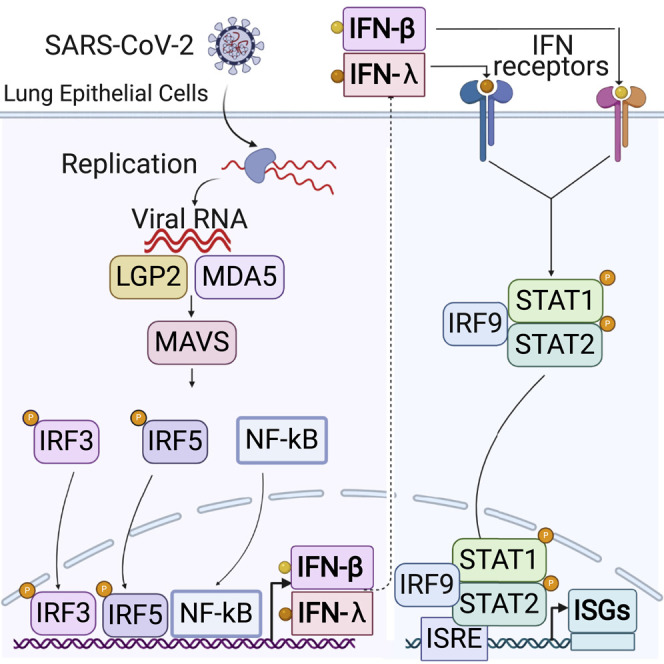
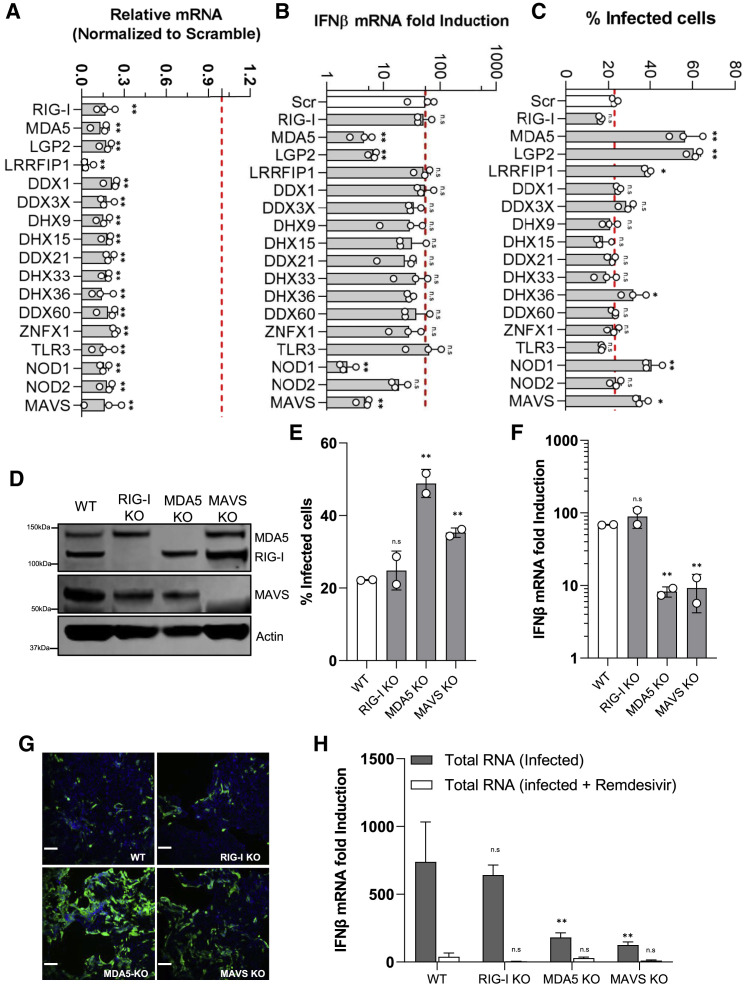
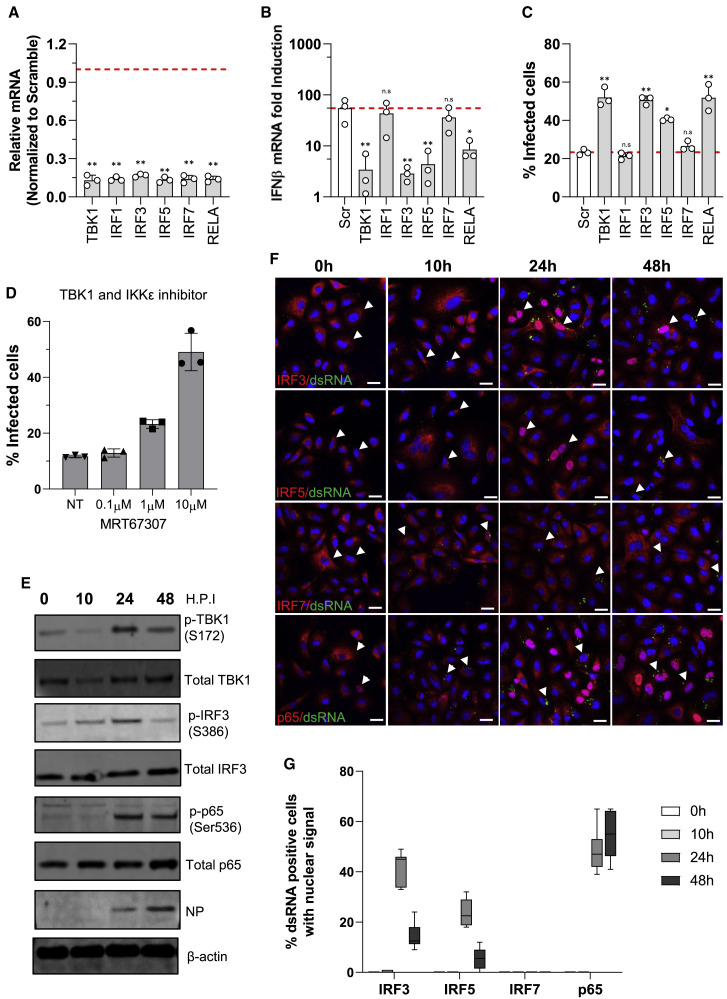
Recent studies have profiled the innate immune signatures in patients infected with severe acute respiratory syndrome coronavirus 2 (SARS-CoV-2) and suggest that cellular responses to viral challenge may affect disease severity. Yet the molecular events that underlie cellular recognition and response to SARS-CoV-2 infection remain to be elucidated. Here, we find that SARS-CoV-2 replication induces a delayed interferon (IFN) response in lung epithelial cells. By screening 16 putative sensors involved in sensing of RNA virus infection, we found that MDA5 and LGP2 primarily regulate IFN induction in response to SARS-CoV-2 infection. Further analyses revealed that viral intermediates specifically activate the IFN response through MDA5-mediated sensing. Additionally, we find that IRF3, IRF5, and NF-κB/p65 are the key transcription factors regulating the IFN response during SARS-CoV-2 infection. In summary, these findings provide critical insights into the molecular basis of the innate immune recognition and signaling response to SARS-CoV-2.

Keywords: IRF3; IRF5; MDA5; NF-κB/p65; SARS-CoV-2; interferon; lung epithelial cells.


Conflict of interest statement

Declaration of Interests The García-Sastre laboratory has received research support from Pfizer, Senhwa Biosciences, 7Hills Pharma, Pharmamar, Blade Therapeutics, Avimex, Dynavax, Kenall Manufacturing, and ImmunityBio. A.G.-S. has consulting agreements with the following companies involving cash and/or stock: Vivaldi Biosciences, Contrafect, 7Hills Pharma, Avimex, Pagoda, Vaxalto, Accurius, and Esperovax. Y.Y. and S.G. are founders, shareholders, and board members of HiLung Inc. Y.Y. and S.G. have patents (PCT/JP2016/059786) related to this work.

Figures

None
Graphical abstract
Figure 1
Figure 1
SARS-CoV-2 Infection Triggers the Innate Immune Response in Calu-3 Cells (A) Calu-3 cells (1 × 105) were infected with SARS-CoV-2 with MOI = 0.125. At the indicated time points post-infection, cells were fixed, immunostained with rabbit-anti-SARS-CoV-2 NP antibody (green) and DAPI (blue), and imaged using an IC200 high-content imager. Representative immunofluorescence images are shown. Scale bar, 100 μm. (B) The percentage of infection was calculated as the ratio between the number of infected cells stained for SARS-CoV-2 NP and the total amount of cells stained with DAPI. Data are from four independent experiments with three technical replicates and show mean ± SEM. The red line represents the relative cell numbers over time. (C) Intracellular viral RNA was measured using qRT-PCR using primers targeting the N2 regions used by the Centers for Disease Control and Prevention (CDC) assay. The results show the mean ± SEM of four independent experiments. (D) The kinetics of SARS-CoV-2 infection-induced expression of mRNAs encoding different IFNs in Calu-3 cells is displayed. Data are expressed as fold change relative to mock-infected cells and show the mean ± SD of four independent experiments. (E) Immunoblots of ISG56, SARS-CoV-2 spike protein, and β-actin in Calu-3 cells infected with SARS-CoV-2 are shown. Calu-3 cells (1 × 106) were infected with SARS-CoV-2 with MOI = 1. At the indicated time points post-infection, cells were collected for western blot analysis with indicated antibodies. (F) Calu-3 cells (1 × 105) were infected with SARS-CoV-2 at the indicated MOI in the presence of remdesivir for 48 h. Intracellular viral RNA was measured in infected Calu-3 cells with or without remdesivir treatment using qRT-PCR using primers targeting the N2 regions. (G) IFN induction in SARS-CoV-2-infected Calu-3 cells was quantified using qRT-PCR. Data are expressed as fold change relative to mock-infected cells.
Figure 2
Figure 2
SARS-CoV-2 Infection Induces IFN Signaling in iPSC-Derived Airway Epithelium (A) iPSC-derived airway epithelium was infected with SARS-CoV-2 at the indicated MOI for 48 h before fixation. The cells were immunostained with rabbit-anti-SARS-CoV-2 NP antibody and imaged using an IC200 high-content imager. Representative immunofluorescence images are shown. Scale bar, 100 μm. (B and C) Intracellular and extracellular viral RNA was measured using qRT-PCR using primers targeting the N2 regions used by the CDC assay. Data are from three technical replicates. (D) IFN mRNA levels in SARS-CoV-2-infected epithelial cells were quantified using qRT-PCR. Data are expressed as fold change relative to mock-infected cells. (E) The kinetics of intracellular viral mRNA in the infected cells. The results show the mean ± SD of two independent experiments. (F) The kinetics of IFN mRNAs in the cells upon SARS-CoV-2 infection. Data are expressed as fold change relative to mock-infected cells. (G) Kinetics of IFN secretion responses in infected cells. Concentrations of IFN-β and IFN-λ in the culture supernatants were measured using specific ELISA, respectively. The results show the mean ± SEM of the average of the duplicates in each of two independent experiments.
Figure 3
Figure 3
IFN Production Inhibits SARS-CoV-2 Replication (A) Immunoblots of IFNAR1, IL10RB, STAT1, STAT2, IRF9, and actin in Calu-3 cells transfected with indicated pooled siRNA for 48 h are shown. (B) Calu-3 cells were transfected with siRNAs. Forty-eight hours post-transfection, the cells were treated with IFN-β (1,000 U/mL) or IFN-λ (1,700 U/mL) for 8 h prior to RNA extraction. IFIT1 mRNA was quantified using qRT-PCR. Data are expressed as fold change relative to non-treated cells. (C) Calu-3 cells were transfected with siRNAs. At 48 h post-transfection, the cells were infected with SARS-CoV-2 at MOI = 0.125 for a further 48 h. IFIT1 mRNA was quantified using qRT-PCR. Data are expressed as fold change relative to non-treated cells. (D) Viral titer in the collected supernatants were determined by plaque assay in Vero E6 cells. Data show mean ± SD from one representative experiment in triplicate (n = 3) of two independent experiments. (E) The siRNA-transfected Calu-3 cells were infected with SARS-CoV-2 with MOI = 0.125. At 48 h post-infection, cells were fixed, immunostained with rabbit-anti-SARS-CoV-2 NP antibody (green) and DAPI (blue), and imaged using an IC200 high-content imager. Representative immunofluorescence images are shown. Scale bar, 100 μm. (F) The percentage of infection was calculated as the ratio between the number of infected cells stained for SARS-CoV-2 NP and the total amount of cells stained with DAPI. Data are from three independent experiments with three technical replicates.
Figure 4
Figure 4
MDA5/LGP2 Are the Dominant RNA Sensors Responsible for Innate Immune Induction in Calu-3 Cells Infected with SARS-CoV-2 (A) siRNA-mediated knockdown efficiency in Calu-3 cells was evaluated using qRT-PCR with specific primers. (B) The siRNA-transfected Calu-3 cells were infected with SARS-CoV-2 with MOI = 0.125. At 48 h post-infection, the total RNA was extracted using the NucleoSpin 96 RNA extraction kit. The IFN-β mRNA was quantified by quantitative RT-PCR. Data are expressed as fold change relative to non-treated cells. (C) The percentage of infection was calculated as the ratio between the number of infected cells stained for SARS-CoV-2 NP and the total amount of cells stained with DAPI. Data are from three independent experiments with three technical replicates. (D) Immunoblots of parental, MDA5, RIG-I, MAVS, and β-actin in the CRISPR-knockout (KO) Calu-3 cells. (E) The CRISPR-knockout cells were infected with SARS-CoV-2 with MOI = 0.125. At 48 h post-infection, cells were fixed, immunostained with rabbit-anti-SARS-CoV-2 NP antibody, and imaged using Celigo. The percentage of infection was calculated as the ratio between the number of infected cells stained for SARS-CoV-2 NP and the total amount of cells stained with DAPI. Data are from two independent experiments with three technical replicates. (F) IFN-β mRNA induction in the CIRPSR-KO cells infected with SARS-CoV-2. (G) Representative immunofluorescence images are shown. (H) The CRISPR-KO cells were transfected with either PolyI:C (5 μg/mL) or total RNA extracted from infected cells (10 μg/mL). 8 h post-transfection, the cells were lysed to measure IFN-β mRNA production using qRT-PCR.
Figure 5
Figure 5
IRF3, IRF5, and p65 Are Required for IFN Signaling Transduction in Response to SARS-CoV-2 Infection (A) siRNA-mediated knockdown efficiency in Calu-3 cells was evaluated using qRT-PCR with specific primers. (B) The IFN-β mRNA in the infected cells transfected with indicated siRNA was quantified using qRT-PCR. Data are expressed as fold change relative to non-treated cells. (C) The percentage of infection was calculated as the ratio between the number of infected cells stained for SARS-CoV-2 NP and the total amount of cells stained with DAPI. Data are from three independent experiments with three technical replicates. (D) The infection of SARS-CoV-2 in Calu-3 cells treated with MRT67307 at different concentrations. Calu-3 cells were infected with SARS-CoV-2 with MOI = 0.125 in the presence of MRT67307. At 48 h post-infection, cells were fixed, immunostained with rabbit-anti-SARS-CoV-2 NP antibody, and imaged using Celigo. Data are from two independent experiments with three technical replicates. (E) Calu-3 cells infected with SARS-CoV-2 at an MOI of 1.0 were collected at indicated time points for detection of protein expression with specific antibodies. (F) The confocal images showing nuclear translocation of IRF3, IRF5, IRF7, and RELA in the cells infected with SARS-CoV-2 at an MOI of 1.0. Cells were stained with NF-κB p65 (Cell Signaling, 8242), IRF3, or IRF7 along with anti-dsRNA [rJ2] antibody, and DAPI was used to stain the nuclei. Scale bar, 20 μm. (G) Quantification of nuclear translocation of IRF3, IRF5, IRF7, or p65 from six fields of view collected from two independent experiments conducted as in (F).

References

    1. Ancar R., Li Y., Kindler E., Cooper D.A., Ransom M., Thiel V., Weiss S.R., Hesselberth J.R., Barton D.J. Physiologic RNA targets and refined sequence specificity of coronavirus EndoU. RNA. 2020;26:1976–1999. - PMC - PubMed
    1. Aschenbrenner D.S. Remdesivir Receives emergency use authorization for severely ill patients with COVID-19. Am. J. Nurs. 2020;120:26. - PubMed
    1. Banerjee A., Budylowski P., Richard D., Maan H., Aguiar J.A., El-Sayes N., D’Agostino M.R., Tremblay B.J.-M., Afkhami S., Karimzadeh M., et al. Early temporal dynamics of cellular responses to SARS-CoV-2. bioRxiv. 2020 doi: 10.1101/2020.06.18.158154. - DOI
    1. Bastard P., Rosen L.B., Zhang Q., Michailidis E., Hoffmann H.-H., Zhang Y., Dorgham K., Philippot Q., Rosain J., Béziat V., et al. HGID Lab. NIAID-USUHS Immune Response to COVID Group. COVID Clinicians. COVID-STORM Clinicians. Imagine COVID Group. French COVID Cohort Study Group. Milieu Intérieur Consortium. CoV-Contact Cohort. Amsterdam UMC Covid-19 Biobank. COVID Human Genetic Effort Autoantibodies against type I IFNs in patients with life-threatening COVID-19. Science. 2020;370:eabd4585. - PMC - PubMed
    1. Birra D., Benucci M., Landolfi L., Merchionda A., Loi G., Amato P., Licata G., Quartuccio L., Triggiani M., Moscato P. COVID 19: a clue from innate immunity. Immunol. Res. 2020;68:161–168. - PMC - PubMed

Publication types

MeSH terms