. 2021 Jan 12;34(2):108604.
doi: 10.1016/j.celrep.2020.108604.

Chemosensory Neurons Modulate the Response to Oomycete Recognition in Caenorhabditis elegans

Affiliations

Chemosensory Neurons Modulate the Response to Oomycete Recognition in Caenorhabditis elegans

Michael K Fasseas et al. Cell Rep. .

Abstract

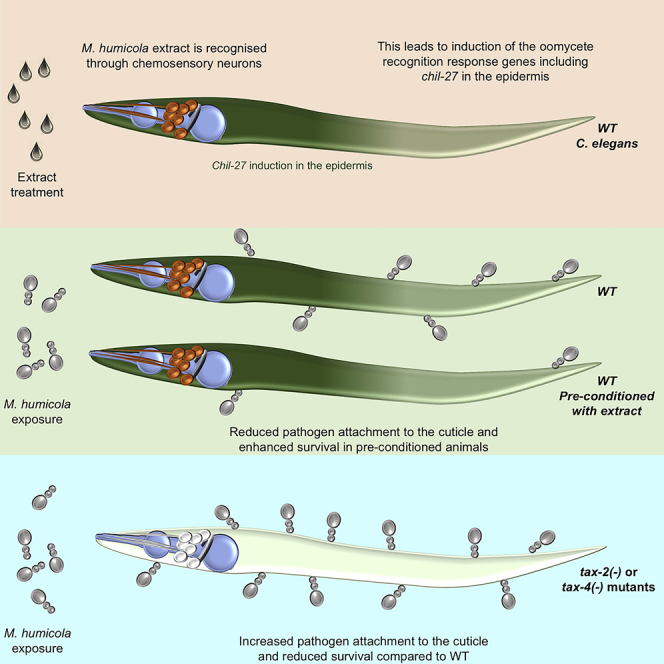
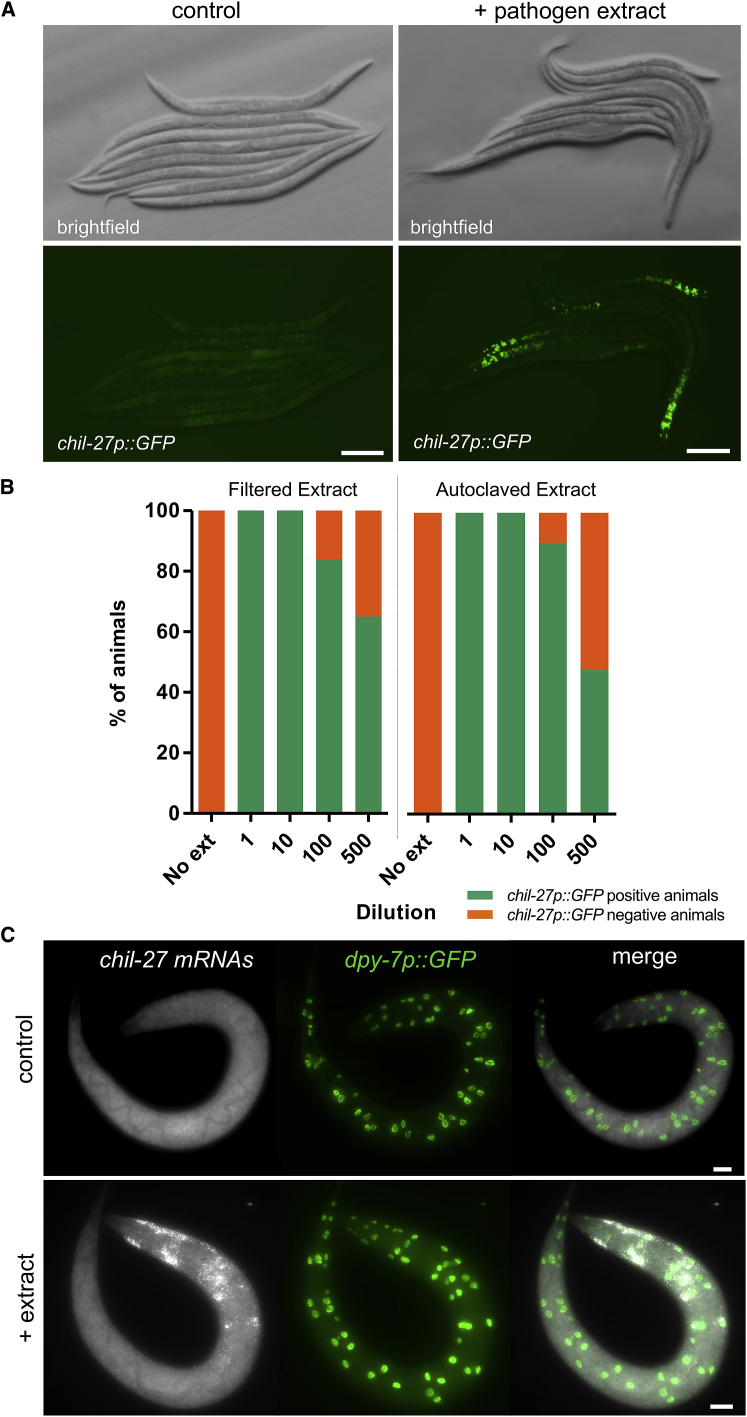
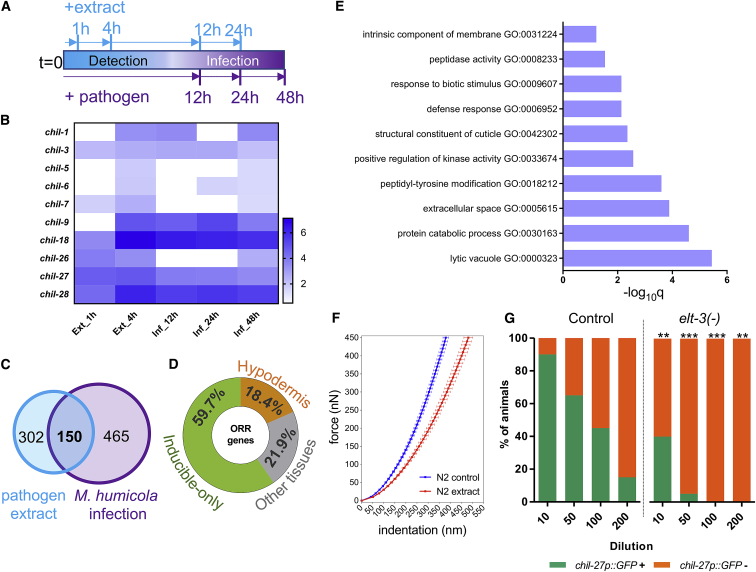
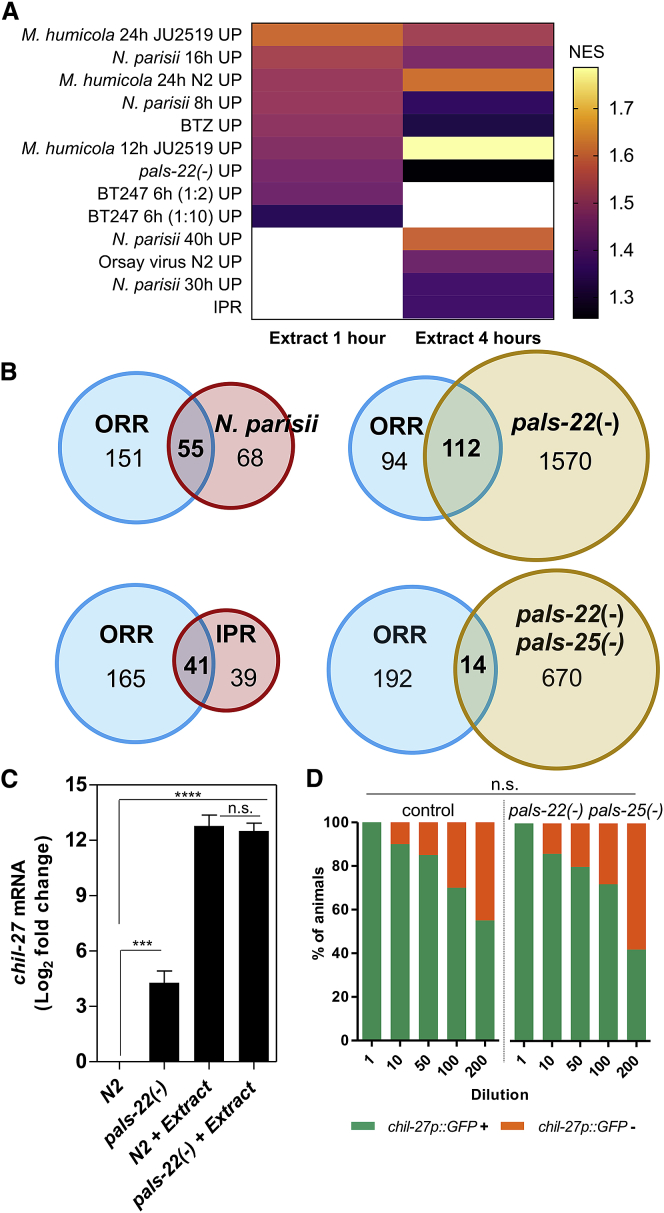
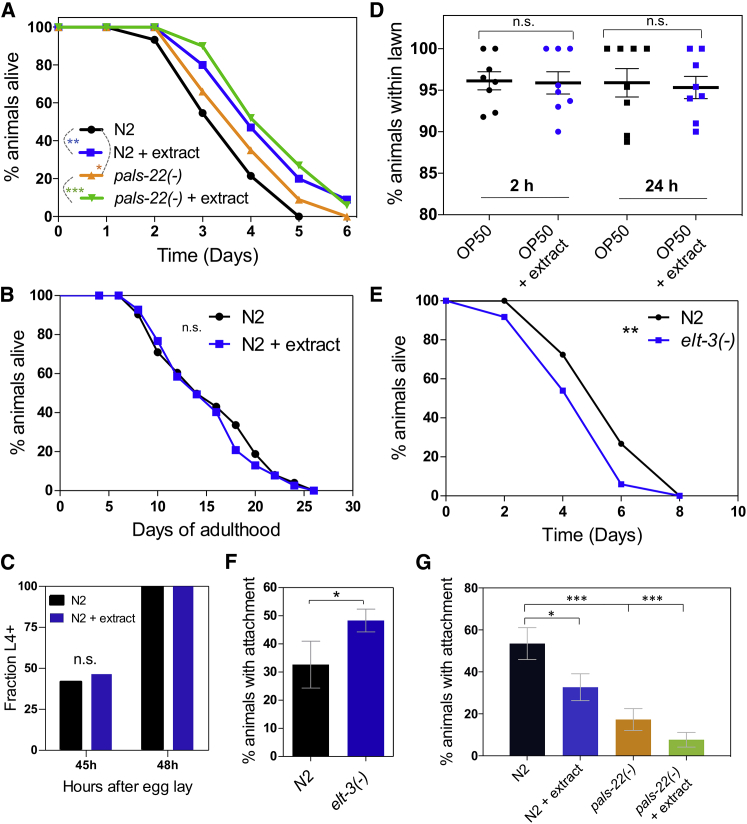
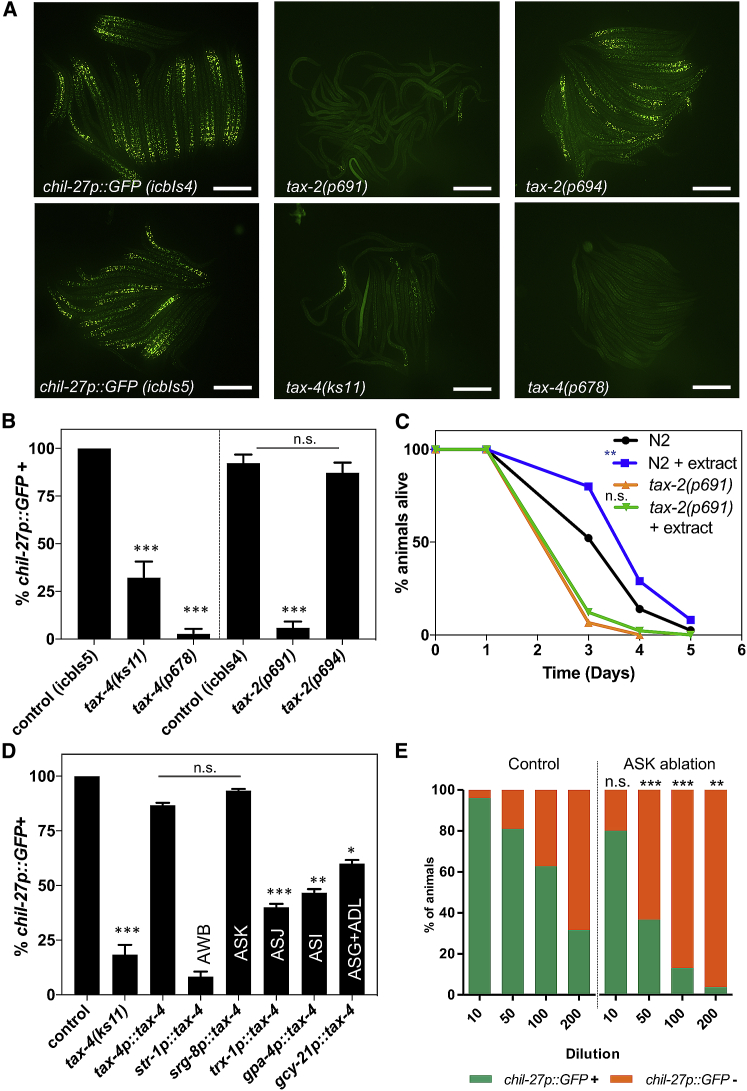
Understanding how animals detect and respond to pathogen threats is central to dissecting mechanisms of host immunity. The oomycetes represent a diverse eukaryotic group infecting various hosts from nematodes to humans. We have previously shown that Caenorhabditis elegans mounts a defense response consisting of the induction of chitinase-like (chil) genes in the epidermis to combat infection by its natural oomycete pathogen Myzocytiopsis humicola. We provide here evidence that C. elegans can sense the oomycete by detecting an innocuous extract derived from animals infected with M. humicola. The oomycete recognition response (ORR) leads to changes in the cuticle and reduction in pathogen attachment, thereby increasing animal survival. We also show that TAX-2/TAX-4 function in chemosensory neurons is required for the induction of chil-27 in the epidermis in response to extract exposure. Our findings highlight that neuron-to-epidermis communication may shape responses to oomycete recognition in animal hosts.

Keywords: Caenorhabditis elegans; Myzocytiopsis humicola; chitinase-like genes; cross-tissue signaling; cuticle; hypodermis; innate immunity; oomycete; pals; pathogen recognition.


Conflict of interest statement

Declaration of Interests The authors declare no competing interests.

Figures

None
Graphical abstract
Figure 1
Figure 1
An Extract from M. humicola-Infected Nematodes Can Induce chil-27p::GFP Expression in C. elegans without Infection (A) A non-infectious extract made by washing infected plates with water leads to 100% chil-27p::GFP induction in the population. Control here refers to extract made from plates with no oomycete infection, and this treatment does not result in chil-27p::GFP expression (0% induction, n > 100). (B) Representative chil-27p::GFP induction assay upon dilution of filtered pathogen extract versus autoclaved extract. No significant difference is found between the two treatments. (C) Expression of chil-27 by smFISH upon pathogen extract exposure. Image shows a second larval stage animal 1 h post extract or control treatment. A dpy-7p::GFP marker is used to visualize hypodermal nuclei. Note co-localization of chil-27 mRNAs with hypodermal nuclei (hyp6 and anterior hyp7). Scale bars: 100 μm in (A) and 20 μm in (C). See also Figure S1.
Figure 2
Figure 2
Transcriptional Response to Pathogen Extract Defines an Oomycete Recognition Response (A) Cartoon summarizing the design of the RNA-seq experiment. N2 animals at the L4 stage were exposed to pathogen extract for 1, 4, 12, and 24 h or to live pathogen for 12, 24, and 48 h, respectively. (B) Heatmap showing the members of the chil gene family that are differentially expressed by pathogen extract and infection. Heatmap color is based on Sleuth b values, which are analogous to fold change (Pimentel et al., 2017). White color indicates that the gene was not significantly upregulated in that condition (significance is defined as p value < 0.01 and FDR-adjusted p value < 0.1). (C) Venn comparison showing the overlap of differentially expressed genes by extract and M. humicola infection (pooled time points). This overlap is significant with a representation factor (RF) 8.3 and p value < 2.858 × 10−99 with a hypergeometric test. (D) Classification of upregulated ORR genes. A major fraction of these genes (n = 117) are only inducible upon extract treatment: 36 genes are reported to be expressed in the hypodermis, while 43 genes are not expressed in the hypodermis in wild type based on a threshold of <5 transcripts per million (Cao et al., 2017a). Pseudogenes have been removed, so 196 genes have been used in this analysis. (E) Gene Ontology (GO) enrichment analysis for the upregulated ORR genes using WormBase. Adjusted p value is shown on the x axis, and GO terms are listed on the y axis. (F) Force-displacement curves using atomic force microscopy. N2 animals treated with extract show reduction in stiffness, n > 20 animals per genotype. (G) Induction of chil-27p::GFP in elt-3(gk121) versus control (∗∗∗p value < 0.001 and ∗∗p value < 0.01 with a chi-square test for each independent dilution, n > 50 for each dilution). See also Figure S2 and Tables S1, S2, and S3.
Figure 3
Figure 3
Comparative Analysis of the Oomycete Recognition Response (A) Heatmap presenting the normalized enrichment score (NES) derived from GSEA analysis and focusing on all gene sets showing significant intersection with our pathogen extract datasets. White color depicts no significant intersection (FDR < 0.25 and nominal p value < 0.05). (B) Venn diagrams comparing the upregulated ORR genes versus IPR (RF: 38.1, p < 1.892 × 10−56), N. parisii infection at 8 h (RF: 33.3, p < 9.031 × 10−72), and pals-22(jy3) (RF: 5, p < 1.070 × 10−53) and pals-22(jy3) pals-25(jy9) double mutants (RF: 1.5, non-significant). RNA-seq data used here are from Reddy et al. (2019). (C) qRT-PCR for chil-27 expression in pals-22(icb89) treated with extract and N2 treated with extract (p < 0.001, one-way ANOVA and Tukey’s multiple comparison test) and N2 upon extract treatment. (D) pals-22(icb90) pals-25(icb92) double mutants respond to extract just like N2 at all extract dilutions (results are non-significant with a chi-square test for each independent dilution, n > 50 for each dilution). See also Figure S3 and Table S4.
Figure 4
Figure 4
Exposure of C. elegans to Pathogen Extract Leads to Reduced Pathogen Attachment and Provides Protection from Oomycete Infection (A) Infection assay comparing N2 and pals-22(icb89) animals with or without previous exposure to extract (∗∗∗p value < 0.001, ∗∗p value < 0.01, p value < 0.05 with a log rank test, n = 60–90 animals per condition). (B) Life-span comparison of animals treated with extract versus non-treated controls. No significant difference was found with a log rank test. (C) Quantification of developmental pace by measuring the fraction of animals at or beyond the L4 stage at two different time points. No difference was observed upon extract treatment with a chi-square test. (D) Avoidance assay depicting the percentage of animals leaving the lawn in 2 and 24 h with or without adding pathogen extract. (E) Survival curve of N2 and elt-3(gk121) animals at 20°C in the presence of M. humicola JUo1 (∗∗p < 0.01 with log rank test, n = 60 for each). (F) Percentage of N2 and elt-3(−) animals showing oomycete attachment after 4 h exposure with the pathogen at 20°C (p < 0.05 with chi-square test, n = 40). (G) Attachment assay for N2 and pals-22(icb89) animals with or without previous exposure to extract (p value < 0.05 and ∗∗∗p value < 0.001 with a chi-square test and comparisons made to N2 control, n = 50). See also Figure S4.
Figure 5
Figure 5
Neuronal Signaling Is Required for C. elegans Response to Pathogen Extract (A) chil-27p::GFP transgene induction assays in strains carrying tax-2 or tax-4 mutations using 1:100 dilution of the pathogen extract. Images show a group animals per genotype clustered together. Scale bars, 200 μm. (B) Quantification of induction assay for tax-2 and tax-4 mutants, n > 30. Note that strains carrying the tax-2(p691), tax-4(ks11), or tax-4(p678) alleles are strongly impaired in their ability to respond to extract (∗∗∗p value < 0.001 with a Fisher’s exact test in comparison with control). However, animals that carry the tax-2(p694) mutation that allows for tax-2 expression in a subset of neurons respond normally. (C) Infection assay comparing N2 with tax-2(p691) mutants, with or without pre-exposure to extract (∗∗p value < 0.01 with a log rank test, n = 60–90 animals per condition). Note that tax-2(p691) is more susceptible than N2 to infection (∗∗∗p value < 0.001), but extract treatment does not have any protective effect. (D) Induction assays in strains carrying transgenes that rescue tax-4 mutants in specific neurons. Note that rescue in ASK neurons leads to similar induction to that observed with the endogenous tax-4 promoter, while no rescue or only partial rescue was observed in the case of other neuronal promoters (∗∗∗p value < 0.001, ∗∗p value < 0.01, p value < 0.05 with a Fisher’s exact test, all comparisons are against the rescue observed using the endogenous tax-4 promoter). Control induction in wild-type animals carrying chil-27p::GFP is shown as reference. (E) Quantification of chil-27p::GFP induction in ASK ablated C. elegans (through expression of a sra-9p::mCasp-1 transgene) in response to serial dilution of the pathogen extract. ASK-ablated strain shows significantly reduced response to extract (∗∗∗p value < 0.001 and ∗∗p value < 0.01 with a chi-square test, n = 50 for each dilution). See also Figures S5 and S6.

References

    1. Akira S., Uematsu S., Takeuchi O. Pathogen recognition and innate immunity. Cell. 2006;124:783–801. - PubMed
    1. Angeles-Albores D., N Lee R.Y., Chan J., Sternberg P.W. Tissue enrichment analysis for C. elegans genomics. BMC Bioinformatics. 2016;17:366. - PMC - PubMed
    1. Bakowski M.A., Desjardins C.A., Smelkinson M.G., Dunbar T.L., Lopez-Moyado I.F., Rifkin S.A., Cuomo C.A., Troemel E.R. Ubiquitin-mediated response to microsporidia and virus infection in C. elegans. PLoS Pathog. 2014;10:e1004200. - PMC - PubMed
    1. Beakes G.W., Glockling S.L., Sekimoto S. The evolutionary phylogeny of the oomycete “fungi”. Protoplasma. 2012;249:3–19. - PubMed
    1. Bigg H.F., Wait R., Rowan A.D., Cawston T.E. The mammalian chitinase-like lectin, YKL-40, binds specifically to type I collagen and modulates the rate of type I collagen fibril formation. J. Biol. Chem. 2006;281:21082–21095. - PubMed

Publication types

MeSH terms

Substances