. 2021 Feb 4;108(2):219-239.
doi: 10.1016/j.ajhg.2020.12.005. Epub 2021 Jan 12.

Disentangling selection on genetically correlated polygenic traits via whole-genome genealogies

Affiliations

Disentangling selection on genetically correlated polygenic traits via whole-genome genealogies

Aaron J Stern et al. Am J Hum Genet. .

Abstract

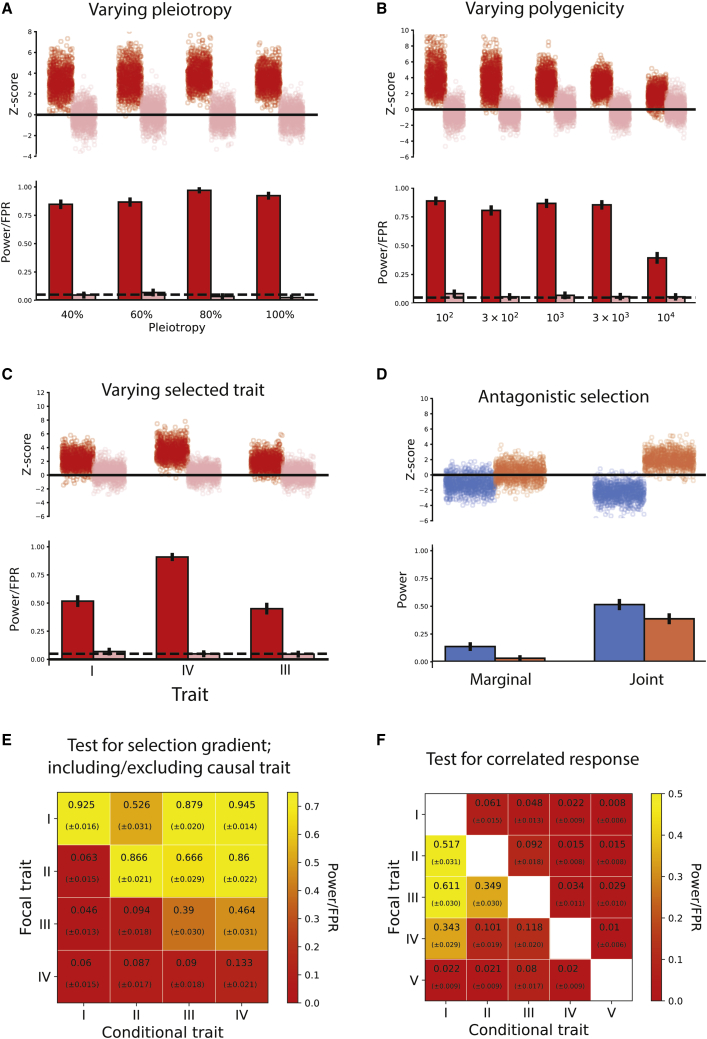
We present a full-likelihood method to infer polygenic adaptation from DNA sequence variation and GWAS summary statistics to quantify recent transient directional selection acting on a complex trait. Through simulations of polygenic trait architecture evolution and GWASs, we show the method substantially improves power over current methods. We examine the robustness of the method under stratification, uncertainty and bias in marginal effects, uncertainty in the causal SNPs, allelic heterogeneity, negative selection, and low GWAS sample size. The method can quantify selection acting on correlated traits, controlling for pleiotropy even among traits with strong genetic correlation (|rg|=80%) while retaining high power to attribute selection to the causal trait. When the causal trait is excluded from analysis, selection is attributed to its closest proxy. We discuss limitations of the method, cautioning against strongly causal interpretations of the results, and the possibility of undetectable gene-by-environment (GxE) interactions. We apply the method to 56 human polygenic traits, revealing signals of directional selection on pigmentation, life history, glycated hemoglobin (HbA1c), and other traits. We also conduct joint testing of 137 pairs of genetically correlated traits, revealing widespread correlated response acting on these traits (2.6-fold enrichment, p = 1.5 × 10⁻⁷). Signs of selection on some traits previously reported as adaptive (e.g., educational attainment and hair color) are largely attributable to correlated response (p = 2.9 × 10⁻⁶ and 1.7 × 10⁻⁴, respectively). Lastly, our joint test shows antagonistic selection has increased type 2 diabetes risk and decrease HbA1c (p = 1.5 × 10⁻⁵).

Keywords: GWAS; adaptation; ancestral recombination graph; polygenic selection; stratification; thrifty gene.


Conflict of interest statement

The authors declare no competing interests.

Figures

Figure 1
Figure 1
PALM power, calibration, and robustness to uncorrected stratification and ascertainment (A) Left: Power/false positive rate (FPR) of PALM and tSDS. Error bars denote 95% Bonferroni-corrected confidence intervals. Right: PALM selection gradient estimates (ωˆ). Error bars denote 25th–75th percentiles (thick) and 5th–95th percentiles (thin) of estimates; see Table 1 for more details of ωˆ moments and error. Markers and colors in (A) also apply to (B) and (D). (B) FPR of PALM and tSDS applied to neutral simulations with uncorrected population stratification, simulated with 1000 Genomes data. We used baseline values of σS=0.1,NTSI/NGBR=1%, M=103,h2=50% by using SNPs ascertained at p<5×10⁸. Error bars denote 95% Bonferroni-corrected confidence intervals. (C) Comparison of PALM with true versus Relate-inferred trees, causal versus GWAS-ascertained tag SNPs, and true marginal SNP effects (solid) versus GWAS-estimated SNP effects (hatched). Error bars denote 95% Bonferroni-corrected confidence intervals. (D) Varying polygenicity (M) of the polygenic trait. Error bars denote 95% Bonferroni-corrected confidence intervals. Baseline parameters for all simulations except (C) were our constant-size model with M=103,with Scz under positive selection and testing Scz for selection. In (A) and (B), we use Relate-inferred trees and estimated SNP effects at the causal SNPs; in (D), we use Relate-inferred trees and estimated effects at tag SNPs. In all panels, we use a 5% nominal FPR (dashed horizontal line) and simulated 103replicates. In (D), light/saturated colors signify neutral/selected simulations.
Figure 2
Figure 2
Joint testing for polygenic adaptation controls for pleiotropy (A) We simulated a cluster of four traits (I–IV) modeled after real human heritability and genetic correlation estimates for schizophrenia (I), bipolar disorder (II), major depression (III), and anorexia (IV), with selection to increase trait I in the last 50 generations. (B and C) We ran marginal and joint tests for selection on these four traits. While marginal selection tests were well powered, they were strongly biased by even fairly low genetic correlations. Conducting a joint test fully controls for genetic correlations while retaining high power to detect and isolate selection on trait I. Simulations (1,000 replicates) were done under our constant effective population size model with ϱ=60%,M=1,000,with trait I under positive selection.
Figure 3
Figure 3
Simulations of joint testing power and calibration (A–F) Differing the degree of pleiotropy ϱ (A), the trait truly under selection (B), the polygenicity M of the traits (C), antagonistic selection on two traits with positive genetic correlation (D), pairwise tests for selection (trait I under selection) (E), and pairwise tests for correlated response (trait I under selection) (F). In (A)–(D), red/pink/blue bars indicate estimates of selection for traits under positive selection/neutrality/negative selection. In (E) and (F), heatmap is colored by positive rate (also text in boxes; standard errors in parentheses). Dashed horizontal lines indicate 5% nominal significance level, and black lines indicate 95% Bonferroni-corrected confidence intervals. Baseline parameters for all simulations (1,000 replicates under each scenario) were our constant-size model with ϱ=60%,M=1,000,with trait I under positive selection. In (A) and (B) and (D), joint tests are performed on trait I/trait III and trait I/trait II, respectively. (E) Diagonal elements correspond to marginal test for selection.
Figure 4
Figure 4
Schematic of “intractable” GxE and induced heritability/genetic correlation Consider Planet A in which there is a homogeneous environment where a policy states that only the fairest (i.e., lightest-skinned) teenagers are admitted to college. If skin color is heritable, then so will be years of education (EduYears) (with some minor attenuation due to truncation with respect to skin color). Likewise, since genetic variants that modulate skin color will also modulate the likelihood of being admitted to college, there will be a genetic correlation between the two traits. However, on Planet B, such a policy might not exist, and accordingly, the heritability of EduYears will be attenuated (as well as its genetic correlation with skin color, which will go to 0%). Unless a study extends into Planet B, GxE effects are indistinguishable from genetic effects.
Figure 5
Figure 5
Estimates of the selection gradient on 56 human traits The selection gradient (ωˆ) was estimated using 1000 Genomes Great British (GBR) individuals and summary statistics from various GWASs (see Table S4 for full results), with standard errors (seˆω) estimated via block bootstrap (Z=ωˆ/seˆω). Starred traits indicate significance at FDR = 0.05.
Figure 6
Figure 6
Correlated response in real traits (A) Expanded view of antagonistic selection on glycated hemoglobin (HbA1c) versus type 2 diabetes (T2D). We estimate individual SNP selection coefficients by taking the maximum-likelihood estimate sˆ for each SNP. We plot this value against the joint SNP effect estimates for HbA1c and T2D. Colored lines represent isocontours of s(β)=βHbA1cωˆHbA1c+βT2DωˆT2D, the estimate of the Lande transformation from SNP effects to selection coefficients, where ωˆ is inferred jointly for the two traits (Table 3). The purple-green color gradient illustrates expected selection coefficients under ωˆ (background) versus individual SNP selection coefficient estimates (rings). Ring diameter is proportional to SNP selection log-likelihood ratio. (B) Enrichment of correlated response in analysis of genetically correlated traits. Enrichment in the tails of the distribution of our test statistic for correlated response R(p=1.5×10⁷, binomial test), which had 2.6-fold enrichment at the nominal 5% level. We assessed n=2×137=274estimates of correlated response on 137 trait pairs with Bonferroni-significant prg<0.005/562 and |rg>0.20|. Red area indicates pointwise 95% CI of the survival curve.

References

    1. Loh P.-R., Bhatia G., Gusev A., Finucane H.K., Bulik-Sullivan B.K., Pollack S.J., de Candia T.R., Lee S.H., Wray N.R., Kendler K.S., Schizophrenia Working Group of Psychiatric Genomics Consortium Contrasting genetic architectures of schizophrenia and other complex diseases using fast variance-components analysis. Nat. Genet. 2015;47:1385–1392. - PMC - PubMed
    1. Shi H., Kichaev G., Pasaniuc B. Contrasting the Genetic Architecture of 30 Complex Traits from Summary Association Data. Am. J. Hum. Genet. 2016;99:139–153. - PMC - PubMed
    1. Boyle E.A., Li Y.I., Pritchard J.K. An Expanded View of Complex Traits: From Polygenic to Omnigenic. Cell. 2017;169:1177–1186. - PMC - PubMed
    1. Zeng J., de Vlaming R., Wu Y., Robinson M.R., Lloyd-Jones L.R., Yengo L., Yap C.X., Xue A., Sidorenko J., McRae A.F. Signatures of negative selection in the genetic architecture of human complex traits. Nat. Genet. 2018;50:746–753. - PubMed
    1. Simons Y.B., Bullaughey K., Hudson R.R., Sella G. A population genetic interpretation of GWAS findings for human quantitative traits. PLoS Biol. 2018;16:e2002985. - PMC - PubMed

Publication types

Substances

LinkOut - more resources