. 2021 Mar 10;29(3):394-407.e5.
doi: 10.1016/j.chom.2020.12.012. Epub 2021 Jan 12.

Role of dietary fiber in the recovery of the human gut microbiome and its metabolome

Affiliations

Role of dietary fiber in the recovery of the human gut microbiome and its metabolome

Ceylan Tanes et al. Cell Host Microbe. .

Abstract

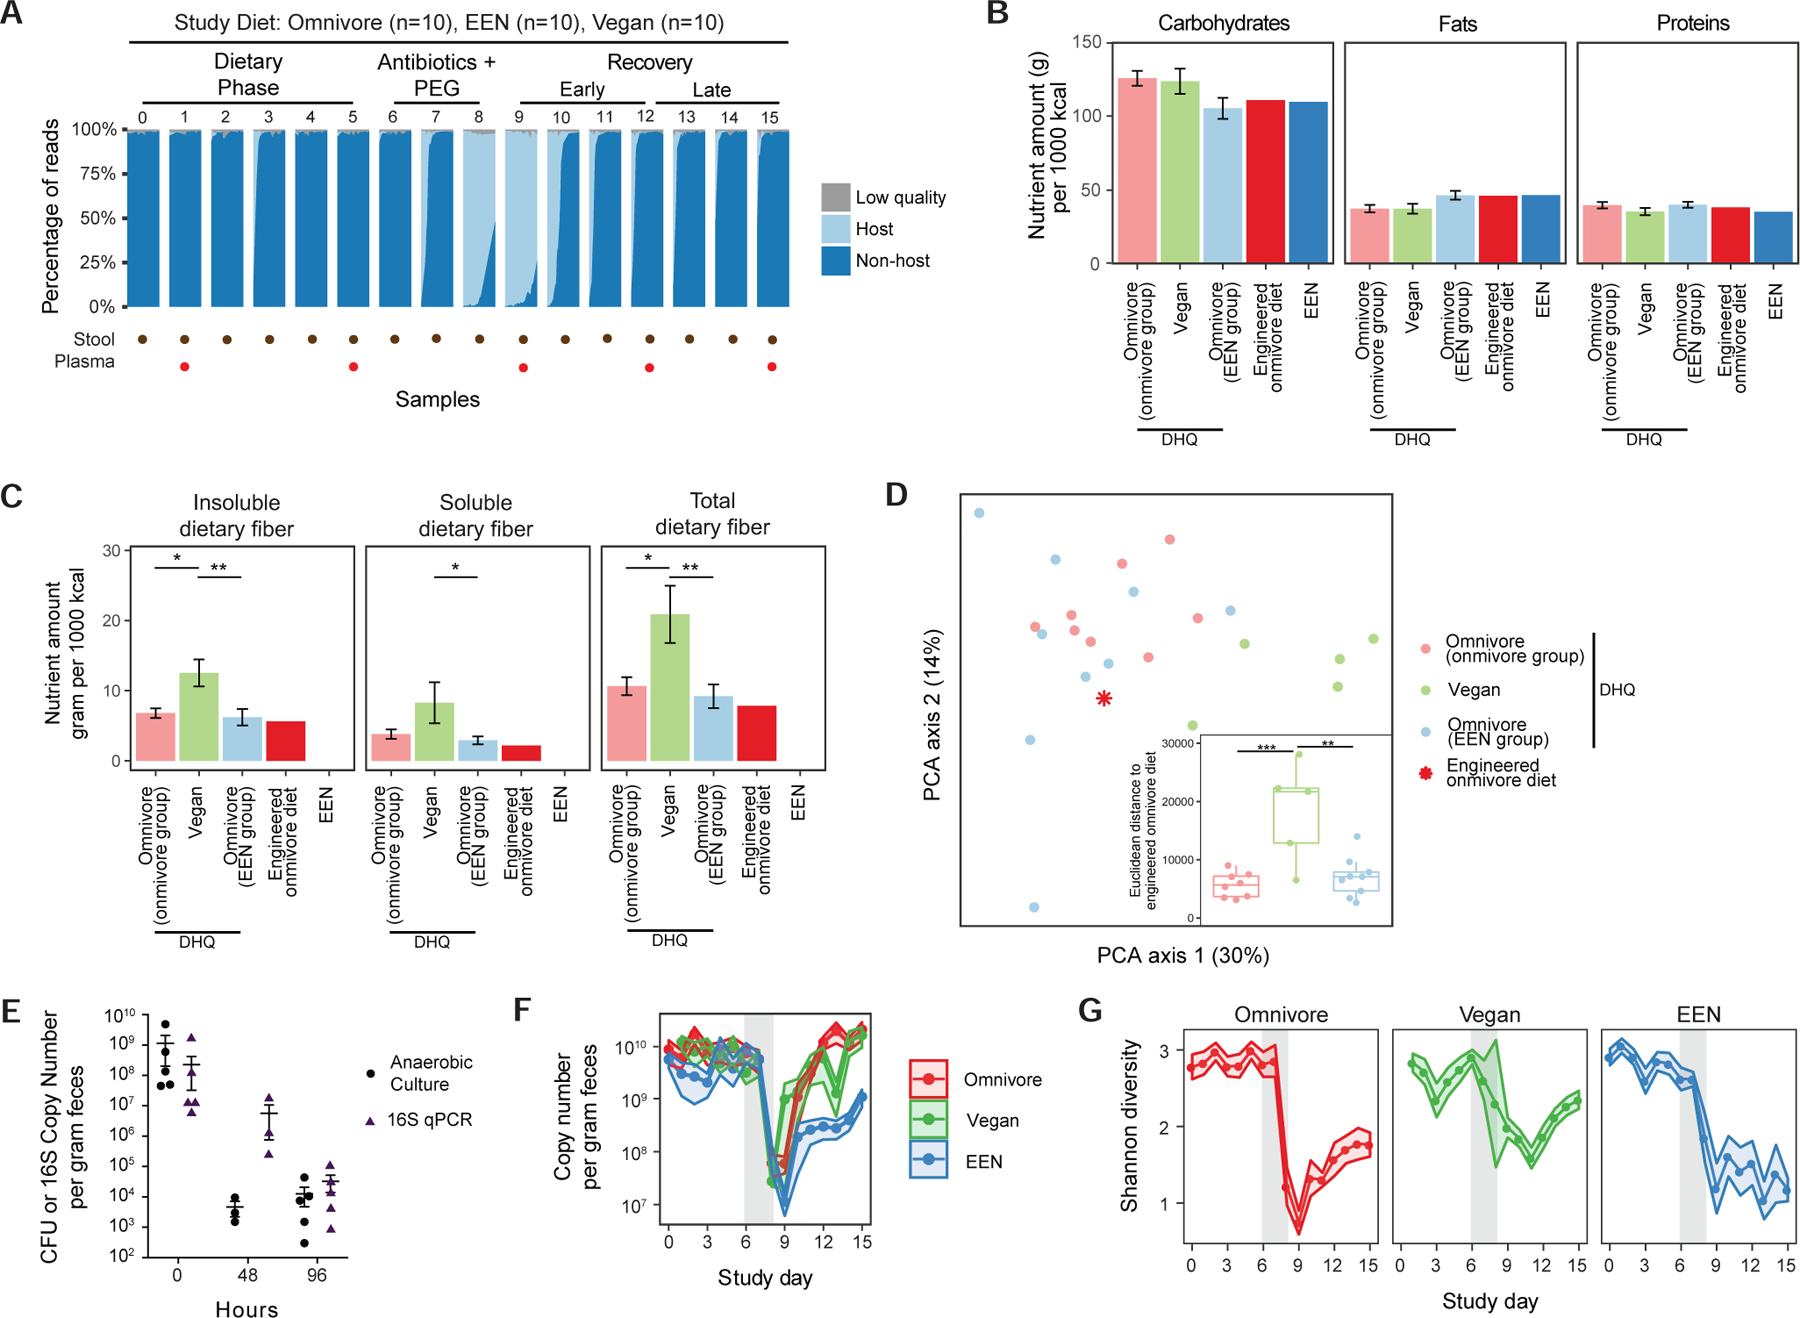
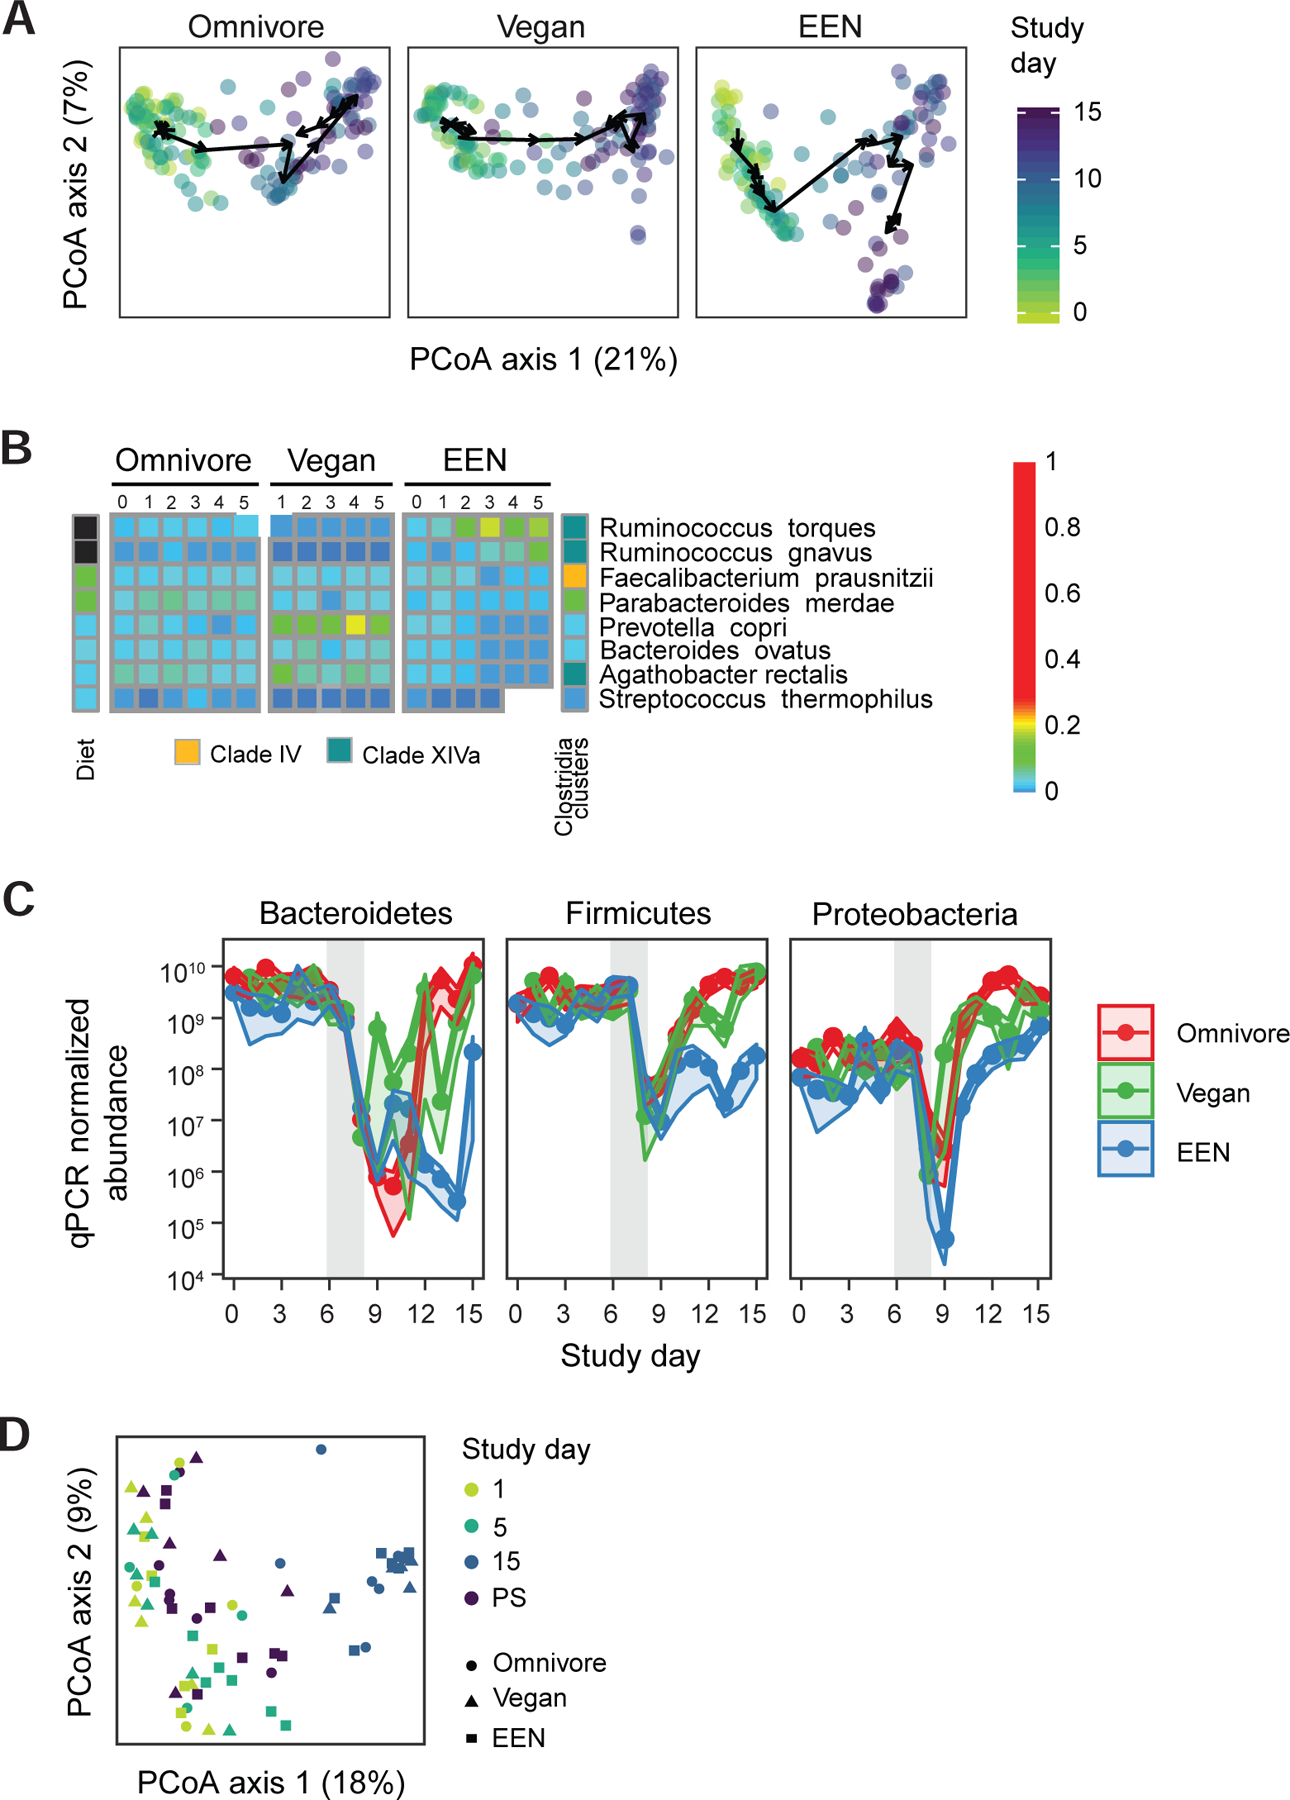
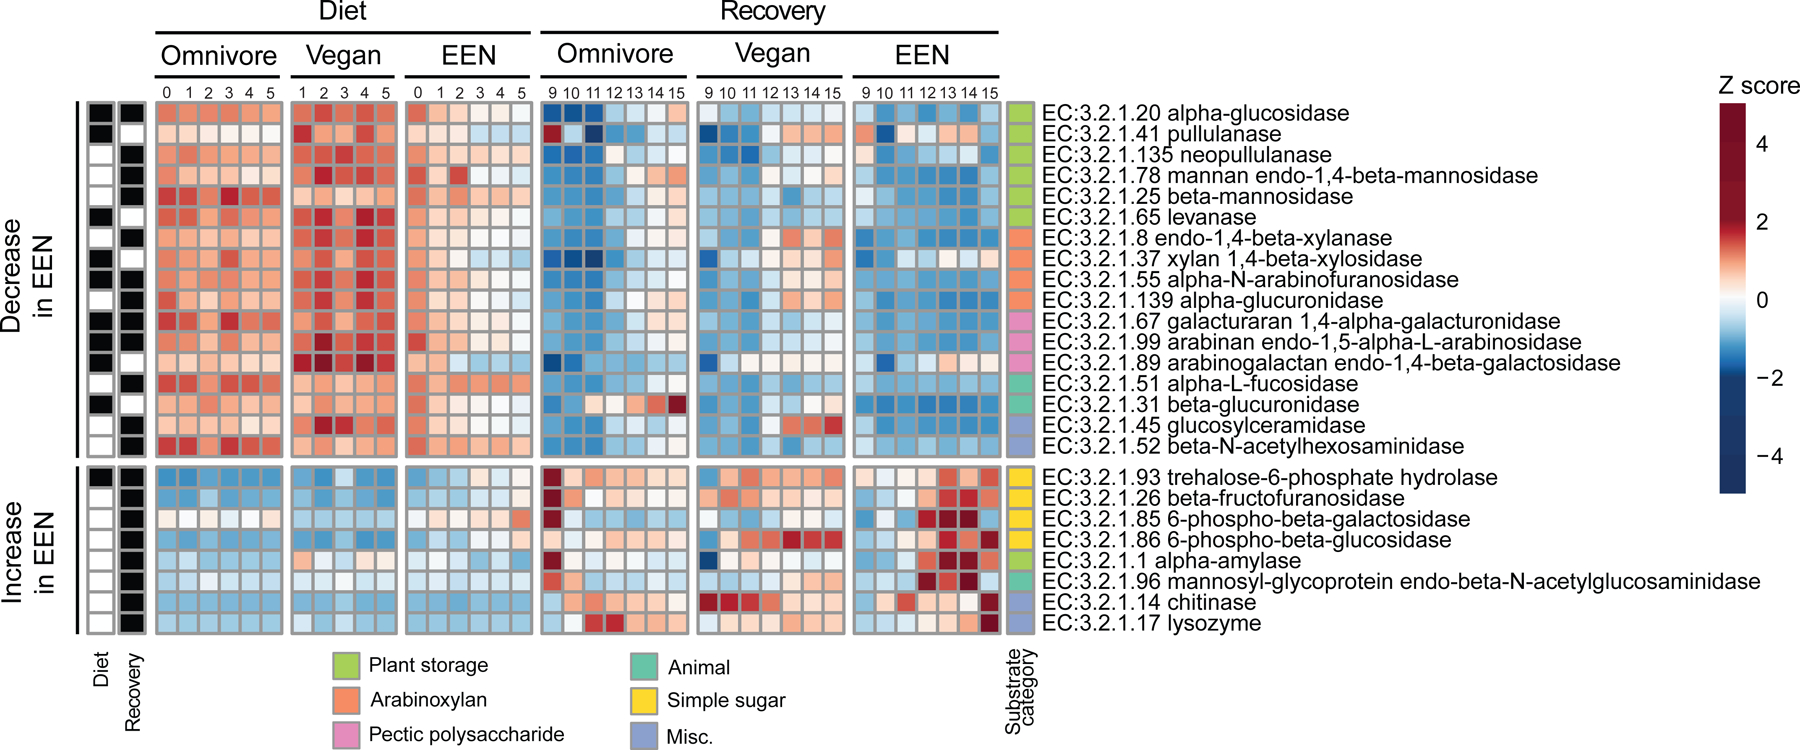
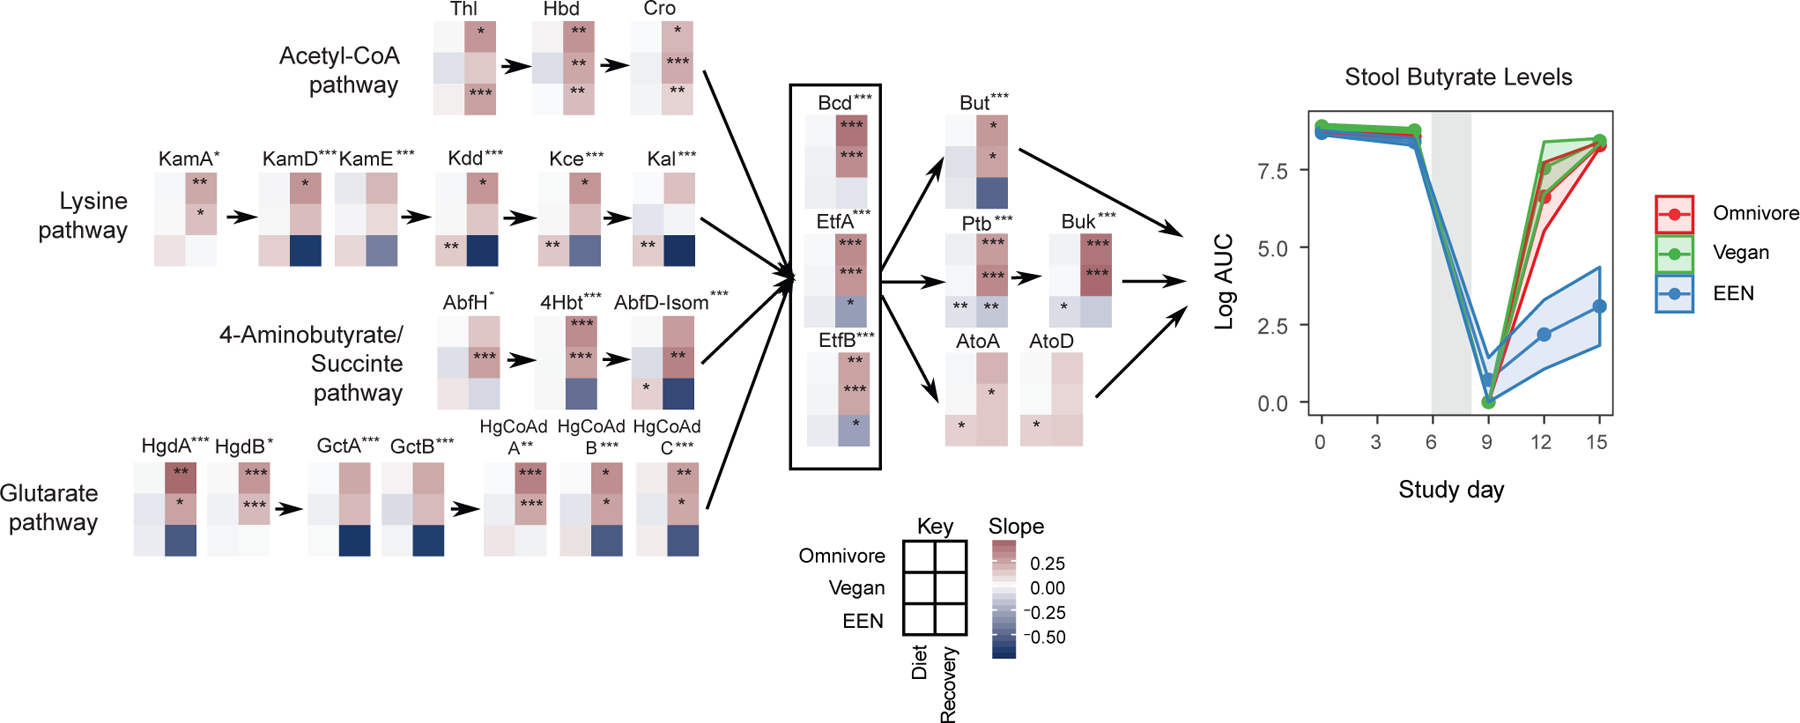
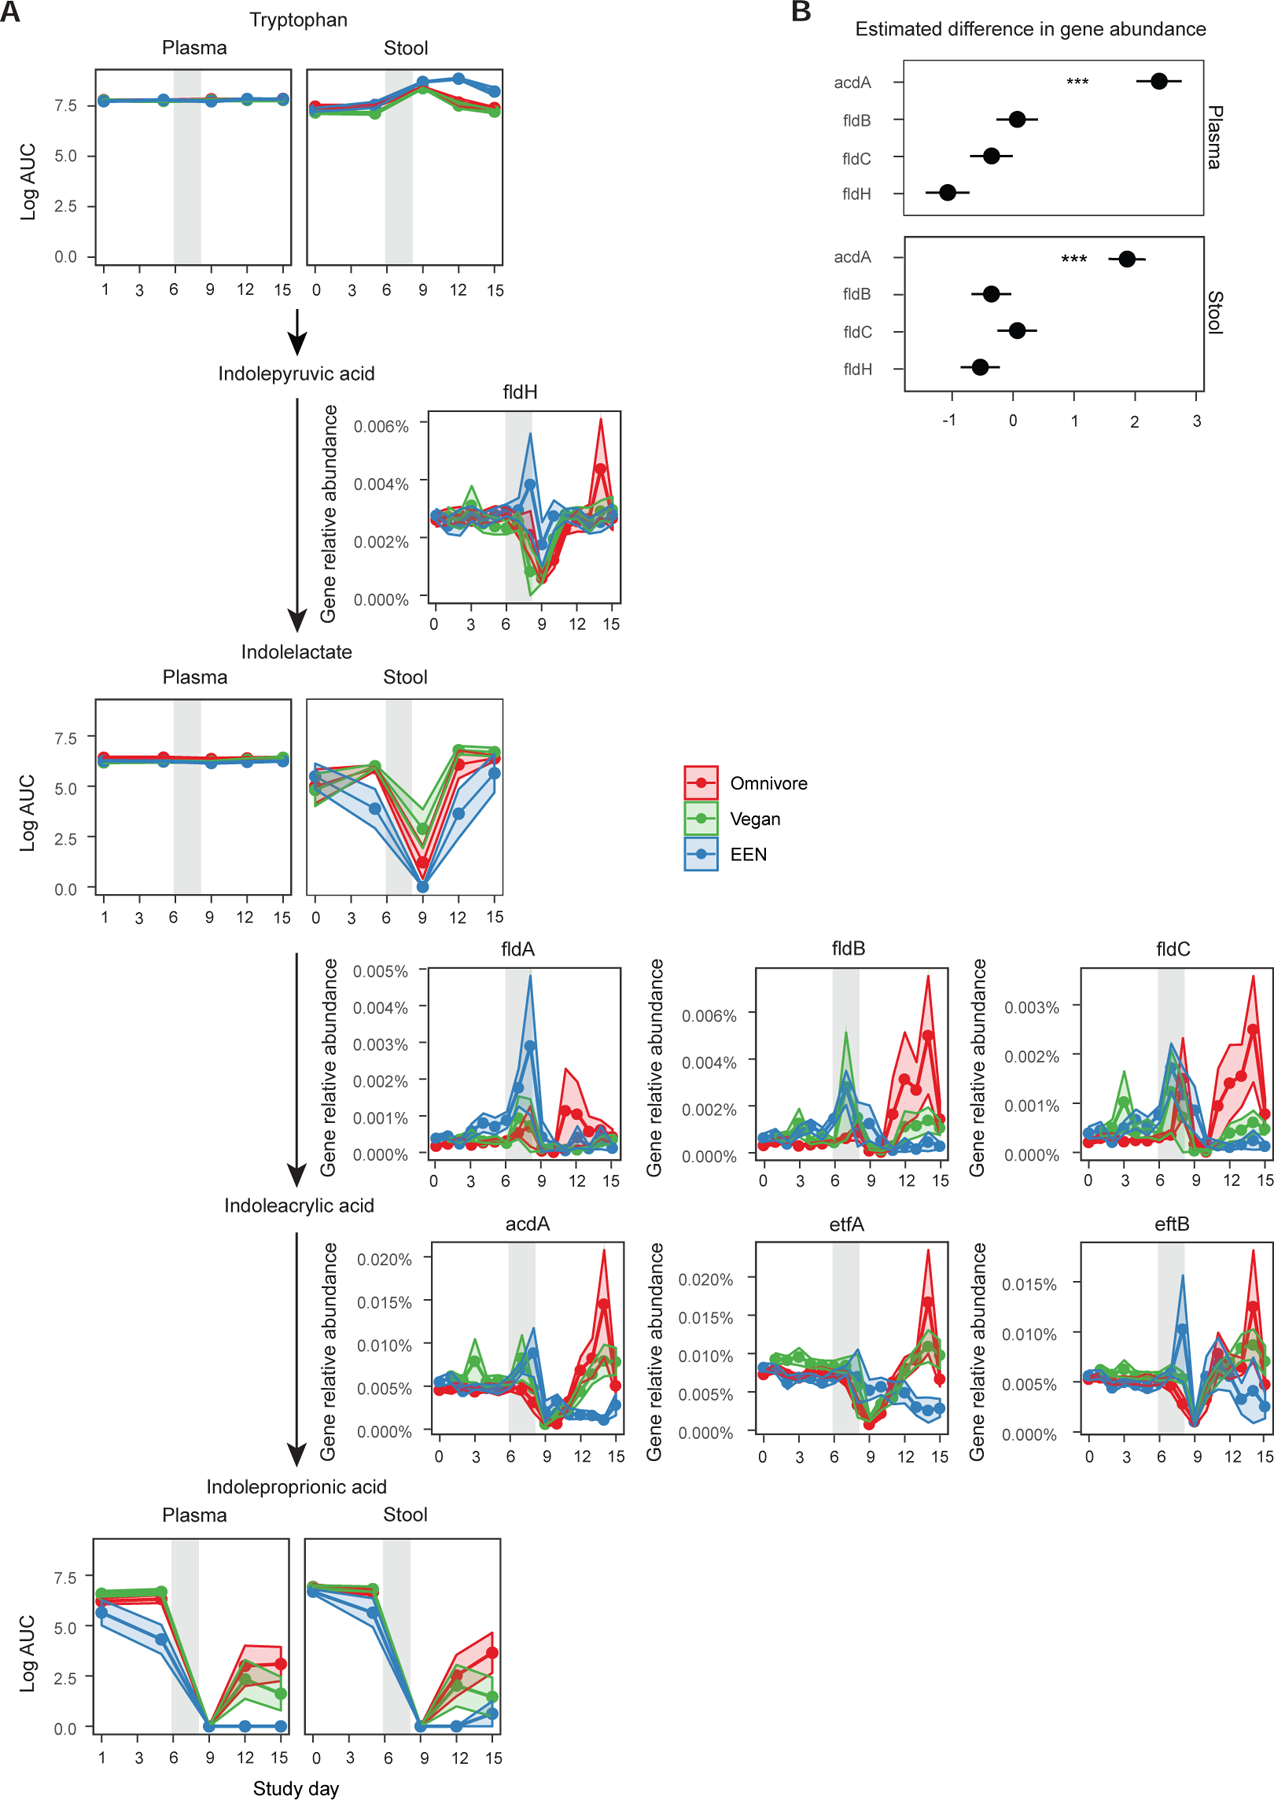
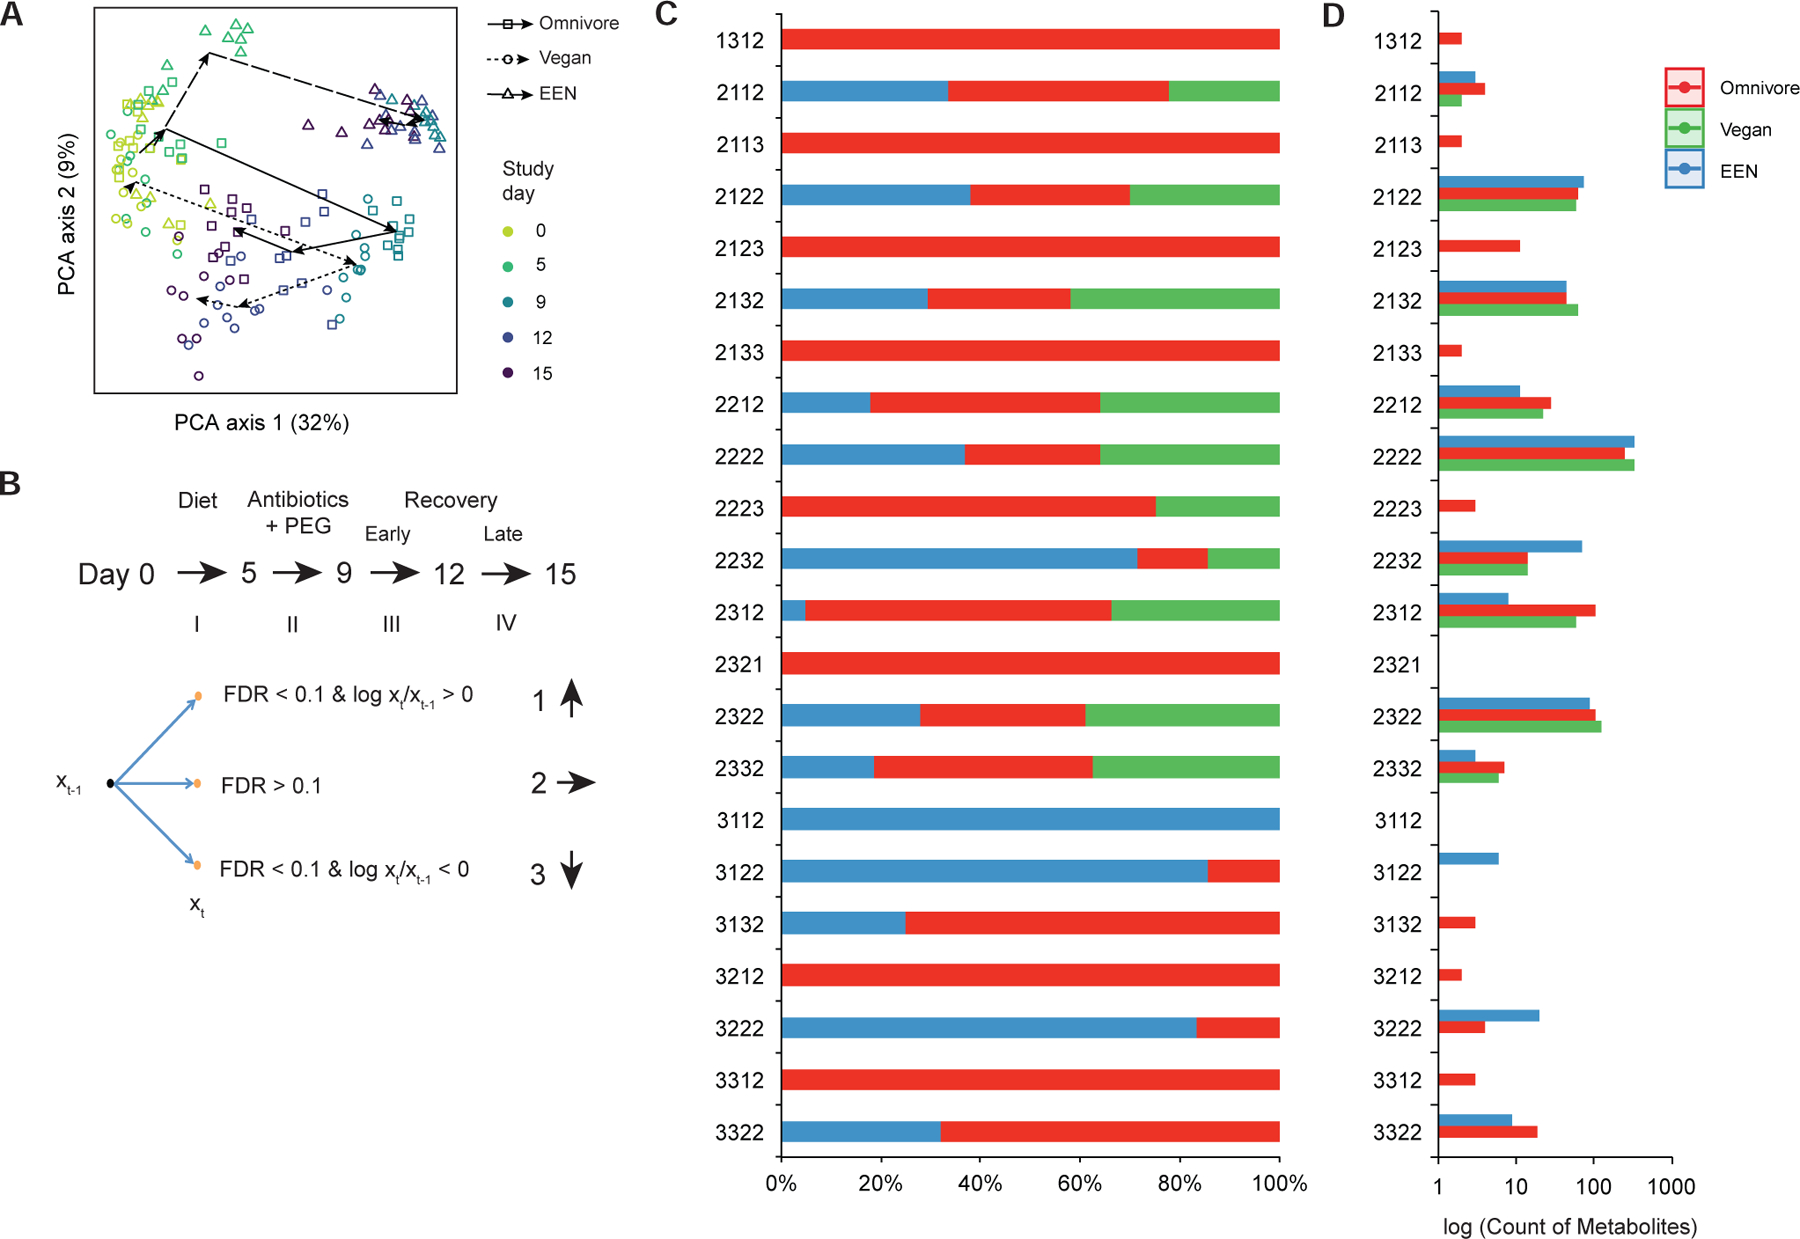
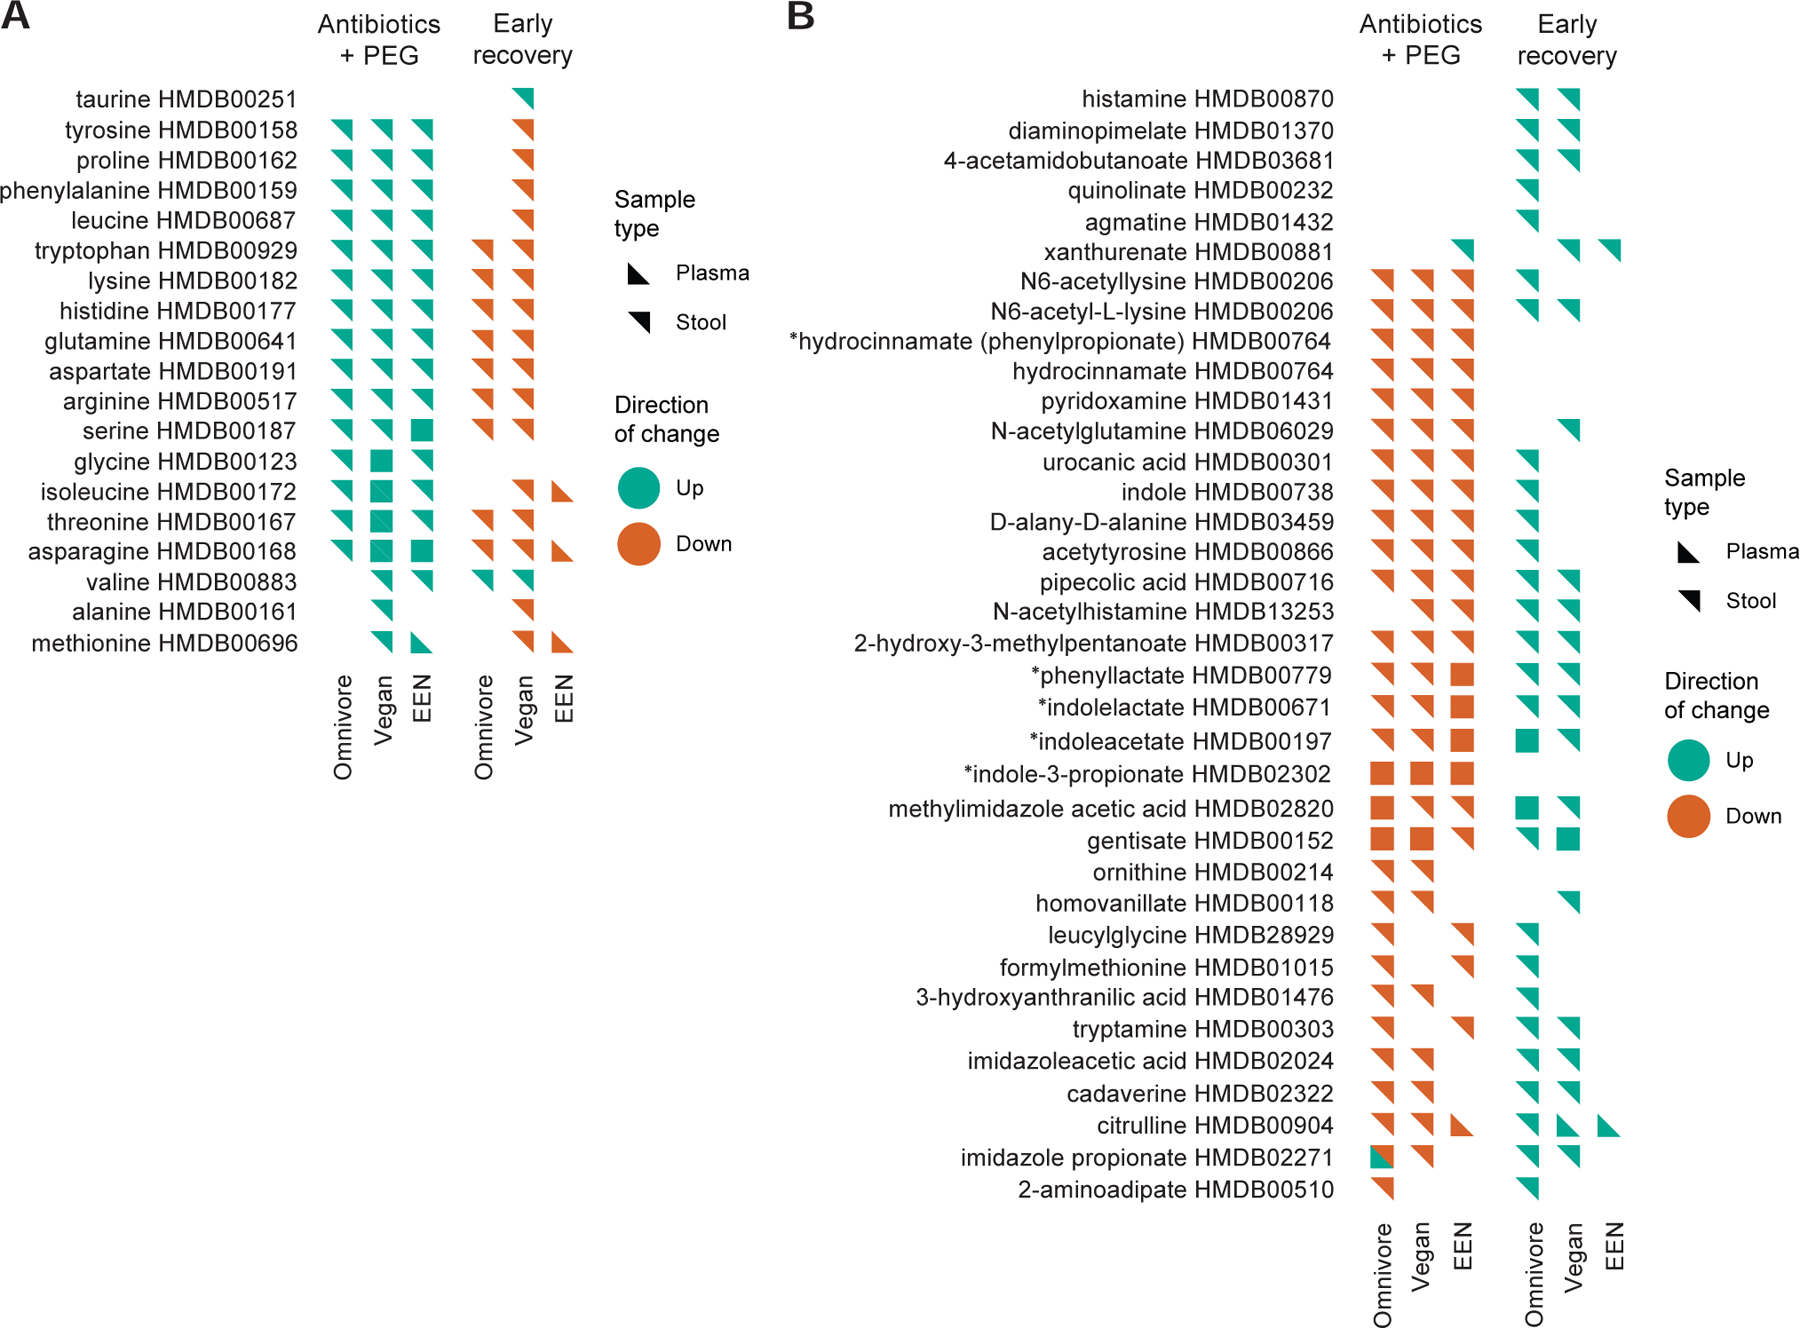
Gut microbiota metabolites may be important for host health, yet few studies investigate the correlation between human gut microbiome and production of fecal metabolites and their impact on the plasma metabolome. Since gut microbiota metabolites are influenced by diet, we performed a longitudinal analysis of the impact of three divergent diets, vegan, omnivore, and a synthetic enteral nutrition (EEN) diet lacking fiber, on the human gut microbiome and its metabolome, including after a microbiota depletion intervention. Omnivore and vegan, but not EEN, diets altered fecal amino acid levels by supporting the growth of Firmicutes capable of amino acid metabolism. This correlated with relative abundance of a sizable number of fecal amino acid metabolites, some not previously associated with the gut microbiota. The effect on the plasma metabolome, in contrast, were modest. The impact of diet, particularly fiber, on the human microbiome influences broad classes of metabolites that may modify health.

Keywords: dietary fiber, vegan, omnivore, amino acid; enteral nutrition; metabolome; microbiome.


Conflict of interest statement

Declaration of interests J.B. is on scientific advisory boards of Janssen Research and Prolacta Bioscience. M.A.F is a co-founder of Federation Bio. J.D.L. has received honorarium from Nestle Health Science for consulting and for participation in medical education events. F.D.R., J.D.L., and G.D.W. are co-inventors on patent no. US 10,058,576 B2 “Compositions and Methods Comprising a Defined Microbiome and Methods of Use Thereof.”

Figures

Figure 1.
Figure 1.
General response of the human gut microbiota during the three phases of the Food and Resulting Microbiota and Metabolite (FARMM) study. A) Overall study design is annotated at the top of the figure. The dots at the bottom of the figure represent the study days where either the fecal samples or plasma samples were collected. The plot shows the percentage of reads that were filtered for having low quality and for matching to the human genome (host) for each sample grouped by study day. The remaining non-host reads were further annotated with bacterial taxonomy and gene databases. B) Macronutrient compositions obtained from the NDSR analysis of the diet history questionnaires (DHQ) collected before the start of the study as well as the compositions of the study diets (N=17 for omnivores, N=5 for vegans). The omnivores were randomized to either receive the engineered omnivore diet or the EEN diet. C) Amounts of insoluble, soluble and total fiber consumed at baseline by all the diet groups as well as the levels in the engineered omnivore diet and EEN. Baseline diets were compared using linear models as shown (*q<0.05, **q<0.01, ***q<0.001). Ages of the subjects were added as a covariate. D) A Principal Component Analysis of the nutrient compositions from DHQ data with respect to the engineered omnivore diet. The sub plot shows the Euclidean distance between the DHQ data points and the engineered omnivore diet (*p<0.05, **p<0.01, ***p<0.001). Statistical testing was not performed for engineered omnivore diet and EEN diet since their composition does not vary from subject to subject (standard deviation is 0). E) The colony forming units (CFU) and 16S qPCR data in response to Abx/PEG intervention from a previous study (Ni et al., 2017). Data are represented as mean +/− standard error of the mean (SEM). F) qPCR results showing copy number of 16S genes per gram feces for each day in the study. The confidence intervals represent the SEM. The gray shaded area represents the antibiotic/PEG phase of the study. Linear mixed effects model was used to assess differences in copy number for each diet per study phase. G) Shannon diversity of the samples throughout the study. The confidence intervals represent the SEM. Linear mixed effects model was used to assess differences in diversity for each diet per study phase.
Figure 2.
Figure 2.
Taxonomic alterations of the human gut microbiome throughout the course of the FARMM study. A) Principal coordinate analysis of Bray-Curtis distances. All three facets share the same axes and can be overlaid. The axes are labeled with the percent variance explained. The arrows connect the centroids of consecutive time points for each diet. PERMANOVA test on Bray-Curtis distances was used to assess if the microbiome communities of the diet groups are different for each day. B) The taxa that are significantly different in EEN diet compared to the omnivore diet during the diet phase based on linear mixed effects models (q<0.05). The taxa that increase during the diet phase with the EEN diet are annotated in black and the taxa that decrease in abundance are annotated with white squares. Taxa are further annotated with the Clostridia clade to which they belong. C) The qPCR corrected relative abundance of three major phyla in three diets studied. The confidence intervals represent the SEM. The gray shaded areas represent the antibiotic/PEG phase of the study. Linear mixed effects model was used to assess differences in copy number corrected relative abundances for each diet per study phase. D) Principal coordinate analysis of Bray-Curtis distances of shotgun metagenomics data representing the samples collected 14–28 months after the Abx/PEG intervention (PS) from the subjects that participated in the original study as well as the samples collected on day 1 (pre Abx/PEG intervention), 5 (end of the diet phase), and 15 (end of study) of the original study.
Figure 3.
Figure 3.
Genomic representation of glycoside hydrolase genes throughout the duration of the FARMM study. The glycoside hydrolase genes that have significantly different progression profiles in the EEN diet compared to the omnivore diet using linear mixed effects models on log transformed relative abundance of enzymes (q<0.05) are shown. The values represent the Z-scores of study day averages calculated per enzyme. The enzymes are grouped by their substrate category of plant based (storage, arabinoxylan, pectic polysaccharide), animal based, simple sugars or miscellaneous. The upper half of the plot shows any enzyme that shows a decreasing trend in EEN diet and the lower half of the plot shows an increasing trend in EEN diet compared to Omnivore diet. The black boxes denote if the statistically significant change was observed during the diet, recovery, or both phases. No enzymes had a statistically significant increase in one period and decrease in the other period.
Figure 4.
Figure 4.
The human gut microbiome and butyrate production. Left Panel: The change in relative abundance of genes in four pathways responsible for butyrate production as curated by Vital et al.(Vital et al., 2014). Linear mixed effects models were fit to logit transformed gene relative abundance levels for each diet and study phase (diet or recovery) separately. Each 6 grid heatmap represents the slopes obtained from these linear mixed effects models where the rows represent the diet slopes and the columns represent the study phase. The stars within the heatmap boxes represent if the slope is significantly different than 0 based on linear mixed effects models. The p values were corrected for false discovery rate using Benjamini-Hochberg method (q<0.05). A separate linear mixed effects model was built to find the genes that show a different slope profile in EEN group compared to the omnivore group during the recovery phase. The stars next to the gene names represent if this progression profile of gene abundance is significantly different (*q<0.05, **q<0.01, ***q<0.001). Right Panel: Fecal butyrate levels throughout the duration of the FARMM study from untargeted metabolomics results. The confidence intervals represent the SEM. The gray shaded areas represent the antibiotic/PEG phase of the study.
Figure 5.
Figure 5.
The reduction pathway of tryptophan to indole propionic acid. A) The intermediate metabolite levels in plasma and stool are shown for each diet group connected by the arrows to denote the progression of enzymatic reactions. The relative abundance of genes and their co-activators responsible for a reaction are denoted next to the arrows. The confidence intervals represent the SEM and the gray shaded areas represent the antibiotic/PEG phase of the study. Linear mixed effects model was used to assess differences in gene relative abundances or metabolite log area under the curve (AUC) values for each diet per study phase. B) Results of the generalized linear mixed effects model to determine which enzyme is a better predictor of indolepropionic acid levels in the plasma or the stool. The outcome was the presence or absence of indole propionic acid in stool or plasma (binary outcome transformed with binomial link) and the predictors were limited to the main enzymes and did not include any co-activators or cofactors to avoid collinearity.
Figure 6.
Figure 6.
A statistical model to describe alterations in fecal metabolite levels across the four time intervals in the FARMM study. A) A Principal component analysis of fecal metabolites across the three diets (symbols) with colors representing each day of the study as indicated. The arrows connect the centroids of consecutive time points for each diet. B) Statistical model to provide a four-digit code per diet showing statistically-significant alterations of fecal metabolites across each of four time intervals using paired t-tests. Metabolite level changes in each interval were coded as an increase, no change or decrease (coded as a 1, 2, and 3, respectively) based on the criteria shown. C) Percent of fecal metabolites assigned to each of the four-digit codes that showed statistically-significant changes color coded by diet. D) Count of metabolites assigned to each four-digit code, log scale.
Figure 7.
Figure 7.
Lists of fecal metabolites, annotated as “amino acids” by the Human Metabolome Database (HMDB) with statistically-significant interval changes in both the plasma and stool using the paradigm described in Figure 6B. Interval changes during both the “Abx/PEG intervention” and “Early Recovery” phases of the FARMM study for each of the three diets are shown. A) Amino acids, many purged from the gut and likely to be consumed by the gut microbiota upon early recovery. B) Amino acid and other nitrogen-based metabolites likely to be produced by the gut microbiota.*=Bacterially-produced amino acid metabolites described in(Dodd et al., 2017). Green=Interval increase in relative abundance. Orange=Interval decrease relative abundance. Orientation of the triangle symbol indicates whether the interval alteration in the metabolite was observed in the plasma or stool. HMBD annotations are provided for each metabolite.

References

    1. Baxter NT, Schmidt AW, Venkataraman A, Kim KS, Waldron C, and Schmidt TM (2019). Dynamics of Human Gut Microbiota and Short-Chain Fatty Acids in Response to Dietary Interventions with Three Fermentable Fibers. MBio 10(1). - PMC - PubMed
    1. Bolger AM, Lohse M, and Usadel B (2014). Trimmomatic: a flexible trimmer for Illumina sequence data. Bioinformatics 30(15), 2114–2120. - PMC - PubMed
    1. Brown JM, and Hazen SL (2017). Targeting of microbe-derived metabolites to improve human health: The next frontier for drug discovery. J Biol Chem 292(21), 8560–8568. - PMC - PubMed
    1. Buchfink B, Xie C, and Huson DH (2015). Fast and sensitive protein alignment using DIAMOND. Nat Methods 12(1), 59–60. - PubMed
    1. Cantarel BL, Lombard V, and Henrissat B (2012). Complex carbohydrate utilization by the healthy human microbiome. PLoS One 7(6), e28742. - PMC - PubMed

Publication types