

A Genetic Screen Identifies Etl4-Deficiency Capable of Stabilizing the Haploidy in Embryonic Stem Cells
- PMID: 33440180
- PMCID: PMC7815943
- DOI: 10.1016/j.stemcr.2020.11.016
A Genetic Screen Identifies Etl4-Deficiency Capable of Stabilizing the Haploidy in Embryonic Stem Cells
Abstract
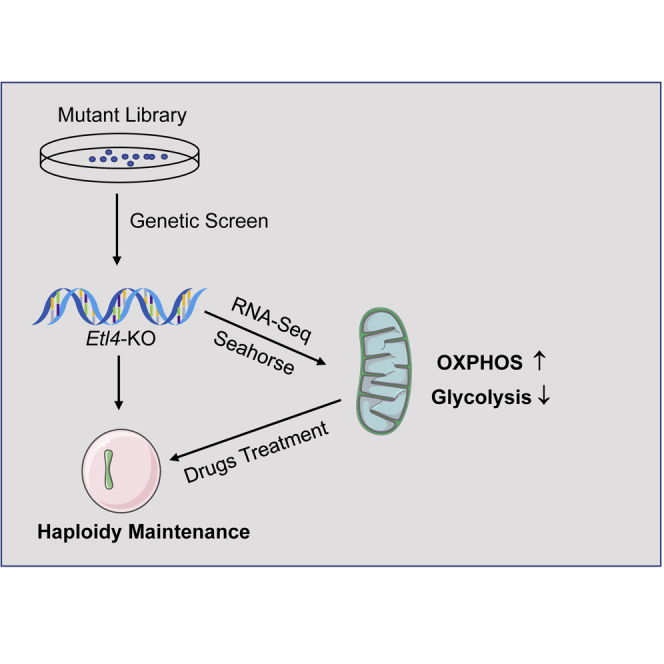
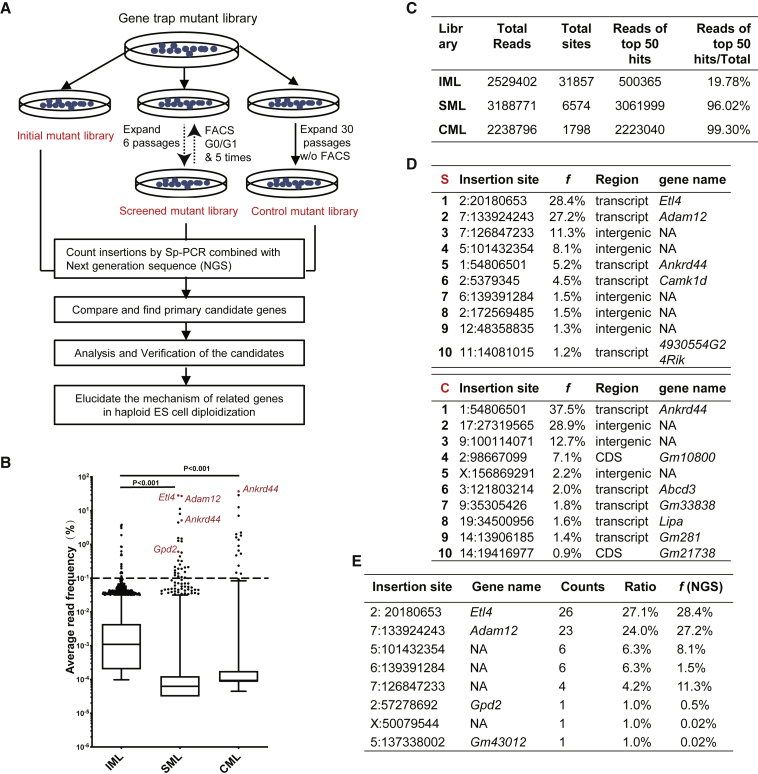
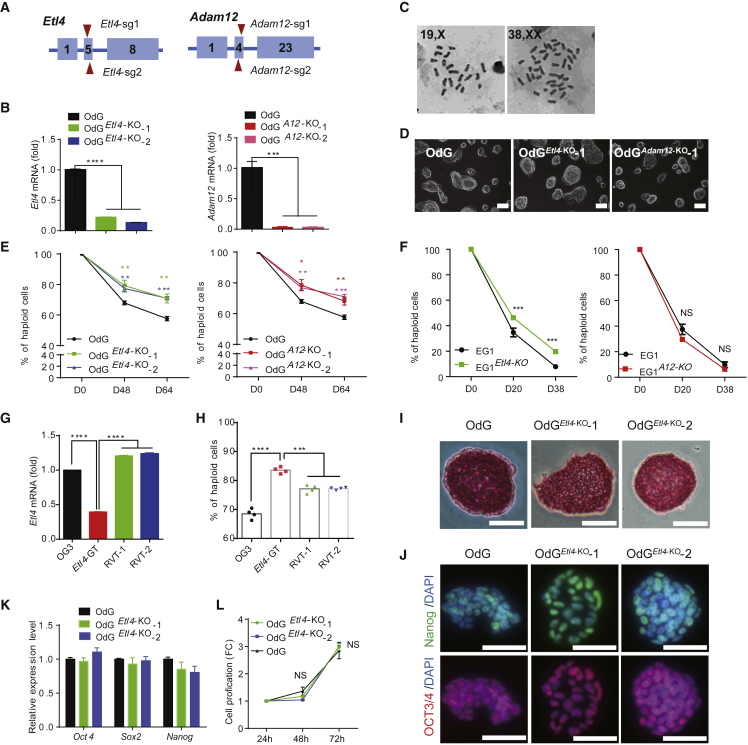
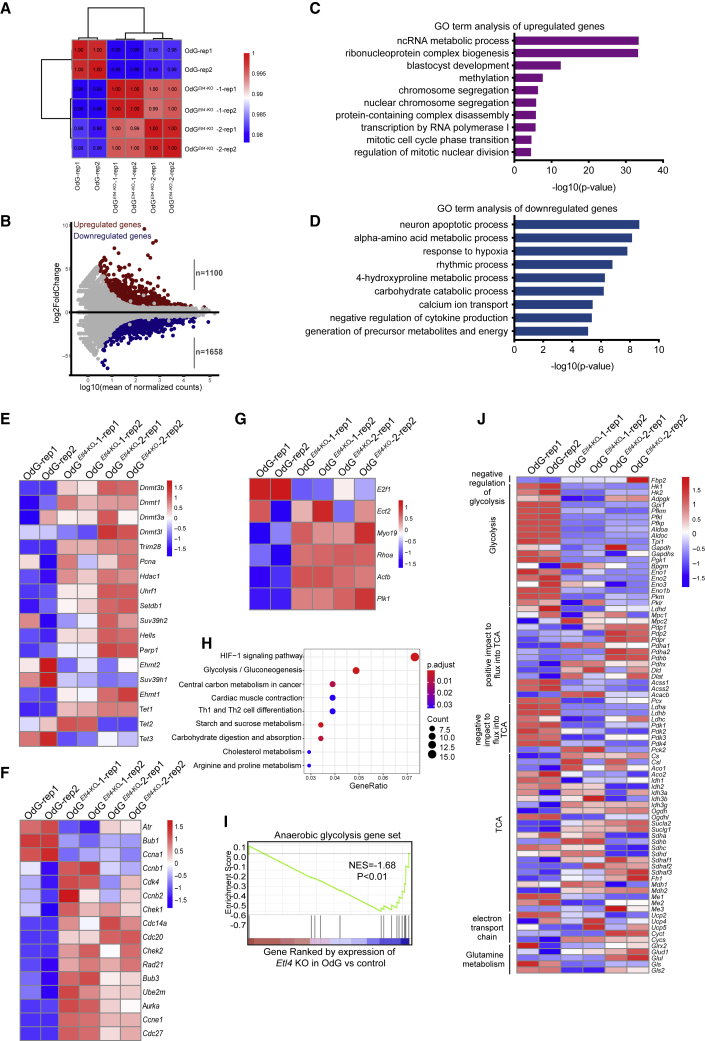
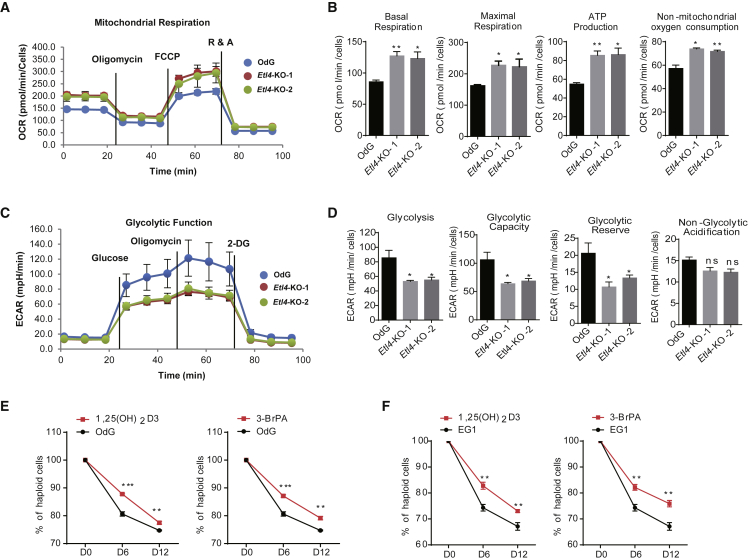
Mammalian haploid embryonic stem cells (haESCs) hold great promise for functional genetic studies and forward screening. However, all established haploid cells are prone to spontaneous diploidization during long-term culture, rendering application challenging. Here, we report a genome-wide loss-of-function screening that identified gene mutations that could significantly reduce the rate of self-diploidization in haESCs. We further demonstrated that CRISPR/Cas9-mediated Etl4 knockout (KO) stabilizes the haploid state in different haESC lines. More interestingly, Etl4 deficiency increases mitochondrial oxidative phosphorylation (OXPHOS) capacity and decreases glycolysis in haESCs. Mimicking this effect by regulating the energy metabolism with drugs decreased the rate of self-diploidization. Collectively, our study identified Etl4 as a novel haploidy-related factor linked to an energy metabolism transition occurring during self-diploidization of haESCs.
Keywords: Etl4; Pluripotent stem cell; energy metabolism; genetic screen; haploid embryonic stem cells; self-diploidization.
Copyright © 2020 The Authors. Published by Elsevier Inc. All rights reserved.
Figures
Similar articles
-
Haploid embryonic stem cells can be enriched and maintained by simple filtration.J Biol Chem. 2018 Apr 6;293(14):5230-5235. doi: 10.1074/jbc.RA118.002029. Epub 2018 Feb 15. J Biol Chem. 2018. PMID: 29449377 Free PMC article.
-
Inhibition of Apoptosis Reduces Diploidization of Haploid Mouse Embryonic Stem Cells during Differentiation.Stem Cell Reports. 2020 Jul 14;15(1):185-197. doi: 10.1016/j.stemcr.2020.05.004. Epub 2020 Jun 4. Stem Cell Reports. 2020. PMID: 32502463 Free PMC article.
-
Mammalian haploid stem cells: establishment, engineering and applications.Cell Mol Life Sci. 2019 Jun;76(12):2349-2367. doi: 10.1007/s00018-019-03069-6. Epub 2019 Mar 19. Cell Mol Life Sci. 2019. PMID: 30888429 Free PMC article. Review.
-
Stabilization of mouse haploid embryonic stem cells with combined kinase and signal modulation.Sci Rep. 2017 Oct 16;7(1):13222. doi: 10.1038/s41598-017-13471-4. Sci Rep. 2017. PMID: 29038567 Free PMC article.
-
Generation and application of mammalian haploid embryonic stem cells.J Intern Med. 2016 Sep;280(3):236-45. doi: 10.1111/joim.12503. Epub 2016 May 3. J Intern Med. 2016. PMID: 27138065 Review.
Cited by
-
Transcriptome profiles and chromatin states in mouse androgenetic haploid embryonic stem cells.Cell Prolif. 2023 Sep;56(9):e13436. doi: 10.1111/cpr.13436. Epub 2023 Mar 1. Cell Prolif. 2023. PMID: 36855927 Free PMC article.
-
BNIP3-mediated mitophagy boosts the competitive growth of Lenvatinib-resistant cells via energy metabolism reprogramming in HCC.Cell Death Dis. 2024 Jul 5;15(7):484. doi: 10.1038/s41419-024-06870-9. Cell Death Dis. 2024. PMID: 38969639 Free PMC article.
-
Development and application of haploid embryonic stem cells.Stem Cell Res Ther. 2024 Apr 23;15(1):116. doi: 10.1186/s13287-024-03727-y. Stem Cell Res Ther. 2024. PMID: 38654389 Free PMC article. Review.
-
BCL2 is a major regulator of haploidy maintenance in murine embryonic stem cells.Cell Prolif. 2023 Dec;56(12):e13498. doi: 10.1111/cpr.13498. Epub 2023 May 5. Cell Prolif. 2023. PMID: 37144356 Free PMC article.
-
Applications of piggyBac Transposons for Genome Manipulation in Stem Cells.Stem Cells Int. 2021 Sep 14;2021:3829286. doi: 10.1155/2021/3829286. eCollection 2021. Stem Cells Int. 2021. PMID: 34567130 Free PMC article. Review.
References
-
- Arreaza G., Deutsch D.G. Deletion of a proline-rich region and a transmembrane domain in fatty acid amide hydrolase. FEBS Lett. 1999;454:57–60. - PubMed
Publication types
MeSH terms
Substances
LinkOut - more resources
Full Text Sources
Other Literature Sources
Molecular Biology Databases
Research Materials
