. 2021 Jan 11;21(2):455.
doi: 10.3390/s21020455.

Explainable COVID-19 Detection Using Chest CT Scans and Deep Learning

Affiliations

Explainable COVID-19 Detection Using Chest CT Scans and Deep Learning

Hammam Alshazly et al. Sensors (Basel). .

Abstract

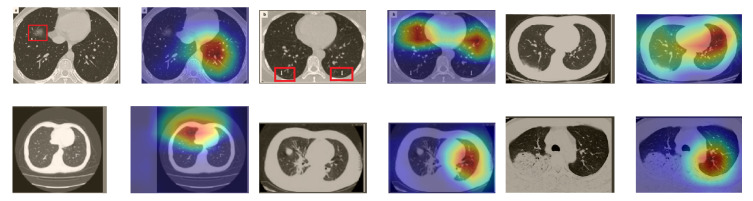
This paper explores how well deep learning models trained on chest CT images can diagnose COVID-19 infected people in a fast and automated process. To this end, we adopted advanced deep network architectures and proposed a transfer learning strategy using custom-sized input tailored for each deep architecture to achieve the best performance. We conducted extensive sets of experiments on two CT image datasets, namely, the SARS-CoV-2 CT-scan and the COVID19-CT. The results show superior performances for our models compared with previous studies. Our best models achieved average accuracy, precision, sensitivity, specificity, and F1-score values of 99.4%, 99.6%, 99.8%, 99.6%, and 99.4% on the SARS-CoV-2 dataset, and 92.9%, 91.3%, 93.7%, 92.2%, and 92.5% on the COVID19-CT dataset, respectively. For better interpretability of the results, we applied visualization techniques to provide visual explanations for the models' predictions. Feature visualizations of the learned features show well-separated clusters representing CT images of COVID-19 and non-COVID-19 cases. Moreover, the visualizations indicate that our models are not only capable of identifying COVID-19 cases but also provide accurate localization of the COVID-19-associated regions, as indicated by well-trained radiologists.

Keywords: COVID-19 detection; SARS-CoV-2; coronavirus; explainable deep learning; feature visualization.


Conflict of interest statement

The authors declare no conflict of interest.

Figures

Figure 1
Figure 1
The fire module used in SqueezeNet.
Figure 2
Figure 2
A variant of the Inception module used in InceptionV3 architecture.
Figure 3
Figure 3
The basic residual module used in ResNet18 (a), and the bottleneck residual module utilized in ResNet50 and ResNet101 (b), both as introduced in [43].
Figure 4
Figure 4
A basic ResNeXt block with cardinality of 32 as proposed in [44].
Figure 5
Figure 5
The building unit of the ShuffleNet architecture.
Figure 6
Figure 6
A 3-layer Dense block in DenseNet. The input to each layer is all the previous feature maps.
Figure 7
Figure 7
Examples of chest CT scans from the SARS-CoV-2 CT dataset. The first row represents CT scans diagnosed with COVID-19, whereas the second row represents non-COVID-19.
Figure 8
Figure 8
Examples of chest CT images from the COVID19-CT dataset. The first row represents CT images diagnosed with COVID-19, whereas the second row represents non-COVID-19 cases, but other lung diseases.
Figure 9
Figure 9
Confusion matrices for the different deep CNN models. These results are the average counts of the five models obtained by stratified 5-fold cross-validation on the SARS-CoV-2 CT dataset.
Figure 10
Figure 10
Confusion matrices for the different deep CNN models. These results are the average counts of the five models obtained by stratified 5-fold cross-validation on the COVID19-CT dataset.
Figure 11
Figure 11
Visualization of the t-SNE embeddings for the entire SARS-CoV-2 CT dataset. We clearly see two different clusters representing COVID-19 (red for training and blue for test samples) and non-COVID-19 (yellow for train and green for test samples) classes.
Figure 12
Figure 12
Visualization of the t-SNE embeddings for the entire COVID-19 CT dataset. As in Figure 11, we can see two different clusters representing COVID-19 and non-COVID-19 classes.
Figure 13
Figure 13
Grad-CAM visualizations for examples of CT images from the SARS-CoV-2 dataset. Our InceptionV3 model correctly classified them as COVID-19 and localized the most relevant regions used for its decision. The first, third, and fifth columns show CT images with COVID-19 findings, whereas the second, fourth, and sixth columns represent their corresponding localization maps generated by Grad-CAM.
Figure 14
Figure 14
Grad-CAM visualizations for sample CT images from the COVID19-CT dataset. Our DenseNet169 model correctly classified them as COVID-19 cases and highlighted the most relevant regions, as shown in the corresponding localization maps.
Figure 15
Figure 15
Examples of CT images taken from these two publications [61,62]. The CT images were correctly classified as COVID-19 cases, and the abnormal regions are accurately detected as in the localization maps.
Figure 16
Figure 16
Grad-CAM visualizations for the same CT images in the first two rows of Figure 15. The CT images were correctly identified by SqueezeNet as COVID-19 cases with relevant localization of the disease-related regions.
Figure 17
Figure 17
Example of annotated CT scans with different manifestations of COVID-19 taken from [61], and their corresponding localization maps. Our models were able to identify them as COVID-19 cases and accurately localize their COVID-19-associated regions.
Figure 18
Figure 18
CT scans and their Grad-CAM localization maps showing cases in which the model failed to localize the most relevant COVID-19 regions.

References

    1. Liu J., Liao X., Qian S., Yuan J., Wang F., Liu Y., Wang Z., Wang F.S., Liu L., Zhang Z. Community transmission of severe acute respiratory syndrome coronavirus 2, Shenzhen, China, 2020. Emerg. Infect. Dis. 2020;26:1320–1323. doi: 10.3201/eid2606.200239. - DOI - PMC - PubMed
    1. Ghinai I., McPherson T.D., Hunter J.C., Kirking H.L., Christiansen D., Joshi K., Rubin R., Morales-Estrada S., Black S.R., Pacilli M., et al. First known person-to-person transmission of severe acute respiratory syndrome coronavirus 2 (SARS-CoV-2) in the USA. Lancet. 2020;395:1137–1144. doi: 10.1016/S0140-6736(20)30607-3. - DOI - PMC - PubMed
    1. Chen N., Zhou M., Dong X., Qu J., Gong F., Han Y., Qiu Y., Wang J., Liu Y., Wei Y., et al. Epidemiological and clinical characteristics of 99 cases of 2019 novel coronavirus pneumonia in Wuhan, China: A descriptive study. Lancet. 2020;395:507–513. doi: 10.1016/S0140-6736(20)30211-7. - DOI - PMC - PubMed
    1. Long C., Xu H., Shen Q., Zhang X., Fan B., Wang C., Zeng B., Li Z., Li X., Li H. Diagnosis of the Coronavirus disease (COVID-19): RRT-PCR or CT? Eur. J. Radiol. 2020;126:108961. doi: 10.1016/j.ejrad.2020.108961. - DOI - PMC - PubMed
    1. Fang Y., Zhang H., Xie J., Lin M., Ying L., Pang P., Ji W. Sensitivity of chest CT for COVID-19: Comparison to RT-PCR. Radiology. 2020;296:200432. doi: 10.1148/radiol.2020200432. - DOI - PMC - PubMed