. 2021 Jan 11;13(1):92.
doi: 10.3390/v13010092.

Analysis of the Immune Responses in the Ileum of Gnotobiotic Pigs Infected with the Recombinant GII.p12_GII.3 Human Norovirus by mRNA Sequencing

Affiliations

Analysis of the Immune Responses in the Ileum of Gnotobiotic Pigs Infected with the Recombinant GII.p12_GII.3 Human Norovirus by mRNA Sequencing

Byung-Joo Park et al. Viruses. .

Abstract

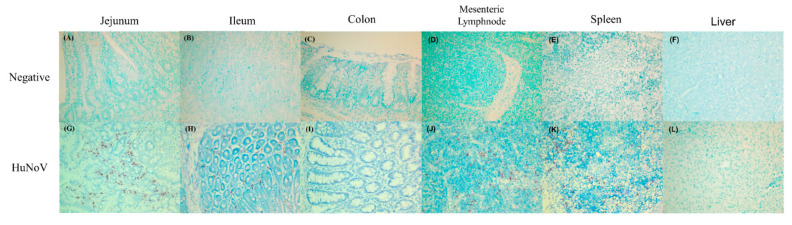
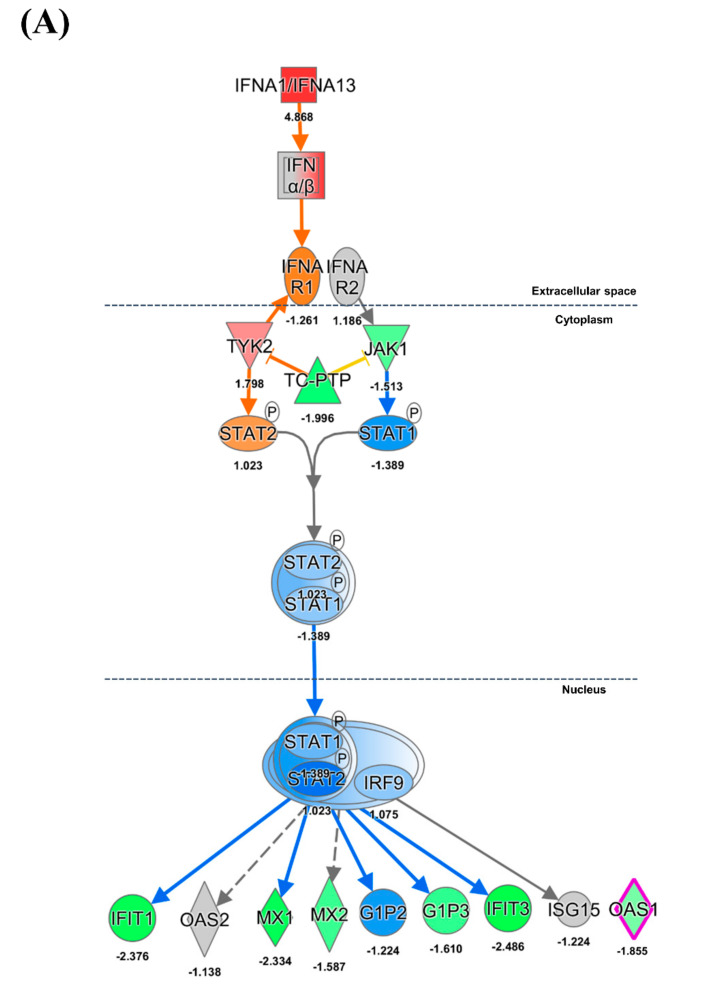
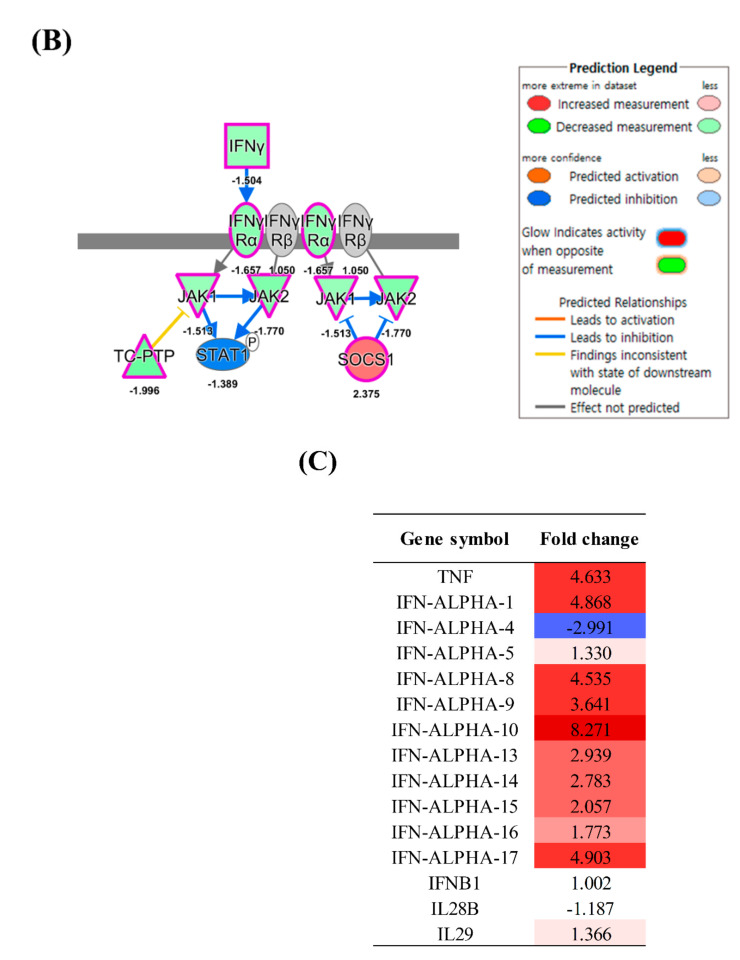
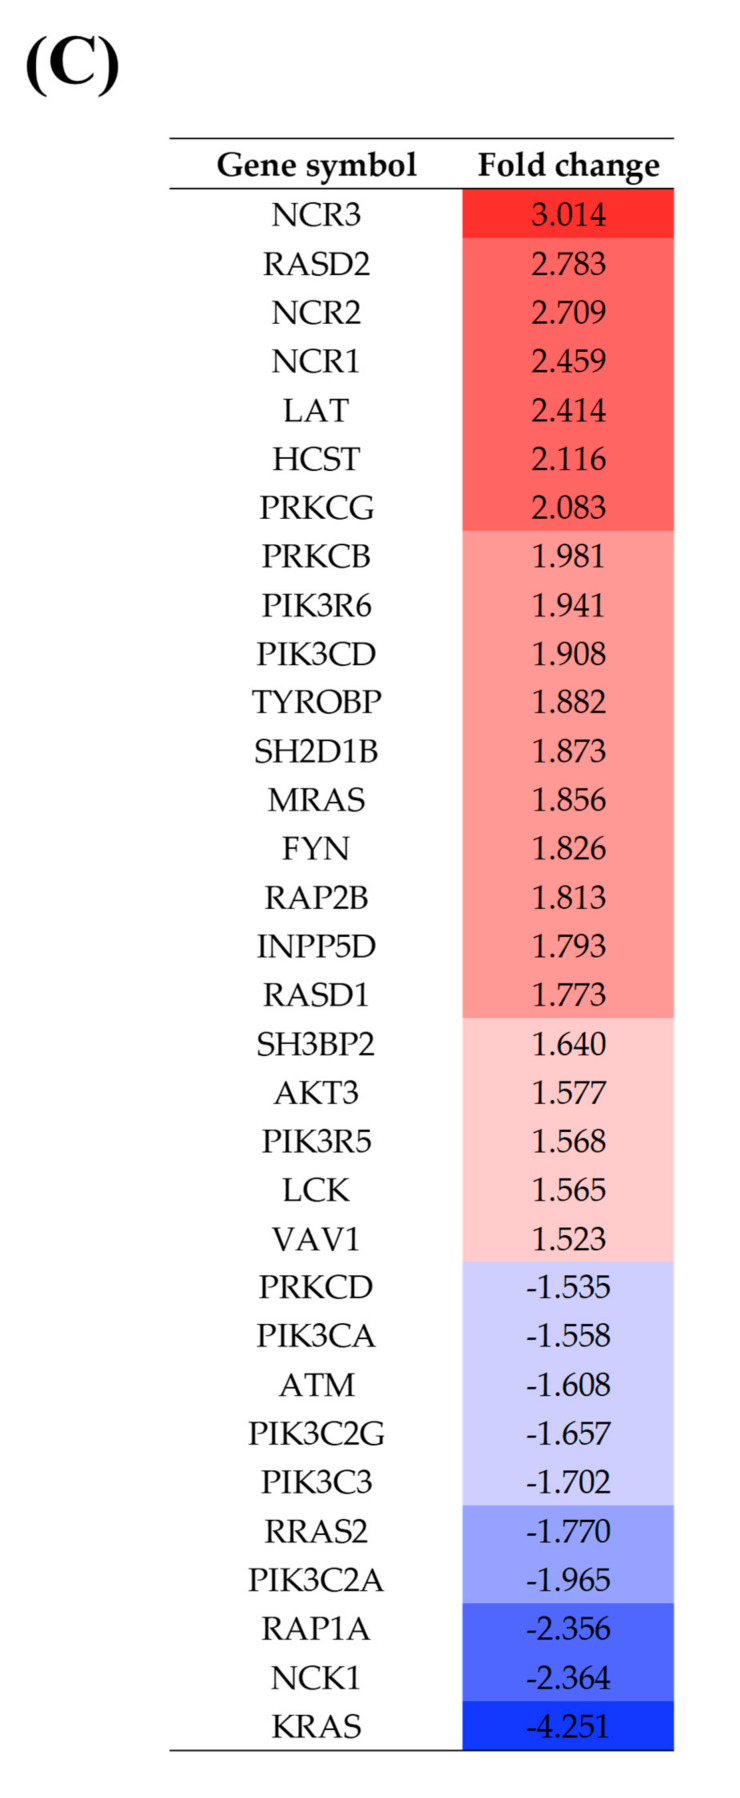
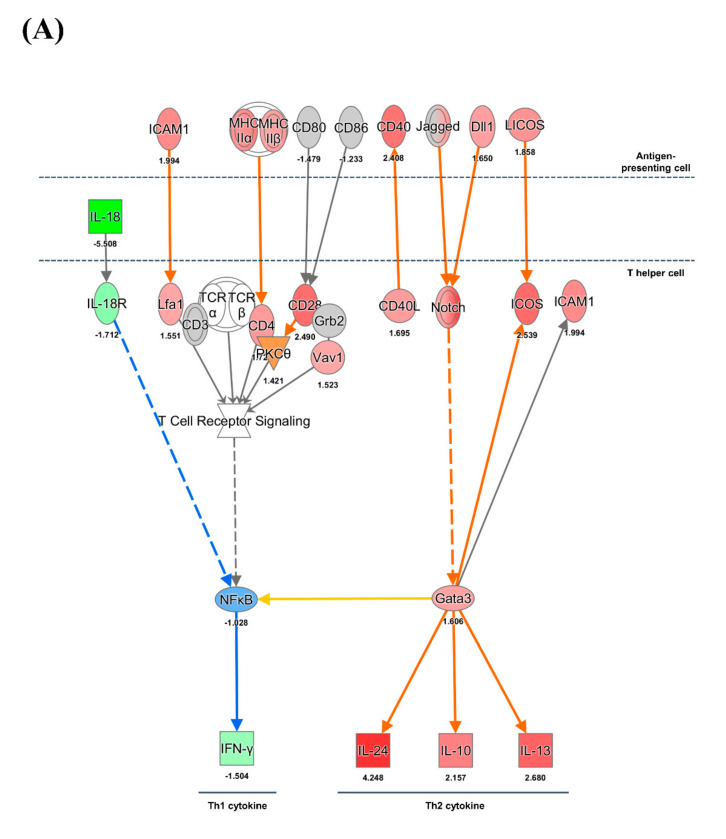
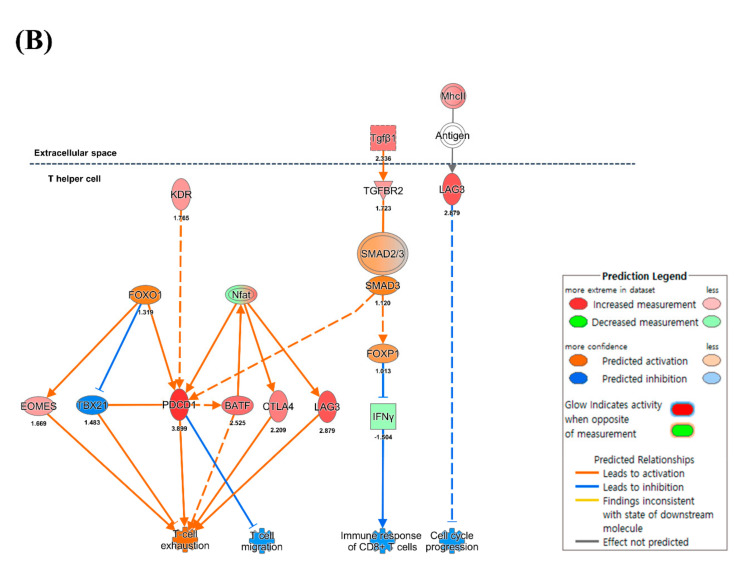
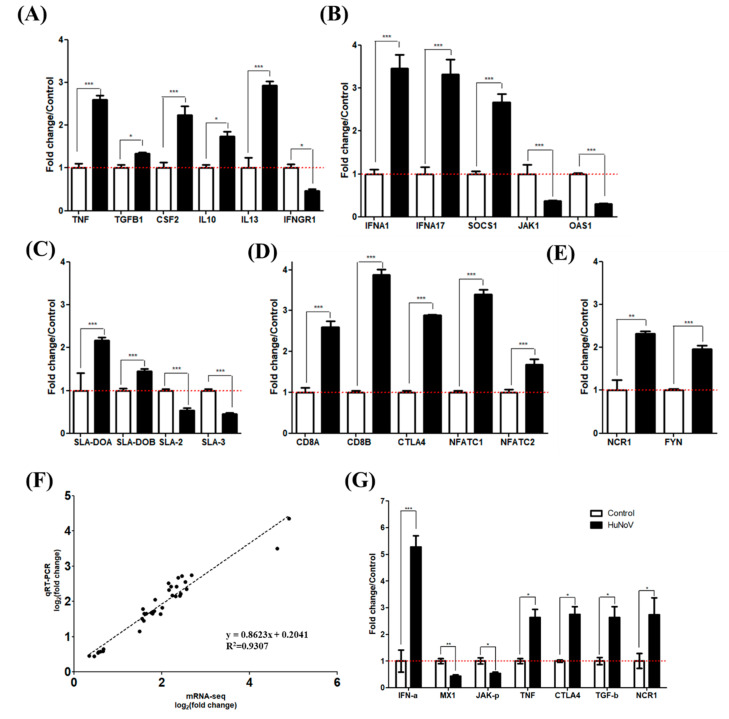
Norovirus genogroup II (NoV GII) induces acute gastrointestinal food-borne illness in humans. Because gnotobiotic pigs can be infected with human norovirus (HuNoV) GII, they are frequently used to analyze the associated pathogenic mechanisms and immune responses, which remain poorly understood. Recently, mRNA sequencing analysis (RNA-Seq) has been used to identify cellular responses to viruses. In this study, we investigated the host immune response and possible mechanisms involved in virus evasion in the ileum of gnotobiotic pigs infected with HuNoV by RNA-Seq. HuNoV was detected in the feces, blood, and tissues of the jejunum, ileum, colon, mesenteric lymph node, and spleen of pigs infected with HuNoV. In analysis of mRNA sequencing, expression of anti-viral protein genes such as OAS1, MX1, and MX2 were largely decreased, whereas type I IFN was increased in pigs infected with HuNoV. In addition, expression of TNF and associated anti-inflammatory cytokine genes such as IL10 was increased in HuNoV-infected pigs. Expression of genes related to natural killer (NK) cell cytotoxicity and CD8+ T cell exhaustion was increased, whereas that of MHC class I genes was decreased. Expression profiles of selected genes were further confirmed by qRT-PCR and Western blot. These results suggest that infection with HuNoV induces NK cell-mediated cytotoxicity but suppresses type I IFN- and CD8+ T cell-mediated antiviral responses.

Keywords: gnotobiotic pig; high-throughput mRNA sequencing; human norovirus; immune response.


Conflict of interest statement

The authors declare no conflict of interest.

Figures

Figure 1
Figure 1
Detection of HuNoV RNA in tissues of gnotobiotic pigs by in situ hybridization. The viral RNA was determined by in situ hybridization for the (AF) negative control pigs, (GL) pigs infected with HuNoV. NoV-positive cells are stained as red colors in the cytoplasm of cells. Magnification ×200.
Figure 2
Figure 2
Ingenuity pathway analysis of type I and II interferon pathway genes in the HuNoV-infected group. The pathways of (A) type I IFN and (B) type II IFN were analyzed using mRNA profiles of pigs infected with HuNoV compared with those of negative control pigs. (C) Fold change expression values of TNF, IFN-α, IFN-β, and IFN-λ in pigs infected with HuNoV. The fold change of gene expression was indicated by colors in Table S4.
Figure 2
Figure 2
Ingenuity pathway analysis of type I and II interferon pathway genes in the HuNoV-infected group. The pathways of (A) type I IFN and (B) type II IFN were analyzed using mRNA profiles of pigs infected with HuNoV compared with those of negative control pigs. (C) Fold change expression values of TNF, IFN-α, IFN-β, and IFN-λ in pigs infected with HuNoV. The fold change of gene expression was indicated by colors in Table S4.
Figure 3
Figure 3
Ingenuity pathway analysis of genes associated with NK cell activation in the HuNoV-infected group. The (A) DC and NK cell interaction and (B) NK cell activation pathway were analyzed using mRNA profiles of pigs infected with HuNoV compared with those of negative control pigs. (C) Fold change expression values of NK cell-related genes in pigs infected with HuNoV. The fold change of gene expression was indicated by colors in Table S4.
Figure 3
Figure 3
Ingenuity pathway analysis of genes associated with NK cell activation in the HuNoV-infected group. The (A) DC and NK cell interaction and (B) NK cell activation pathway were analyzed using mRNA profiles of pigs infected with HuNoV compared with those of negative control pigs. (C) Fold change expression values of NK cell-related genes in pigs infected with HuNoV. The fold change of gene expression was indicated by colors in Table S4.
Figure 4
Figure 4
Ingenuity pathway analysis of genes associated with T cell immune response in the HuNoV-infected group. The (A) Th1/2 type immune response and (B) cytotoxic T cell exhaustion pathway were analyzed using mRNA profiles of pigs infected with HuNoV compared with those of negative control pigs. (C) Fold change expression values of MHC I and II in pigs infected with HuNoV. The fold change of gene expression was indicated by colors in Table S4.
Figure 4
Figure 4
Ingenuity pathway analysis of genes associated with T cell immune response in the HuNoV-infected group. The (A) Th1/2 type immune response and (B) cytotoxic T cell exhaustion pathway were analyzed using mRNA profiles of pigs infected with HuNoV compared with those of negative control pigs. (C) Fold change expression values of MHC I and II in pigs infected with HuNoV. The fold change of gene expression was indicated by colors in Table S4.
Figure 5
Figure 5
Evaluation of mRNA sequencing data by qRT-PCR and Western blot. The expression levels of genes associated with (A) cytokines, (B) innate immune response, (C) MHC molecules, (D) CD8+ cell exhaustion, and (E) NK cell activation in HuNoV-infected pigs (black) were compared with those of negative control pigs (white). (F) Correlation graph and trend line of evaluated genes between mRNA sequencing and qRT-PCR. The trend line expression was y = 0.8623x + 0.2041 and the R-squared value was 0.93. (G) Quantitation of Western blot analysis was performed using ImageJ. *** p < 0.001, ** p < 0.01, * p < 0.05.
Figure 6
Figure 6
Summary of the immune response in pigs infected with HuNoV with regard to inflammation, type I and II interferon pathways, NK cells, and T cell immune response. Inhibition of the expression of antiviral genes was observed, whereas the TLR and IFN-α genes were increased in the HuNoV-infected cells. Decreased expression of MHC I and IFN-γ genes and elevated expression of genes associated with T cell exhaustion strongly suggest that antiviral activity of cytotoxic T cells is suppressed by the viral infection. On the other hand, the elevation of NCR genes related to NK cell activation suggests that NK cells are critically involved in the control of norovirus in early period of infection.

Similar articles

Cited by

References

    1. Robilotti E., Deresinski S., Pinsky B.A. Norovirus. Clin. Microbiol. Rev. 2015;28:134–164. doi: 10.1128/CMR.00075-14. - DOI - PMC - PubMed
    1. Hall A.J., Lopman B.A., Payne D.C., Patel M.M., Gastañaduy P.A., Vinjé J., Parashar U.D. Norovirus disease in the United States. Emerg. Infect. Dis. 2013;19:1198. doi: 10.3201/eid1908.130465. - DOI - PMC - PubMed
    1. Vinjé J. Advances in laboratory methods for detection and typing of norovirus. J. Clin. Microbiol. 2015;53:373–381. doi: 10.1128/JCM.01535-14. - DOI - PMC - PubMed
    1. Chhabra P., de Graaf M., Parra G.I., Chan M.C.-W., Green K., Martella V., Wang Q., White P.A., Katayama K., Vennema H. Updated classification of norovirus genogroups and genotypes. J. Gen. Virol. 2019;100:1393. doi: 10.1099/jgv.0.001318. - DOI - PMC - PubMed
    1. Siebenga J.J., Lemey P., Pond S.L.K., Rambaut A., Vennema H., Koopmans M. Phylodynamic reconstruction reveals norovirus GII. 4 epidemic expansions and their molecular determinants. PLoS Pathog. 2010;6:e1000884. doi: 10.1371/journal.ppat.1000884. - DOI - PMC - PubMed

Publication types

MeSH terms