. 2021 Jan 13;13(1):7.
doi: 10.1186/s13073-020-00823-5.

Disease severity-specific neutrophil signatures in blood transcriptomes stratify COVID-19 patients

Collaborators, Affiliations

Disease severity-specific neutrophil signatures in blood transcriptomes stratify COVID-19 patients

Anna C Aschenbrenner et al. Genome Med. .

Abstract

Background: The SARS-CoV-2 pandemic is currently leading to increasing numbers of COVID-19 patients all over the world. Clinical presentations range from asymptomatic, mild respiratory tract infection, to severe cases with acute respiratory distress syndrome, respiratory failure, and death. Reports on a dysregulated immune system in the severe cases call for a better characterization and understanding of the changes in the immune system.

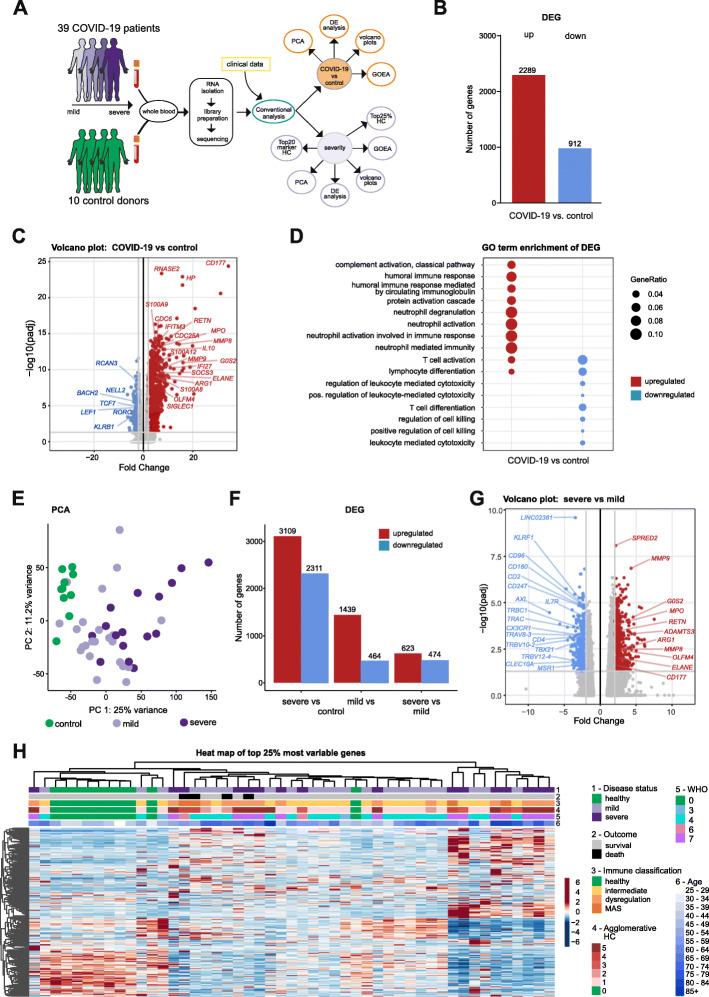
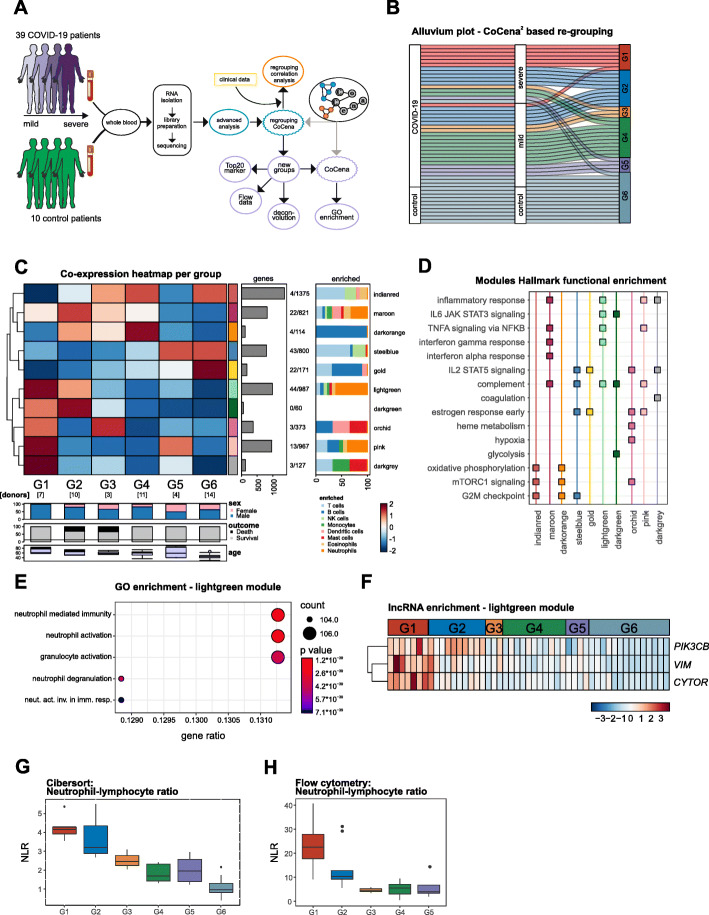
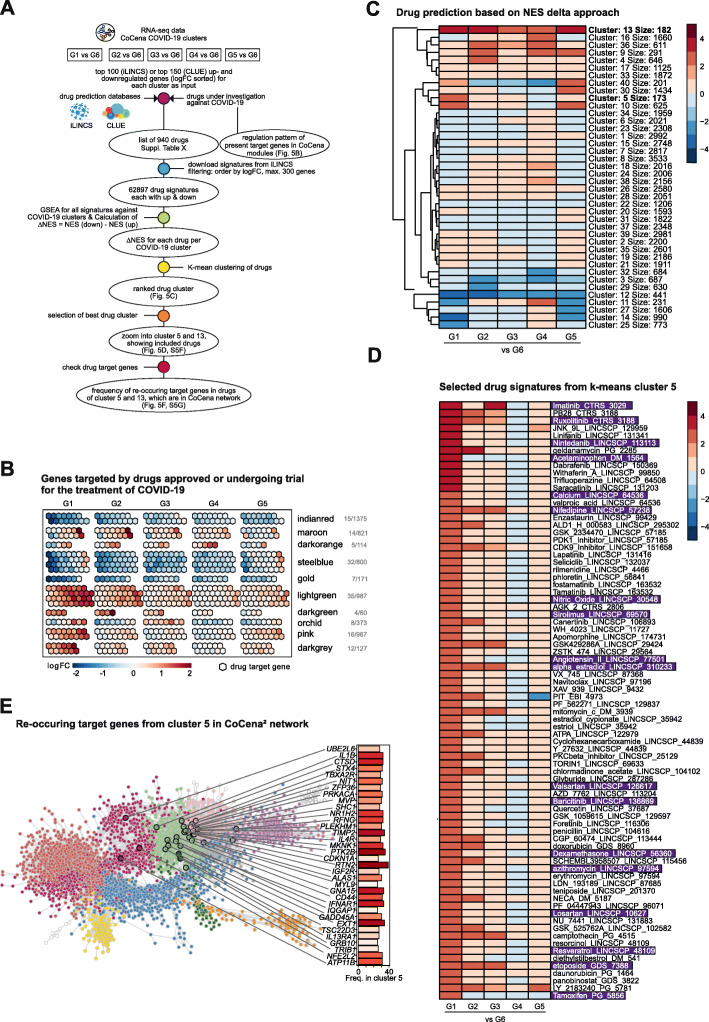
Methods: In order to dissect COVID-19-driven immune host responses, we performed RNA-seq of whole blood cell transcriptomes and granulocyte preparations from mild and severe COVID-19 patients and analyzed the data using a combination of conventional and data-driven co-expression analysis. Additionally, publicly available data was used to show the distinction from COVID-19 to other diseases. Reverse drug target prediction was used to identify known or novel drug candidates based on finding from data-driven findings.

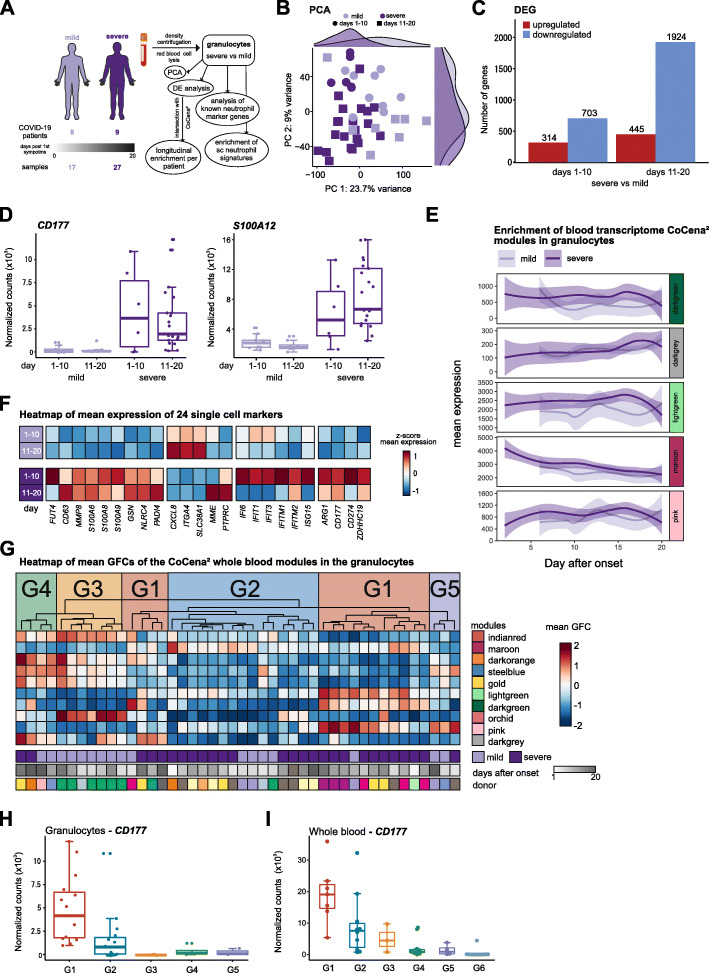
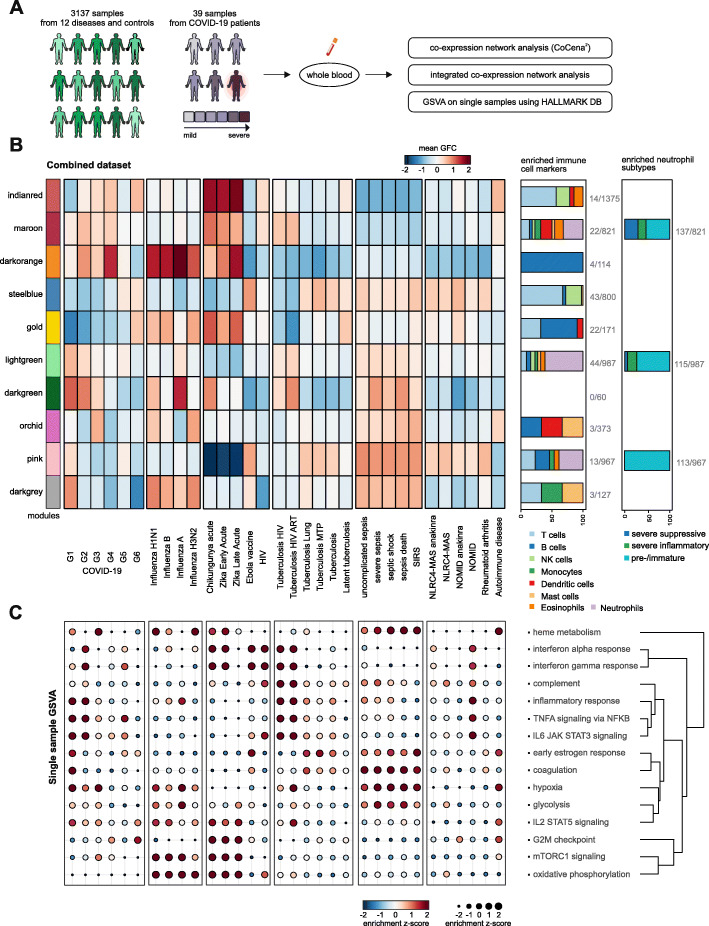
Results: Here, we profiled whole blood transcriptomes of 39 COVID-19 patients and 10 control donors enabling a data-driven stratification based on molecular phenotype. Neutrophil activation-associated signatures were prominently enriched in severe patient groups, which was corroborated in whole blood transcriptomes from an independent second cohort of 30 as well as in granulocyte samples from a third cohort of 16 COVID-19 patients (44 samples). Comparison of COVID-19 blood transcriptomes with those of a collection of over 3100 samples derived from 12 different viral infections, inflammatory diseases, and independent control samples revealed highly specific transcriptome signatures for COVID-19. Further, stratified transcriptomes predicted patient subgroup-specific drug candidates targeting the dysregulated systemic immune response of the host.

Conclusions: Our study provides novel insights in the distinct molecular subgroups or phenotypes that are not simply explained by clinical parameters. We show that whole blood transcriptomes are extremely informative for COVID-19 since they capture granulocytes which are major drivers of disease severity.

Keywords: Blood transcriptomics; COVID-19; Co-expression analysis; Drug repurposing; Granulocytes; Molecular disease phenotypes; Neutrophils; Stratification; Transcriptome.


Conflict of interest statement

EJG-B has received honoraria (paid to the University of Athens) from AbbVie USA, Abbott CH, Angelini Italy, Biotest Germany, InflaRx GmbH, MSD Greece, and XBiotech Inc. He has received independent educational grants from AbbVie, Abbott, Astellas Pharma, AxisShield, bioMérieux Inc., InflaRx GmbH, and XBiotech Inc.

The remaining authors declare that they have no competing interests.

Figures

Fig. 1
Fig. 1
Whole blood transcriptomes reveal diversity of COVID-19 patients not explained by disease severity. a Schematic workflow for analysis of whole blood transcriptome data. b Number of significantly upregulated (red) and downregulated (blue) genes (FC > |2|, FDR-adj. p value < 0.05) comparing COVID-19 and control samples. c Volcano plot depicting fold changes (FC) and FDR-adjusted p values comparing COVID-19 and control samples. Differentially expressed up- (red) and downregulated genes (blue) are shown and selected genes are highlighted. d Plot of top 10 most enriched GO terms for significantly up- and downregulated genes, showing ratio of significantly regulated genes within enriched GO terms (GeneRatio). e PCA plot depicting relationship of all samples based on dynamic gene expression of all genes comparing mild and severe COVID-19 as well as control samples. f Number of significantly upregulated (red) and downregulated (blue) genes (FC > |2|, FDR-adj. p value < 0.05) comparing mild and severe COVID-19 as well as control samples. g Volcano plot depicting fold changes and FDR-adjusted p values comparing mild and severe COVID-19 as well as control samples. Differentially expressed up- (red) and downregulated genes (blue) are shown and selected genes are highlighted. h Hierarchical clustering map of 25% most variable genes between control patients and COVID-19 mild or severe patients, with additional annotation of disease outcome, hierarchical agglomerative clustering of clinical parameters COVID-19, the groups defined by agglomerative clustering, WHO ordinal score, and age bins
Fig. 2
Fig. 2
Co-expression analysis discloses COVID-19 subgroups with distinct molecular signatures. a Schematic overview of the analysis performed on the whole blood samples. b Alluvium plot visualizing the distribution of the samples according to different grouping; disease status, severity, and data-driven sample groups. c Group fold change heat map and hierarchical clustering for the six data-driven sample groups and the gene modules identified byCoCena2 analysis. d Functional enrichment of CoCena2-derived modules using the Hallmark gene set database. Selected top terms were visualized. e Functional enrichment of CoCena2 module lightgreen using GO gene set database. Top 5 terms were visualized. f Heat map presenting the normalized expression values of the lncRNA CYTOR, and protein-coding RNAs PIK3CB and VIM from the lightgreen CoCena2 module. g Neutrophil-lymphocyte ratio plot after cell type deconvolution at lineage level. h Neutrophil-lymphocyte ratio across the six data-driven sample groups. Box plots show median with variance, with lower and upper hinges representing the 25th and 75th percentile, respectively
Fig. 3
Fig. 3
Granulocytes from severe COVID-19 patients show a simultaneous increase in inflammatory and suppressive signatures. a Schema of sample processing and analysis. b PCA of all genes within the dataset mapped by COVID-19 severity status. c Bar plot of DEGs between severe and mild COVID-19 patients at day 1–10 (left) and day 11–20 (right) (FC > |2|, FDR-adj. p value < 0.05). d Boxplot of CD177 (left) and S100A12 (right) in mild and severe COVID-19 patients at day 1–10 and 11–20. e Mean of group fold changes (GFCs) of the modules darkgreen, darkgrey, lightgreen, maroon, and pink in the granulocyte samples of mild (light purple) and severe (purple) COVID-19 cases over time. f Heat map of mean expression of 24 markers in mild (top) and severe (bottom) patients ordered by days after disease onset bins (day 1–10 and 11–20). g Heat map of mean GFCs of the CoCena2 whole blood modules in the granulocyte samples from each individual patient. Patients are clusters by the mean GFC module expression. Severity patterns found in the whole blood CoCena2 network were identified and patient groups were assigned accordingly (G1–G5). h Box plot of CD177 expression in granulocytes grouped by G1–G5. i Box plot of CD177 expression in whole blood grouped by G1–G6
Fig. 4
Fig. 4
Integration with signatures from other diseases reveals COVID-19-specific characteristics. a Schema of analysis of the integrated dataset. The integrated dataset was analyzed with regard to expression patterns of the clusters previously identified in the whole blood COVID-19-specific co-expression network. b Heat map of mean group fold changes of CoCena2 module comparison between COVID-19 and other diseases. From left to right, the diseases are ordered by category (COVID-19, viral infections, bacterial infections, and others). On the right side of the heat map, the first box plot shows the enriched immune cell markers in each module. The second box plot shows the enrichment of genes upregulated in specific neutrophil subtypes based on cross-referencing with single-cell data [34]. Both box plots show enriched cell types in percent of total hits; absolute hits with respect to cluster size are stated aside. c Gene set variation analysis was conducted for every single patient based on Hallmark gene sets as shown in Fig. 2d. The result was standardized to retrieve the z-scores; a disease mean was calculated and displayed as a dot plot with size and color correlating to the z-score. The labels on the x-axis are the same as in b
Fig. 5
Fig. 5
Patient subgroup-specific signatures can be used to predict potential drug targets. a Schematic workflow of the drug prediction analysis. Drug signatures were collected using the platforms iLINCS and CLUE. Signatures were selected by highest counteracting ΔNES score and combined with signatures of drugs under investigation from the literature. b Visualization of genes targeted by drugs approved or undergoing trial for the treatment of COVID-19 patients included in the whole blood co-expression network. Numbers of such genes from each module are designated on the right of the panel. Genes are represented as hexagons and colored by the expression fold change between COVID-19 patient severity group (G1–G5) and the control group (G6) (upregulated: red, downregulated: blue, not regulated: grey). c Drug predictions based on ΔNES score of drug signatures in regard to diseased patient group-specific gene expression patterns (G1–5 vs G6). Signatures were clustered by k-means clustering. A high ΔNES score accounts for drug signatures which counteract the gene expression of the patient group they are compared to. Drug signatures with a negative ΔNES score induce a gene expression pattern similar to the input. The number of signatures within a cluster determines its size. d Display of selected drug signatures from k-means cluster 5 from c showing the highest ΔNES score in the most severe COVID-19 patient group G1 and the least effect in patient group G4. e Visualization of recurring target genes in the G1 vs G6 comparison of cluster 5 signatures and their frequency mapped onto the CoCena2 network

References

    1. Grubaugh ND, Petrone ME, Holmes EC. We shouldn’t worry when a virus mutates during disease outbreaks. Nat Microbiol. 2020;5(4):529–530. - PMC - PubMed
    1. Fauver JR, Petrone ME, Hodcroft EB, Shioda K, Ehrlich HY, Watts AG, et al. Coast-to-coast spread of SARS-CoV-2 during the early epidemic in the United States. Cell. 2020;181(5):990–996.e5. - PMC - PubMed
    1. Zhou P, Yang X Lou, Wang XG, Hu B, Zhang L, Zhang W, et al. A pneumonia outbreak associated with a new coronavirus of probable bat origin. Nature. 2020;579(7798):270–3. - PMC - PubMed
    1. Brignola C, Campieri M, Farruggia P, Tragnone A, Pasquali S, Iannone P, et al. The possible utility of steroids in the prevention of relapses of Crohn’s disease in remission: a preliminary study. J Clin Gastroenterol. 1988;10(6):631–4. - PubMed
    1. Guan W, Ni Z, Hu Y, Liang W, Ou C, He J, et al. Clinical characteristics of coronavirus disease 2019 in China. N Engl J Med. 2020;382(18):1708–20. - PMC - PubMed

Publication types