Clinical laboratory test-wide association scan of polygenic scores identifies biomarkers of complex disease
- PMID: 33441150
- PMCID: PMC7807864
- DOI: 10.1186/s13073-020-00820-8
Clinical laboratory test-wide association scan of polygenic scores identifies biomarkers of complex disease
Abstract
Background: Clinical laboratory (lab) tests are used in clinical practice to diagnose, treat, and monitor disease conditions. Test results are stored in electronic health records (EHRs), and a growing number of EHRs are linked to patient DNA, offering unprecedented opportunities to query relationships between genetic risk for complex disease and quantitative physiological measurements collected on large populations.
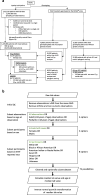
Methods: A total of 3075 quantitative lab tests were extracted from Vanderbilt University Medical Center's (VUMC) EHR system and cleaned for population-level analysis according to our QualityLab protocol. Lab values extracted from BioVU were compared with previous population studies using heritability and genetic correlation analyses. We then tested the hypothesis that polygenic risk scores for biomarkers and complex disease are associated with biomarkers of disease extracted from the EHR. In a proof of concept analyses, we focused on lipids and coronary artery disease (CAD). We cleaned lab traits extracted from the EHR performed lab-wide association scans (LabWAS) of the lipids and CAD polygenic risk scores across 315 heritable lab tests then replicated the pipeline and analyses in the Massachusetts General Brigham Biobank.
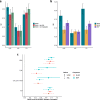
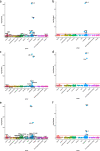
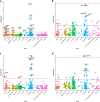
Results: Heritability estimates of lipid values (after cleaning with QualityLab) were comparable to previous reports and polygenic scores for lipids were strongly associated with their referent lipid in a LabWAS. LabWAS of the polygenic score for CAD recapitulated canonical heart disease biomarker profiles including decreased HDL, increased pre-medication LDL, triglycerides, blood glucose, and glycated hemoglobin (HgbA1C) in European and African descent populations. Notably, many of these associations remained even after adjusting for the presence of cardiovascular disease and were replicated in the MGBB.
Conclusions: Polygenic risk scores can be used to identify biomarkers of complex disease in large-scale EHR-based genomic analyses, providing new avenues for discovery of novel biomarkers and deeper understanding of disease trajectories in pre-symptomatic individuals. We present two methods and associated software, QualityLab and LabWAS, to clean and analyze EHR labs at scale and perform a Lab-Wide Association Scan.
Keywords: Biomarkers; Electronic health records; Genetic epidemiology; Population genetics.
Conflict of interest statement
JWS is an unpaid member of the Bipolar/Depression Research Community Advisory Panel of 23andMe, is a member of the Leon Levy Foundation Neuroscience Advisory Board, and received an honorarium for an internal seminar at Biogen, Inc. He is PI of a collaborative study of the genetics of depression and bipolar disorder sponsored by 23andMe for which 23andMe provides analysis time as in-kind support but no payments. The remaining authors declare that they have no competing interests.
Figures


References
MeSH terms
Substances
Grants and funding
- R00 AG054573/AG/NIA NIH HHS/United States
- UL1 RR024975/RR/NCRR NIH HHS/United States
- T32 GM080178/GM/NIGMS NIH HHS/United States
- R01 MH118233/MH/NIMH NIH HHS/United States
- K99 AG054573/AG/NIA NIH HHS/United States
- U54 MD010722/MD/NIMHD NIH HHS/United States
- 16FTF30130005/AHA/American Heart Association-American Stroke Association/United States
- R01 MH113362/MH/NIMH NIH HHS/United States
- U01 HG008685/HG/NHGRI NIH HHS/United States
- S10 RR025141/RR/NCRR NIH HHS/United States
- UL1 TR000445/TR/NCATS NIH HHS/United States
- U24 CA242637/CA/NCI NIH HHS/United States
- R01 GM120736/GM/NIGMS NIH HHS/United States
- UL1 TR002373/TR/NCATS NIH HHS/United States
- P50 HD103537/HD/NICHD NIH HHS/United States
- R56 MH120736/MH/NIMH NIH HHS/United States
- R01 GM130791/GM/NIGMS NIH HHS/United States
- UL1 TR002243/TR/NCATS NIH HHS/United States
- UL1 TR000427/TR/NCATS NIH HHS/United States
LinkOut - more resources
Full Text Sources
Other Literature Sources
Medical
Miscellaneous

