. 2021 Jan 13;6(1):e01263-20.
doi: 10.1128/mSphere.01263-20.

Genes Influencing Phage Host Range in Staphylococcus aureus on a Species-Wide Scale

Affiliations

Genes Influencing Phage Host Range in Staphylococcus aureus on a Species-Wide Scale

Abraham G Moller et al. mSphere. .

Abstract

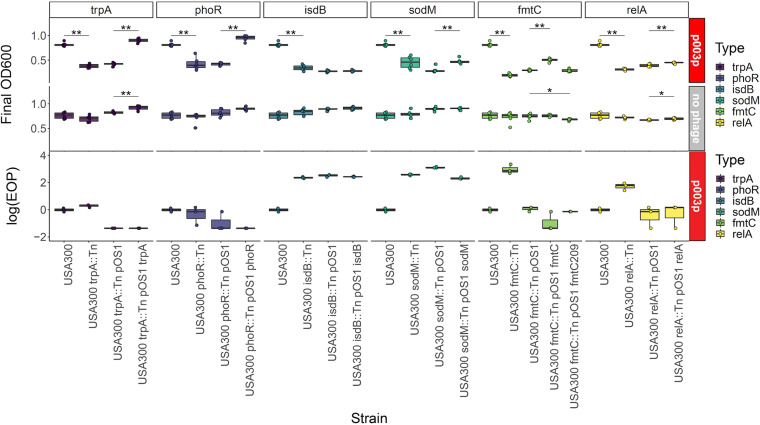
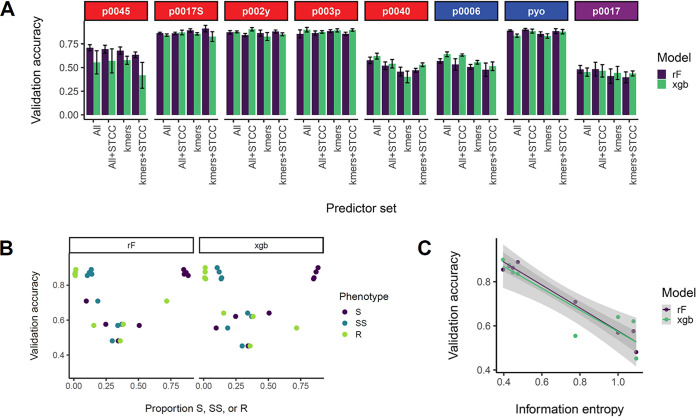
Staphylococcus aureus is a human pathogen that causes serious diseases, ranging from skin infections to septic shock. Bacteriophages (phages) are both natural killers of S. aureus, offering therapeutic possibilities, and important vectors of horizontal gene transfer (HGT) in the species. Here, we used high-throughput approaches to understand the genetic basis of strain-to-strain variation in sensitivity to phages, which defines the host range. We screened 259 diverse S. aureus strains covering more than 40 sequence types for sensitivity to eight phages, which were representatives of the three phage classes that infect the species. The phages were variable in host range, each infecting between 73 and 257 strains. Using genome-wide association approaches, we identified putative loci that affect host range and validated their function using USA300 transposon knockouts. In addition to rediscovering known host range determinants, we found several previously unreported genes affecting bacterial growth during phage infection, including trpA, phoR, isdB, sodM, fmtC, and relA We used the data from our host range matrix to develop predictive models that achieved between 40% and 95% accuracy. This work illustrates the complexity of the genetic basis for phage susceptibility in S. aureus but also shows that with more data, we may be able to understand much of the variation. With a knowledge of host range determination, we can rationally design phage therapy cocktails that target the broadest host range of S. aureus strains and address basic questions regarding phage-host interactions, such as the impact of phage on S. aureus evolution.IMPORTANCEStaphylococcus aureus is a widespread, hospital- and community-acquired pathogen, many strains of which are antibiotic resistant. It causes diverse diseases, ranging from local to systemic infection, and affects both the skin and many internal organs, including the heart, lungs, bones, and brain. Its ubiquity, antibiotic resistance, and disease burden make new therapies urgent. One alternative therapy to antibiotics is phage therapy, in which viruses specific to infecting bacteria clear infection. In this work, we identified and validated S. aureus genes that influence phage host range-the number of strains a phage can infect and kill-by testing strains representative of the diversity of the S. aureus species for phage host range and associating the genome sequences of strains with host range. These findings together improved our understanding of how phage therapy works in the bacterium and improve prediction of phage therapy efficacy based on the predicted host range of the infecting strain.

Keywords: GWAS; Staphylococcus aureus; bacteriophage lysis; bacteriophage therapy; bacteriophages; bioinformatics; computational biology; efficiency of plating; evolution; phage host range; phage resistance; spot assay.


Figures

FIG 1
FIG 1
Development of the high-throughput phage host range assay. (A) Examples of fully sensitive (NRS149) and fully resistant (NRS148) spot assay phenotypes for five test phages (p0045, p0006, p0017S, p002y, and p003p). (B) Calibration of the high-throughput assay against qualitative spot assay phenotypes (S, sensitive, complete clearing; SS, semisensitive, cloudy clearing; R, resistant, no clearing) determined with the spot assay for 108 NARSA strains and the five phages listed for panel A. Siphoviridae are listed in red, and Myoviridae are listed in blue. Data represent the distribution of average high-throughput assay measurements for strains evaluated as S, SS, or R in corresponding spot assays. Wilcoxon signed-rank test significance values for each possible comparison are listed at the top of the corresponding box plots (ns, not significant; *, P = 0.01 to 0.05; **, P = 0.001 to 0.01; ***, P = 0.0001 to 0.001; ****, P = 0 to 0.0001). (C) Example of high-throughput assay results from one 96-well plate containing overnight cultures of 96 NARSA strains coincubated with phage p0006. (D) Example of high-throughput assay phenotypes for a sensitive S. aureus strain, a resistant strain, bacteria without phage, and phage without bacteria.
FIG 2
FIG 2
Host range distribution, concordance, and multiple phage resistance. (A) Number of strains that fall into host range categories for each phage. Sensitive (S) corresponds to an OD600 of 0.1 to 0.4, semisensitive (SS) corresponds to an OD600 of 0.4 to 0.7, and resistant (R) corresponds to an OD600 of 0.7 or higher. (B) Histogram of number of phages to which strains are resistant, by the previous definition. (C) Concordance matrix of the host ranges of the tested phages. Concordance is defined as the number of strains with identical phenotypes between two phages. Siphoviridae are listed in red, Myoviridae in blue, and Podoviridae in purple.
FIG 3
FIG 3
Phage resistance is related to clonal complex (CC) but not MRSA genetic background. Data represent the distribution of average high-throughput assay measurements for strains belonging to each presented CC (all 259 strains) (A) or MRSA/MSSA (126 NARSA strains) (B) genetic background. One-way ANOVA significance values for overall differences among CCs presented and Wilcoxon signed-rank test significance values for MRSA/MSSA differences are indicated at the top of the corresponding box plots (ns, not significant; *, P = 0.01 to 0.05; **, P = 0.001 to 0.01; ***, P = 0.0001 to 0.001; ****, P = 0 to 0.0001). Siphoviridae are listed in red, Myoviridae in blue, and Podoviridae in purple.
FIG 4
FIG 4
Phage resistance across the S. aureus species. Average high-throughput phage host range assay phenotypes (of at least six replicates) and corresponding strain clonal complexes were placed on a maximum-likelihood, midpoint-rooted core genome phylogeny and visualized with the Interactive Tree of Life (iTOL) (107). Phenotypes are presented on a scale from blue (lowest OD600, most sensitive) to orange (highest OD600, most resistant). Phenotypes from inside to outside correspond to phages p0045, p0006, p0017, p0017S, p002y, p003p, p0040, and pyo. CCs are shaded inside and outside the circumference of the tree.
FIG 5
FIG 5
Molecular genetics validates putative phage resistance determinants. High-throughput host range assay (top) and efficiency of plating (EOP) (bottom) phenotypes demonstrating genetic validation of novel GWAS phage host range determinants are shown. Results are grouped by gene (trpA, phoR, isdB, sodM, fmtC, and relA). All assays were performed with siphovirus p003p or no phage. Each gene group includes four strains demonstrating complementation with proper controls (USA300, USA300 transposon mutant, USA300 transposon mutant with empty pOS1 vector, and USA300 transposon mutant complemented with gene in pOS1 vector). All significant (P < 0.05) pairwise differences (Wilcoxon signed-rank test) are indicated at the top of the corresponding box plots (ns, not significant; *, P = 0.01 to 0.05; **, P = 0.001 to 0.01; ***, P = 0.0001 to 0.001; ****, P = 0 to 0.0001).
FIG 6
FIG 6
Construction of predictive models for each ternary phage resistance phenotype. Quantitative host range phenotypes were classified as sensitive (S), semisensitive (SS), or resistant (R) based on the bins (OD600, 0.1 to 0.4, 0.4 to 0.7, and 0.7 or more, respectively). Siphoviridae are listed in red, Myoviridae in blue, and Podoviridae in purple. (A) Tenfold cross-validation predictive accuracies for each phage based on two model building methods (randomForest and XGBoost) and four sets of predictors, all significant GWAS genetic determinants (COGs, SNPs, and k-mers) for a particular phage, all determinants plus corresponding strain sequence type and clonal complex (ST and CC), significant k-mers for a particular phage, and significant k-mers plus strain ST and CC. Average accuracies of four 10-fold cross-validation (CV) replicates are presented with 1 standard error above and below the mean. Validation accuracy represents the proportion of correctly identified ternary phenotypes in the validation set (one-tenth of the strain set). (B) Average accuracies from four 10-fold CV replicates for each model building method and all significant GWAS determinants as predictors relative to the proportion of each ternary phenotype (S, SS, or R) among tested strains for the corresponding phage. Three points are shown for each validation accuracy result (corresponding to each of the three possible phenotypes). (C) Average accuracies from four 10-fold CV replicates for each model building method and all significant GWAS determinants as predictors relative to the information entropy for each host range phenotype, which was calculated as described in Materials and Methods. Information entropy was calculated with a natural logarithm in natural units (nats).

Similar articles

Cited by

References

    1. Moller AG, Lindsay JA, Read TD. 2019. Determinants of phage host range in Staphylococcus species. Appl Environ Microbiol 85:e00209-19. doi:10.1128/AEM.00209-19. - DOI - PMC - PubMed
    1. Azam AH, Tanji Y. 2019. Peculiarities of Staphylococcus aureus phages and their possible application in phage therapy. Appl Microbiol Biotechnol 103:4279–4289. doi:10.1007/s00253-019-09810-2. - DOI - PubMed
    1. Pirisi A. 2000. Phage therapy—advantages over antibiotics? Lancet 356:1418. doi:10.1016/S0140-6736(05)74059-9. - DOI - PubMed
    1. Nobrega FL, Costa AR, Kluskens LD, Azeredo J. 2015. Revisiting phage therapy: new applications for old resources. Trends Microbiol 23:185–191. doi:10.1016/j.tim.2015.01.006. - DOI - PubMed
    1. Xia G, Wolz C. 2014. Phages of Staphylococcus aureus and their impact on host evolution. Infect Genet Evol 21:593–601. doi:10.1016/j.meegid.2013.04.022. - DOI - PubMed

Publication types

MeSH terms

LinkOut - more resources