. 2021 Jan 13;13(576):eabc0227.
doi: 10.1126/scitranslmed.abc0227.

Spatiotemporal single-cell profiling reveals that invasive and tissue-resident memory donor CD8+ T cells drive gastrointestinal acute graft-versus-host disease

Affiliations

Spatiotemporal single-cell profiling reveals that invasive and tissue-resident memory donor CD8+ T cells drive gastrointestinal acute graft-versus-host disease

Victor Tkachev et al. Sci Transl Med. .

Abstract

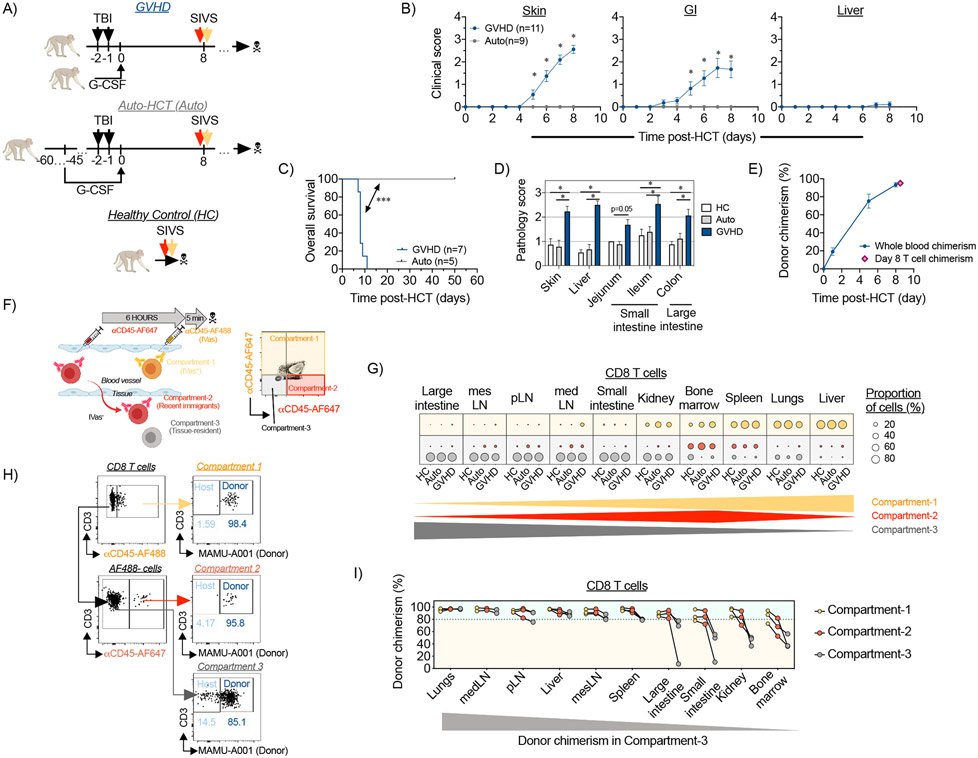
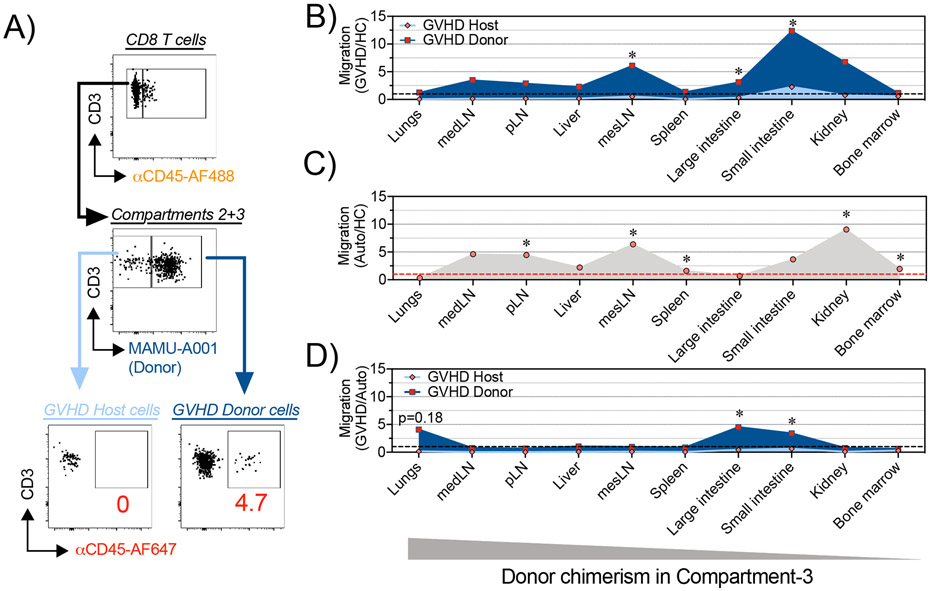
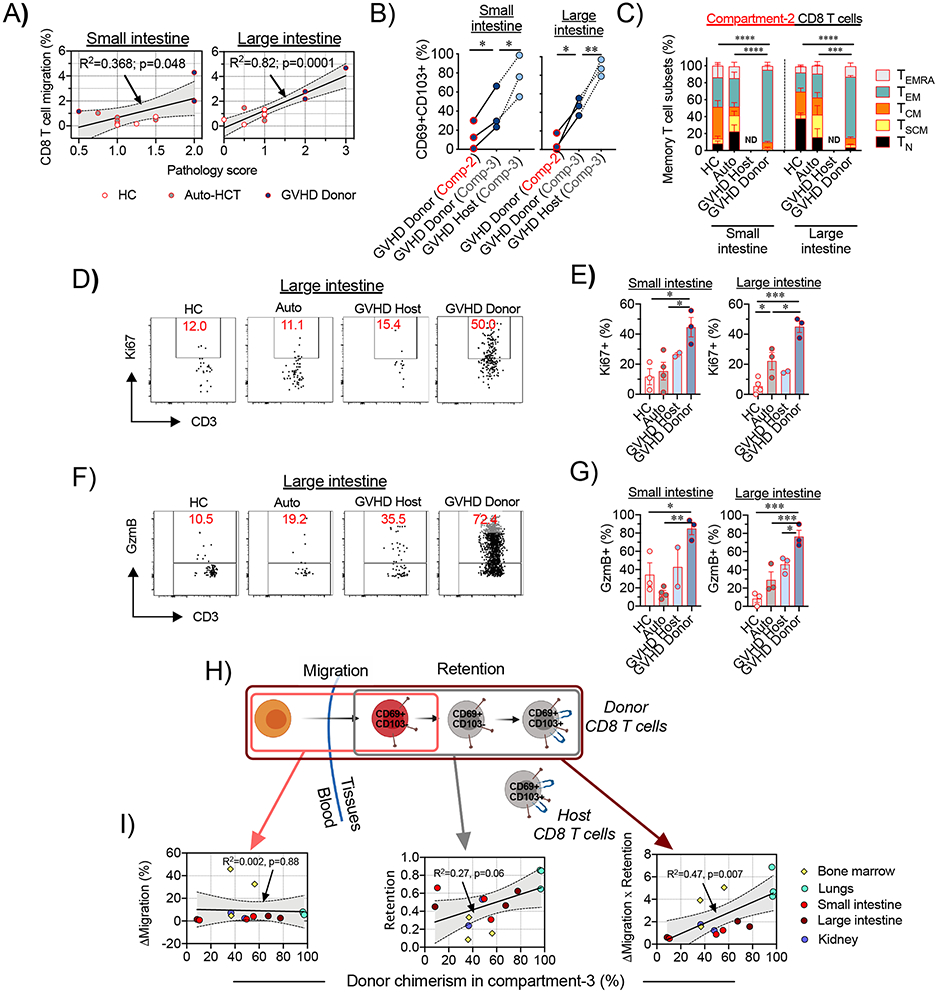
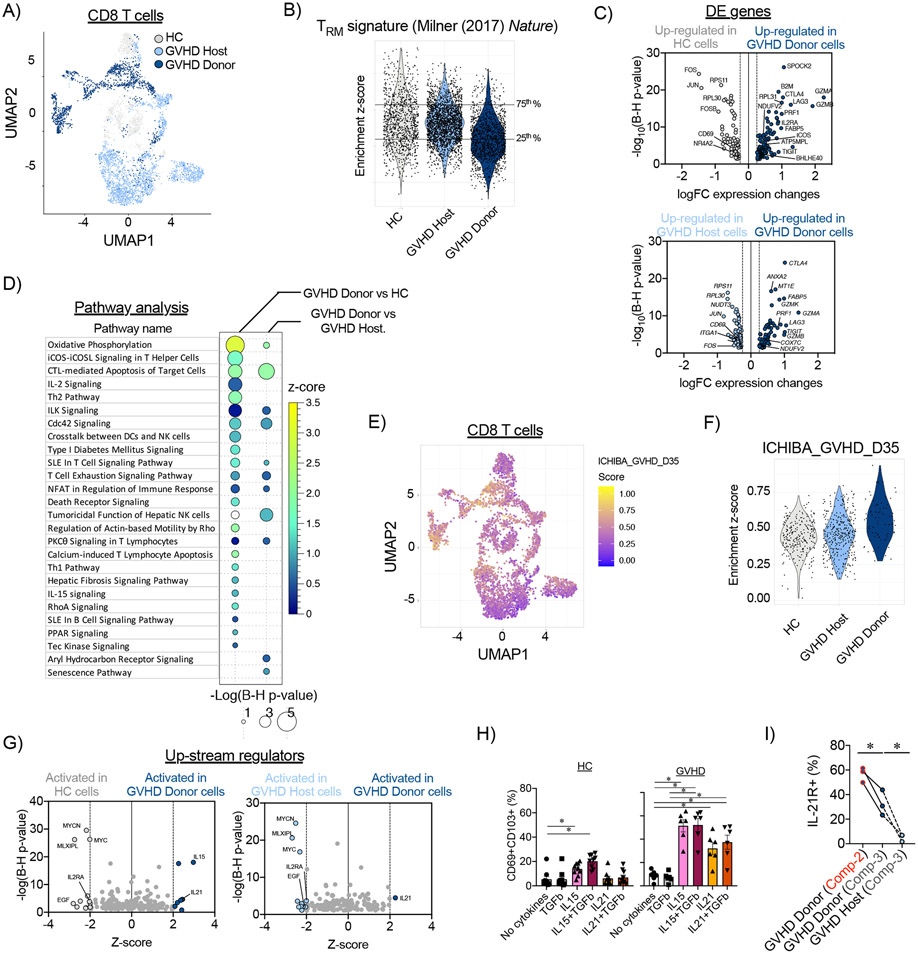
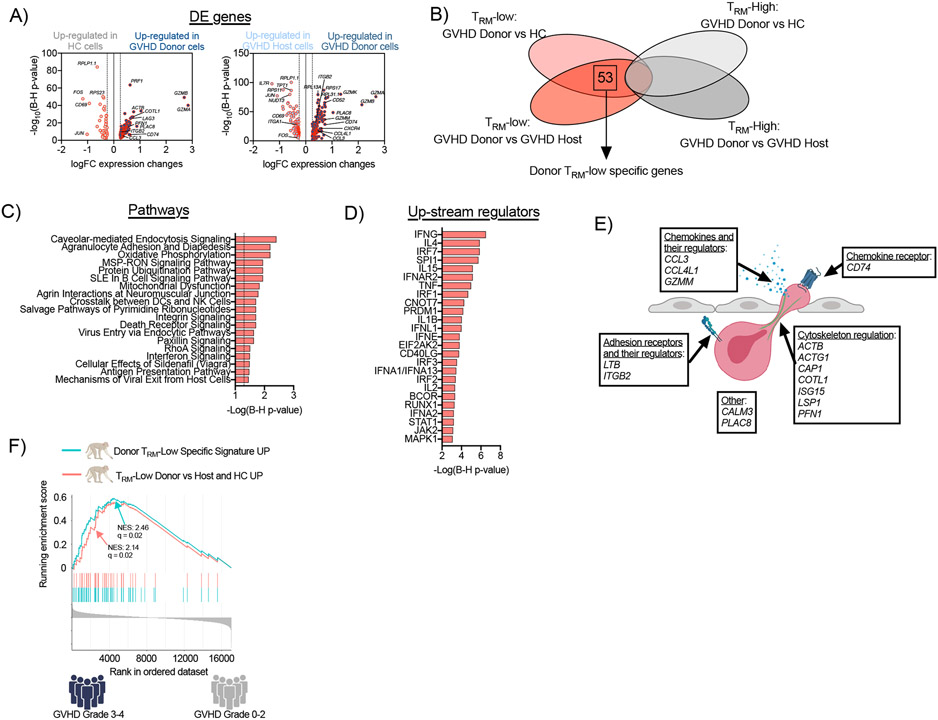
Organ infiltration by donor T cells is critical to the development of acute graft-versus-host disease (aGVHD) in recipients after allogeneic hematopoietic stem cell transplant (allo-HCT). However, deconvoluting the transcriptional programs of newly recruited donor T cells from those of tissue-resident T cells in aGVHD target organs remains a challenge. Here, we combined the serial intravascular staining technique with single-cell RNA sequencing to dissect the tightly connected processes by which donor T cells initially infiltrate tissues and then establish a pathogenic tissue residency program in a rhesus macaque allo-HCT model that develops aGVHD. Our results enabled creation of a spatiotemporal map of the transcriptional programs controlling donor CD8+ T cell infiltration into the primary aGVHD target organ, the gastrointestinal (GI) tract. We identified the large and small intestines as the only two sites demonstrating allo-specific, rather than lymphodepletion-driven, T cell infiltration. GI-infiltrating donor CD8+ T cells demonstrated a highly activated, cytotoxic phenotype while simultaneously developing a canonical tissue-resident memory T cell (TRM) transcriptional signature driven by interleukin-15 (IL-15)/IL-21 signaling. We found expression of a cluster of genes directly associated with tissue invasiveness, including those encoding adhesion molecules (ITGB2), specific chemokines (CCL3 and CCL4L1) and chemokine receptors (CD74), as well as multiple cytoskeletal proteins. This tissue invasion transcriptional signature was validated by its ability to discriminate the CD8+ T cell transcriptome of patients with GI aGVHD from those of GVHD-free patients. These results provide insights into the mechanisms controlling tissue occupancy of target organs by pathogenic donor CD8+ TRM cells during aGVHD in primate transplant recipients.


Figures

Figure 1.
Figure 1.. Spatiotemporal compartmentalization of T cells in tissues during aGVHD.
(A-B) The experimental animals received autologous or allogeneic HCT as shown in (A) and clinical aGVHD scores for skin (B, left panel), gastrointestinal tract (B, middle panel) and liver (B, right panel) were calculated for GVHD (n=11 animals) and auto-HCT (n=9 animals) experimental NHP cohorts. *p<0.05, using two-way ANOVA with multiple comparison Holm-Sidak post-test. (C) Overall survival of NHP recipients following allo- and auto-HCT without immunosuppression is presented. Studies with pre-set experimental endpoints were censored. **p<0.01 using log-rank (Mantel-Cox) test. (D) aGVHD histopathology scores were measured for indicated organs from healthy control (HC) animals or HCT recipients on day +8 after allo- or auto-HCT without immunosuppression. *p<0.05, using multiple comparison Holm-Sidak test. (E) Donor chimerism in whole blood or FACS-purified peripheral blood T cells from allo-HCT recipient animals was quantified by microsatellite analysis. (F) Experimental schema and representative flow cytometry plot from HC lung that illustrate the SIVS method using fluorescent αCD45-antibodies to discern cellular compartmentalization and to track cellular migration into tissues are shown. (G) Relative distribution of CD8+ T cells among the intravascular compartment (Compartment-1; green dots), the recent infiltrating cell compartment (Compartment-2; red dots) and the tissue-localized compartment (Compartment-3; gray dots) in the indicated organs from healthy control animals (HC; n=4 animals), auto-HCT recipients (auto-HCT; n=4 animals) and allo-HCT recipients (GVHD; n=4 animals) on day +8 post-transplant. The green, and gray triangles and the red diamond at the bottom of the figure illustrate the pattern of the three compartments in the tissues examined. pLN, peripheral Lymph Nodes; medLN, mediastinal Lymph Nodes; mesLN, mesenteric Lymph Nodes. (H) Measurement of donor chimerism in the colon of an allo-HCT recipient animal, based on discordant expression of MHC-I allele MAMU-A001, in the three different compartments. (I) Donor CD8+ T cell chimerism in different compartments across different organs on day +8 following MAMU-A001-mismatched MHC-haploidentical allo-HCT (n=3 animals). The gray triangle at the bottom of the figure illustrates the pattern of donor chimerism in the tissues examined.
Figure 2.
Figure 2.. Dynamics of CD8+ T cell trafficking into GVHD-target organs following HCT in NHP.
(A) Mononuclear cells were isolated from different organs from HC animals (n=4) or from recipient animals on day +8 following auto-HCT (n=4 animals) or MAMU-A001-mismatched allo-HCT (n=3 animals). A representative gating tree depicts SIVS-based measurement of donor and host CD8+ T cell migration in MAMU-A001-mismatched allo-HCT transplantation. (B-D) Plots, depicting relative migration of donor and host CD8+ T cells from MAMU-A001-mismatched allo-HCT recipients, normalized to the migration of CD8+ T cells in untransplanted HC animals (B); relative migration of CD8+ T cells from autologous HCT recipients, normalized to the migration of CD8+ T cells in untransplanted HC (C) and relative migration of donor and host CD8+ T cells from MAMU-A001-mismatched allo-HCT recipients, normalized to the migration of CD8+ T cells following auto-HCT (D). pLN – peripheral Lymph Nodes, medLN – mediastinal Lymph Nodes, mesLN – mesenteric Lymph Nodes. *p<0.05 using t-test with Holm-Sidak multiple comparison correction.
Figure 3.
Figure 3.. Migration of donor CD8+ T cells to the large and small intestine correlates with the severity of tissue pathology during aGVHD in NHP.
(A) Correlations between the migration of CD8+ T cells and GVHD histopathology scores in the small intestine (jejunum; left panel) and large intestine (colon; right panel) are shown. Lines with tinted areas indicate the 95% CI using linear regression. (B) Percentage of donor or host CD69+CD103+ CD8+ T cells were measured within the recent infiltrating compartment (Compartment-2) and the tissue-localized compartment (Comparment-3). Lines connect corresponding values that were obtained from the same animal. *p<0.05, **p<0.01 using paired t-test. Comp-2 = Compartment-2; Comp-3= Compartment-3. (C) Recent infiltrating (Compartment-2) CD8+ T cells in the small and large intestines from healthy control (HC) animals (n=4 for small intestine and n=3 for large intestine), auto-HCT cohort on day +8 (Auto, n=4 animals) and host (GVHD Host) and donor (GVHD Donor) cells following MAMU-A001-mismatched allo-HCT on day +8 (n=3 animals) were stained for CCR7, CD45RA and CD95 expression and the distributions between memory subsets are shown. ND – no data. (D-E) Representative flow cytometry plots (D) and summary data (E) depict Ki67 expression in recent infiltrating (Compartment-2) CD8+ T cells in the small and large intestine in different experimental cohorts. (F-G) Representative flow cytometry plots (F) and the summary data (G) depict Granzyme B (GzmB) expression in recent infiltrating (Compartment-2) CD8+ T cells in the small and large intestine in different experimental cohorts. For E and G: *p <0.05, **p<0.01, ***p<0.001 using one-way ANOVA with Holm-Sidak multiple comparison post-test. (H) Schematic representation of donor T cell immigration into GVHD-target non-lymphoid tissues and gradual acquisition of the CD69+CD103+ TRM phenotype. (I) Correlations between donor chimerism in tissue-localized CD8+ T cells (Compartment-3) and the difference between the extent of donor and host CD8+ T cell migration (ΔMigration, left panel), extent of acquisition of the CD69+CD103+ TRM phenotype in the immigrated donor CD8+ T cells (Retention, middle panel) and the difference between the extent of donor and host CD8+ T cell migration, adjusted to the extent of acquisition of the CD69+CD103+ TRM phenotype (Migration X Retention), across different non-lymphoid organs and tissues are shown. The lines with the tinted areas indicate the 95% CI using linear regression.
Figure 4.
Figure 4.. Transcriptomic profile of donor-derived CD8+ TRM cells in the large intestine during aGVHD in NHP.
(A) CD8+ T cell census (n=4,715 cells), colored by experimental cohort, was clustered in Uniform Manifold Approximation and Projection (UMAP) space. (B) Enrichment scores for the TRM-signature from Milner et al, (2017) (37)) were calculated for CD8+ T cells from healthy control (HC) animals, and host and donor CD8+ T cells on day +8 following allo-HCT. Horizontal lines represent the 25th and 75th percentiles for enrichment scores of the healthy control cohort, which were used as cut off values to determine TRM-low and TRM-high cells. (C) Differentially expressed (DE) genes were identified between donor CD8+ TRM-high cells and their counterparts from healthy control (HC) animals (HC; top panel) and host CD8+ T cells (bottom panel). (D) Pathway analysis was performed using Ingenuity Pathway Analysis on differentially expressed genes between donor CD8+ TRM-high cells, and their counterparts from healthy controls and host CD8+ T cells. Signaling pathways with positive enrichment scores and p<0.05 using a t-test with the Benjamini-Hochberg correction are depicted. (E) CD8+ T cell census (n=4,715 cells), colored by the enrichment score for the GVHD signature from Ichiba et al, (2003) (52), was clustered in UMAP space. (F) Enrichment scores for the aGVHD signature (from Ichiba et al, (2003) (52)) were calculated for healthy controls (HC), host, and donor CD8+ TRM-high cells. (G) Predicted up-stream regulators were determined using Ingenuity Pathway Analysis tool performed on DE genes between donor CD8+ TRM-high cells and their counterparts from healthy controls (left panel) and host CD8+ T cells (right panel). (H) Expression of IL-21R in Compartment-2 and Compartment-3 donor and host CD8+ T cells from the large intestines of MAMU-A001-mismatched allo-HCT recipients on day +8 (n=3). *p<0.05 using paired t-test. (I) Spleen cells, isolated from healthy control (HC) animals or animals with aGVHD on day +8 after allo-HCT, were incubated with the indicated cytokines for 48 hours. Then, percentage of CD69+CD103+ CD8+ T cells was measured by flow cytometry. *p<0.05, using one-way paired ANOVA and Holm-Sidak multiple comparison post-test.
Figure 5.
Figure 5.. Transcriptomic profile of donor tissue-infiltrating CD8+ T cells in the large intestine during aGVHD in NHP.
(A) Differentially expressed (DE) genes were identified between donor CD8+ TRM-low cells and their counterparts from healthy control animals (HC; left panel) and host CD8+ T cells (right panel). (B) Venn diagram illustrating the identification of the donor TRM-low-specific gene signature. (C-D) Pathway analysis was performed using Ingenuity Pathway Analysis on the donor TRM-low-specific gene signature. Signaling pathways with p<0.05 using a t-test with the Benjamini-Hochberg correction (C) and the predicted top 25 up-stream regulators (D) are depicted. (E) Functional annotation of migration-related genes from donor TRM-low-specific gene signature. (F) GSEA plot depict the enrichment of two TRM-low gene signatures in patients with grade 3-4 aGVHD (n=4) compared to patients with grade 0-2 aGVHD (n=38). The curve labeled “TRM-Low Donor vs Host and HC UP” encompasses genes over-represented in donor TRM-low CD8+ T cells in comparison with both host and HC TRM-low counterparts – blue line). The curve labeled “Donor TRM-Low specific signature UP” encompasses genes over-represented exclusively in the donor TRM-low CD8+ T cell comparison (but not present in the comparison of donor TRM-high CD8+ T cells versus both host and HC TRM-high counterparts) – red line). NES – normalized enrichment score.

References

    1. Masopust D, Choo D, Vezys V, Wherry EJ, Duraiswamy J, Akondy R, Wang J, Casey KA, Barber DL, Kawamura KS, Fraser KA, Webby RJ, Brinkmann V, Butcher EC, Newell KA, Ahmed R, Dynamic T cell migration program provides resident memory within intestinal epithelium. J Exp Med 207, 553–564 (2010). - PMC - PubMed
    1. McCully ML, Kouzeli A, Moser B, Peripheral Tissue Chemokines: Homeostatic Control of Immune Surveillance T Cells. Trends Immunol 39, 734–747 (2018). - PubMed
    1. Zundler S, Becker E, Spocinska M, Slawik M, Parga-Vidal L, Stark R, Wiendl M, Atreya R, Rath T, Leppkes M, Hildner K, Lopez-Posadas R, Lukassen S, Ekici AB, Neufert C, Atreya I, van Gisbergen K, Neurath MF, Hobit- and Blimp-1-driven CD4(+) tissue-resident memory T cells control chronic intestinal inflammation. Nat Immunol 20, 288–300 (2019). - PubMed
    1. Park CO, Kupper TS, The emerging role of resident memory T cells in protective immunity and inflammatory disease. Nat Med 21, 688–697 (2015). - PMC - PubMed
    1. Snyder ME, Finlayson MO, Connors TJ, Dogra P, Senda T, Bush E, Carpenter D, Marboe C, Benvenuto L, Shah L, Robbins H, Hook JL, Sykes M, D'Ovidio F, Bacchetta M, Sonett JR, Lederer DJ, Arcasoy S, Sims PA, Farber DL, Generation and persistence of human tissue-resident memory T cells in lung transplantation. Sci Immunol 4, (2019). - PMC - PubMed

Publication types

LinkOut - more resources