. 2021 Jan 13;13(576):eabb3946.
doi: 10.1126/scitranslmed.abb3946.

Targeting cartilage EGFR pathway for osteoarthritis treatment

Affiliations

Targeting cartilage EGFR pathway for osteoarthritis treatment

Yulong Wei et al. Sci Transl Med. .

Abstract

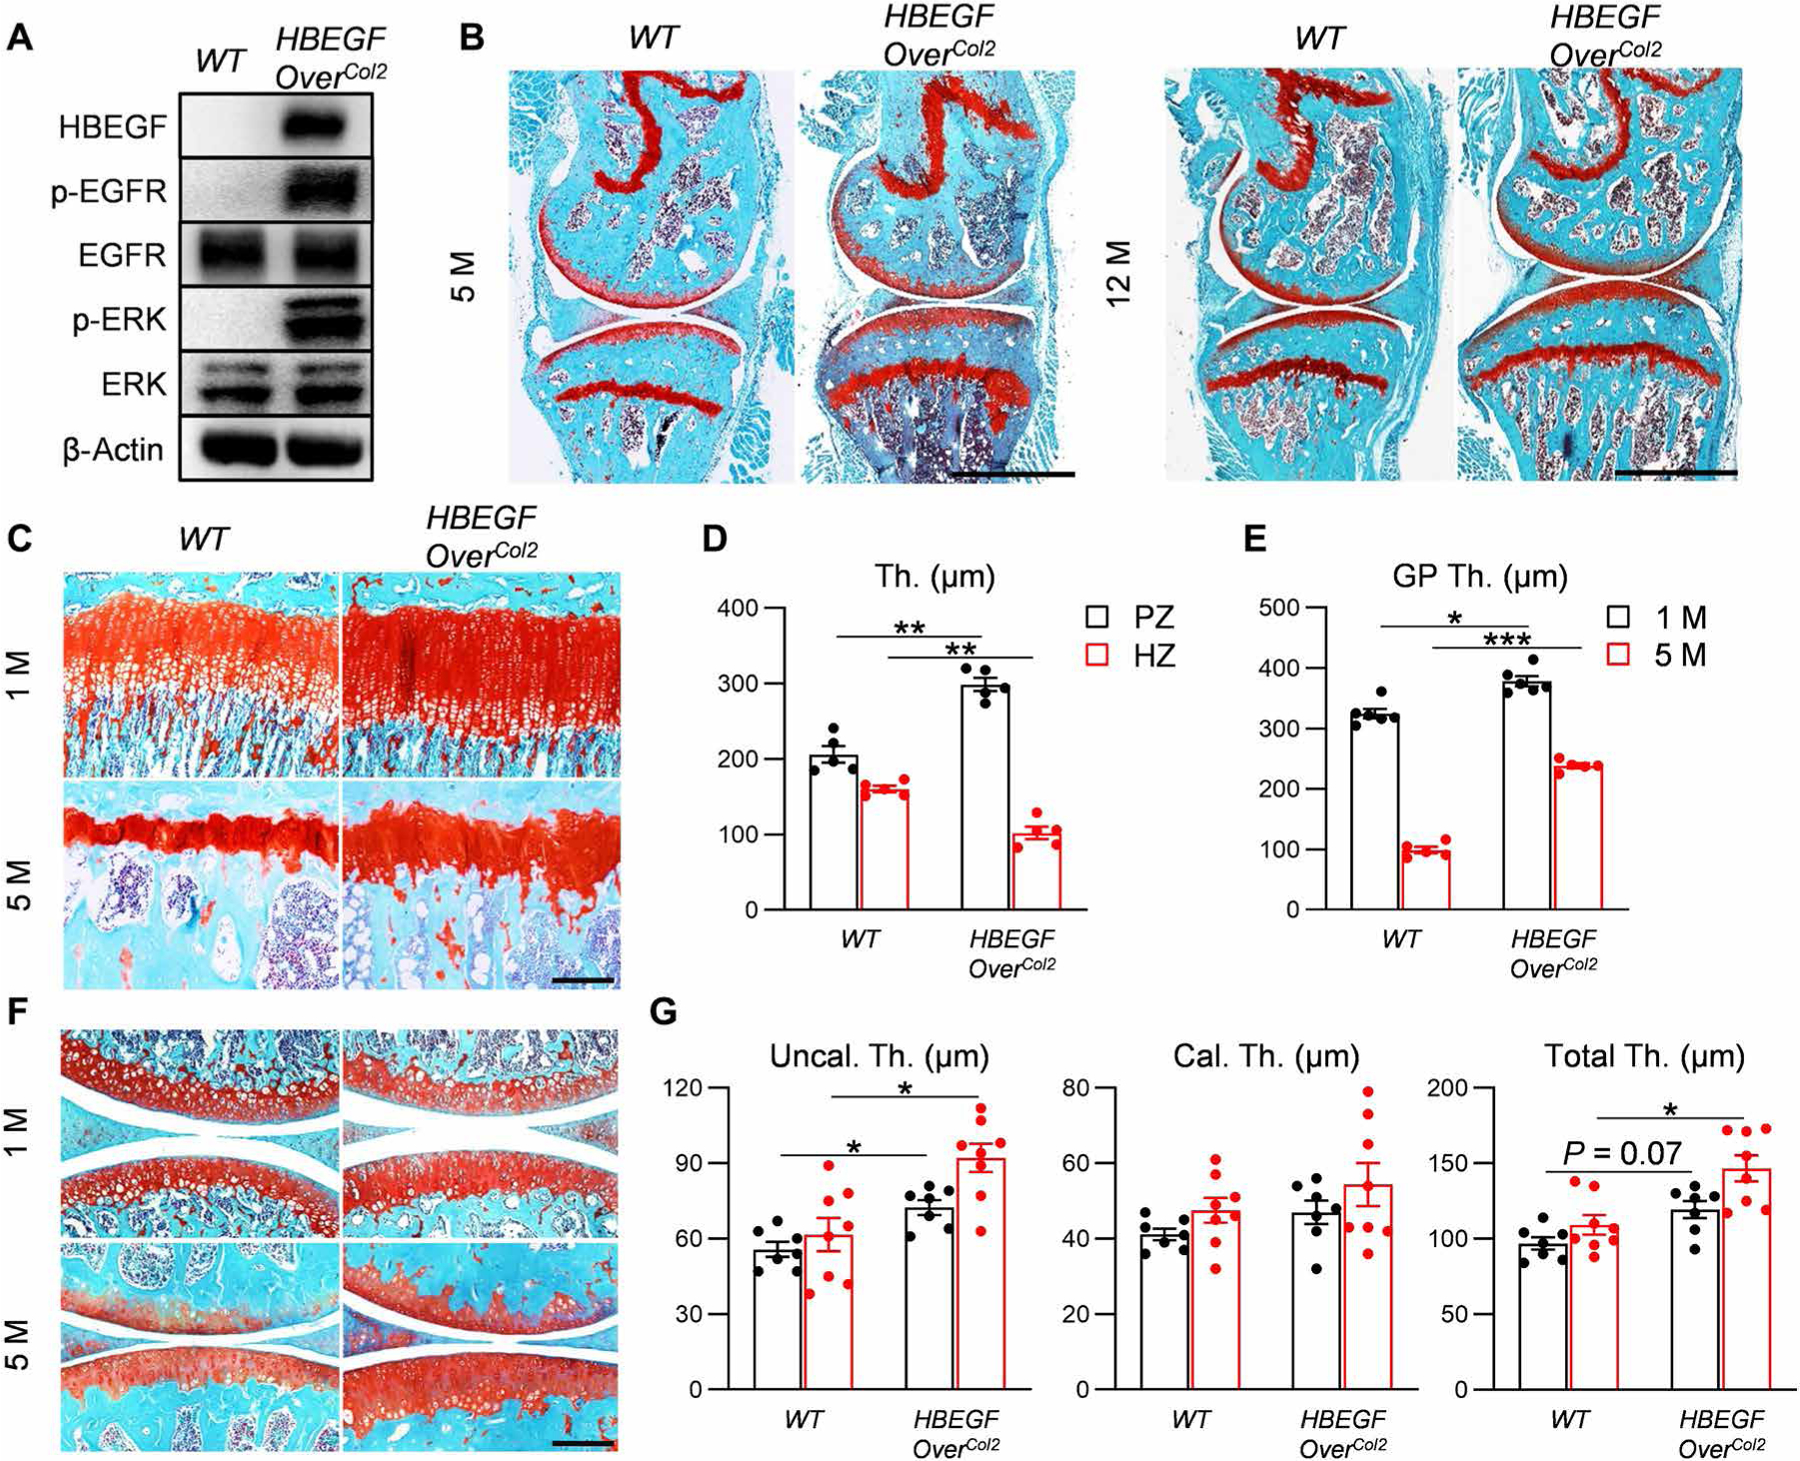
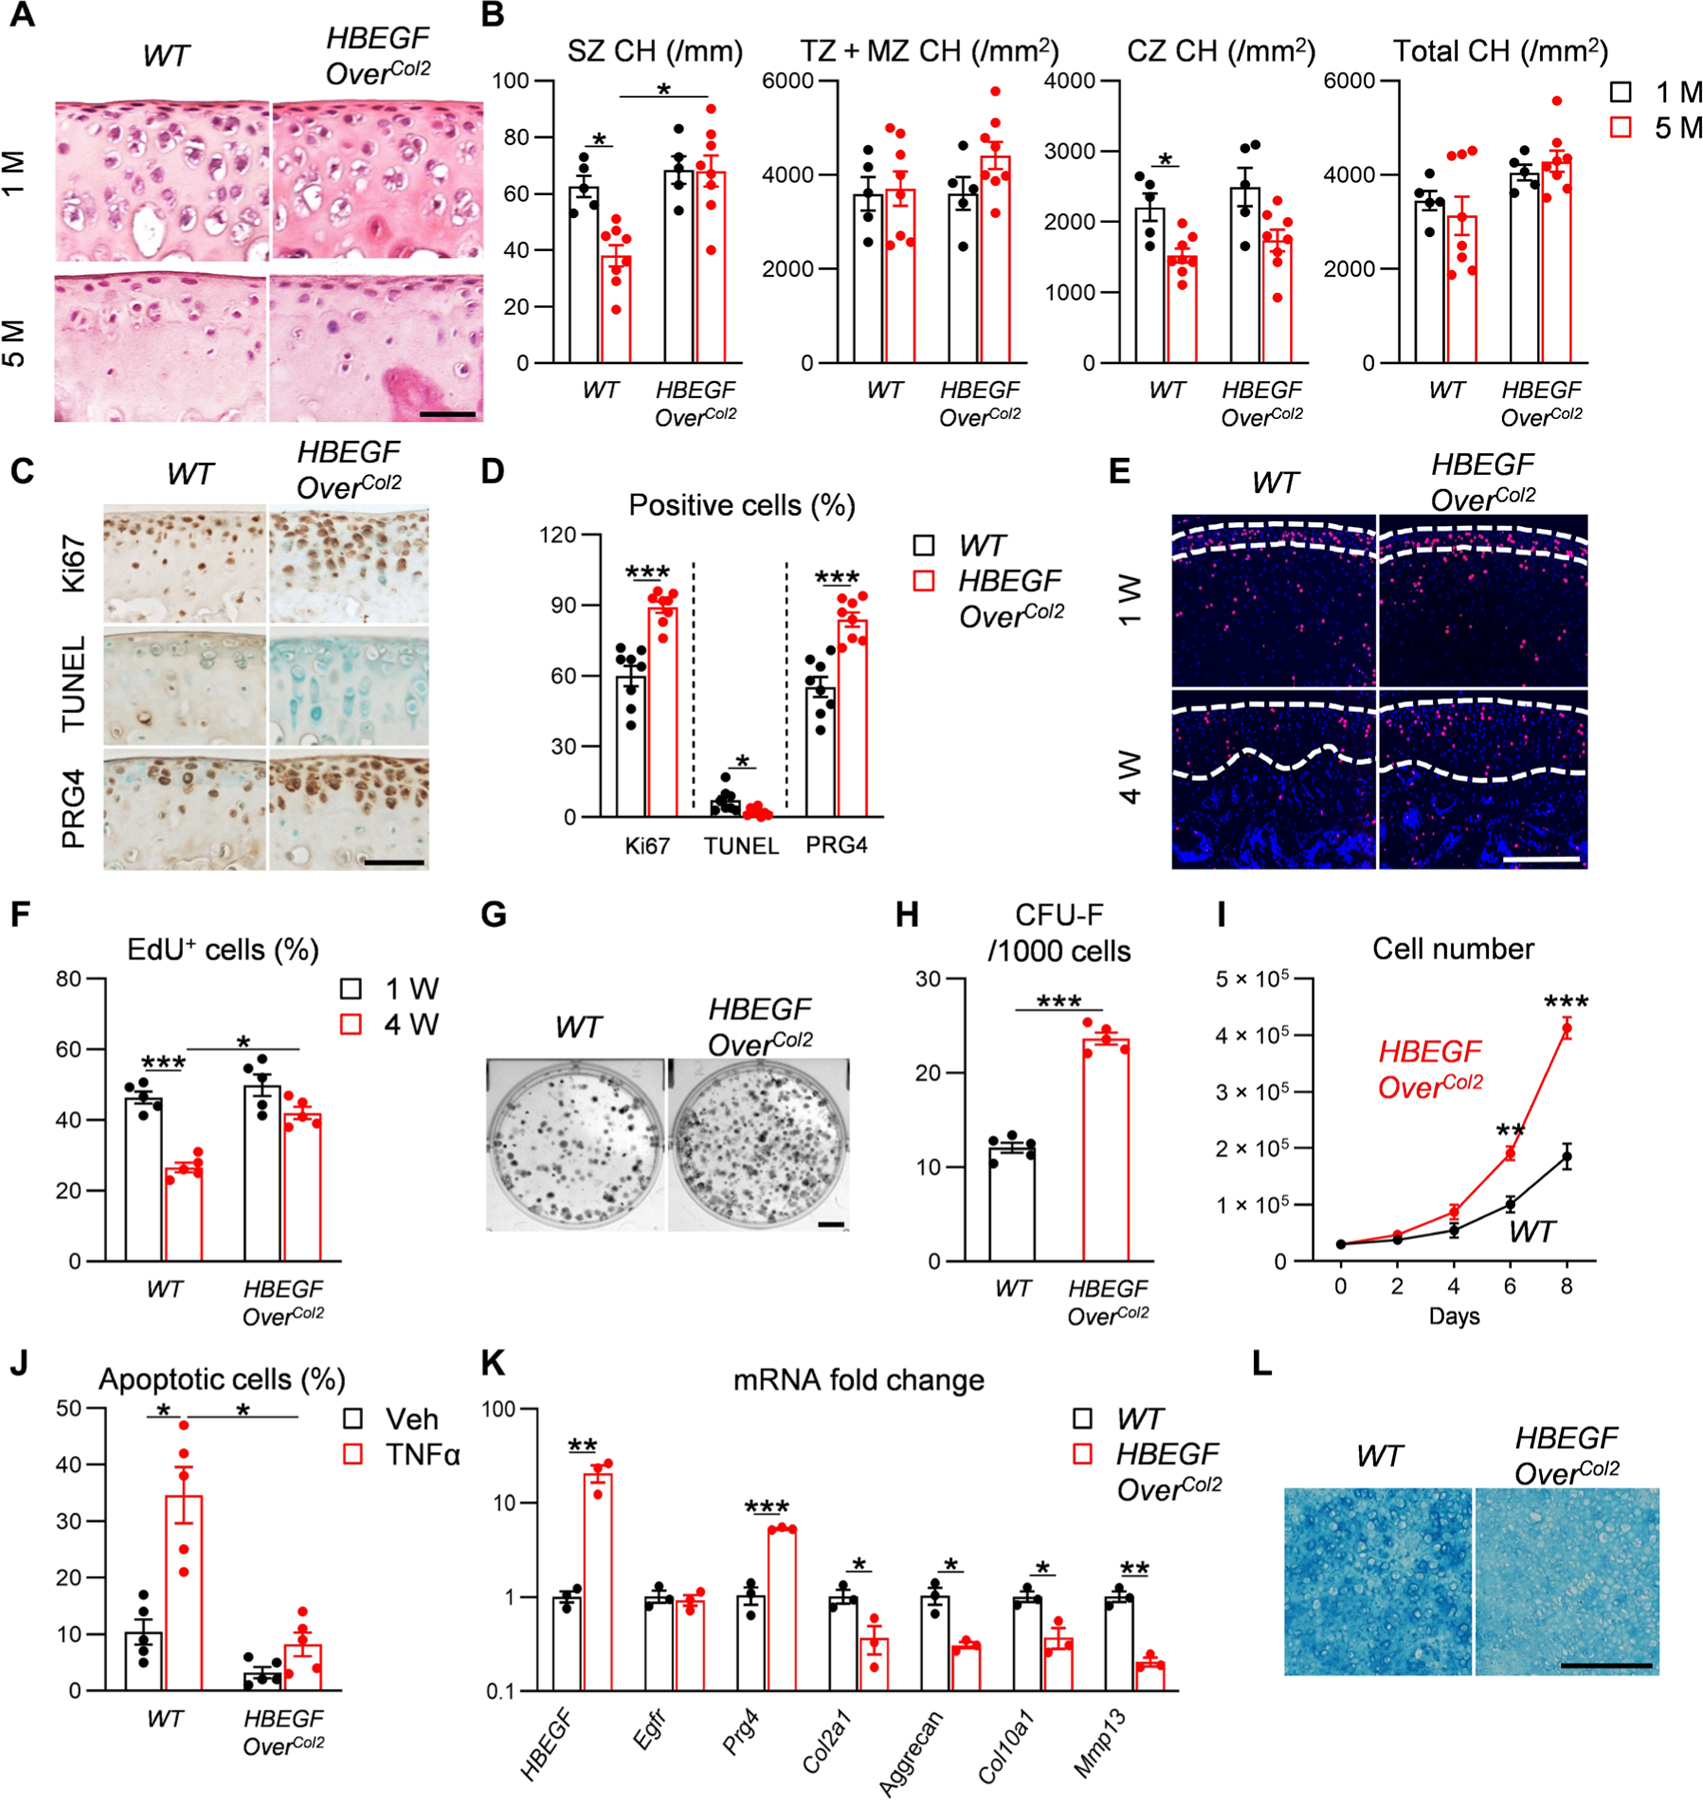
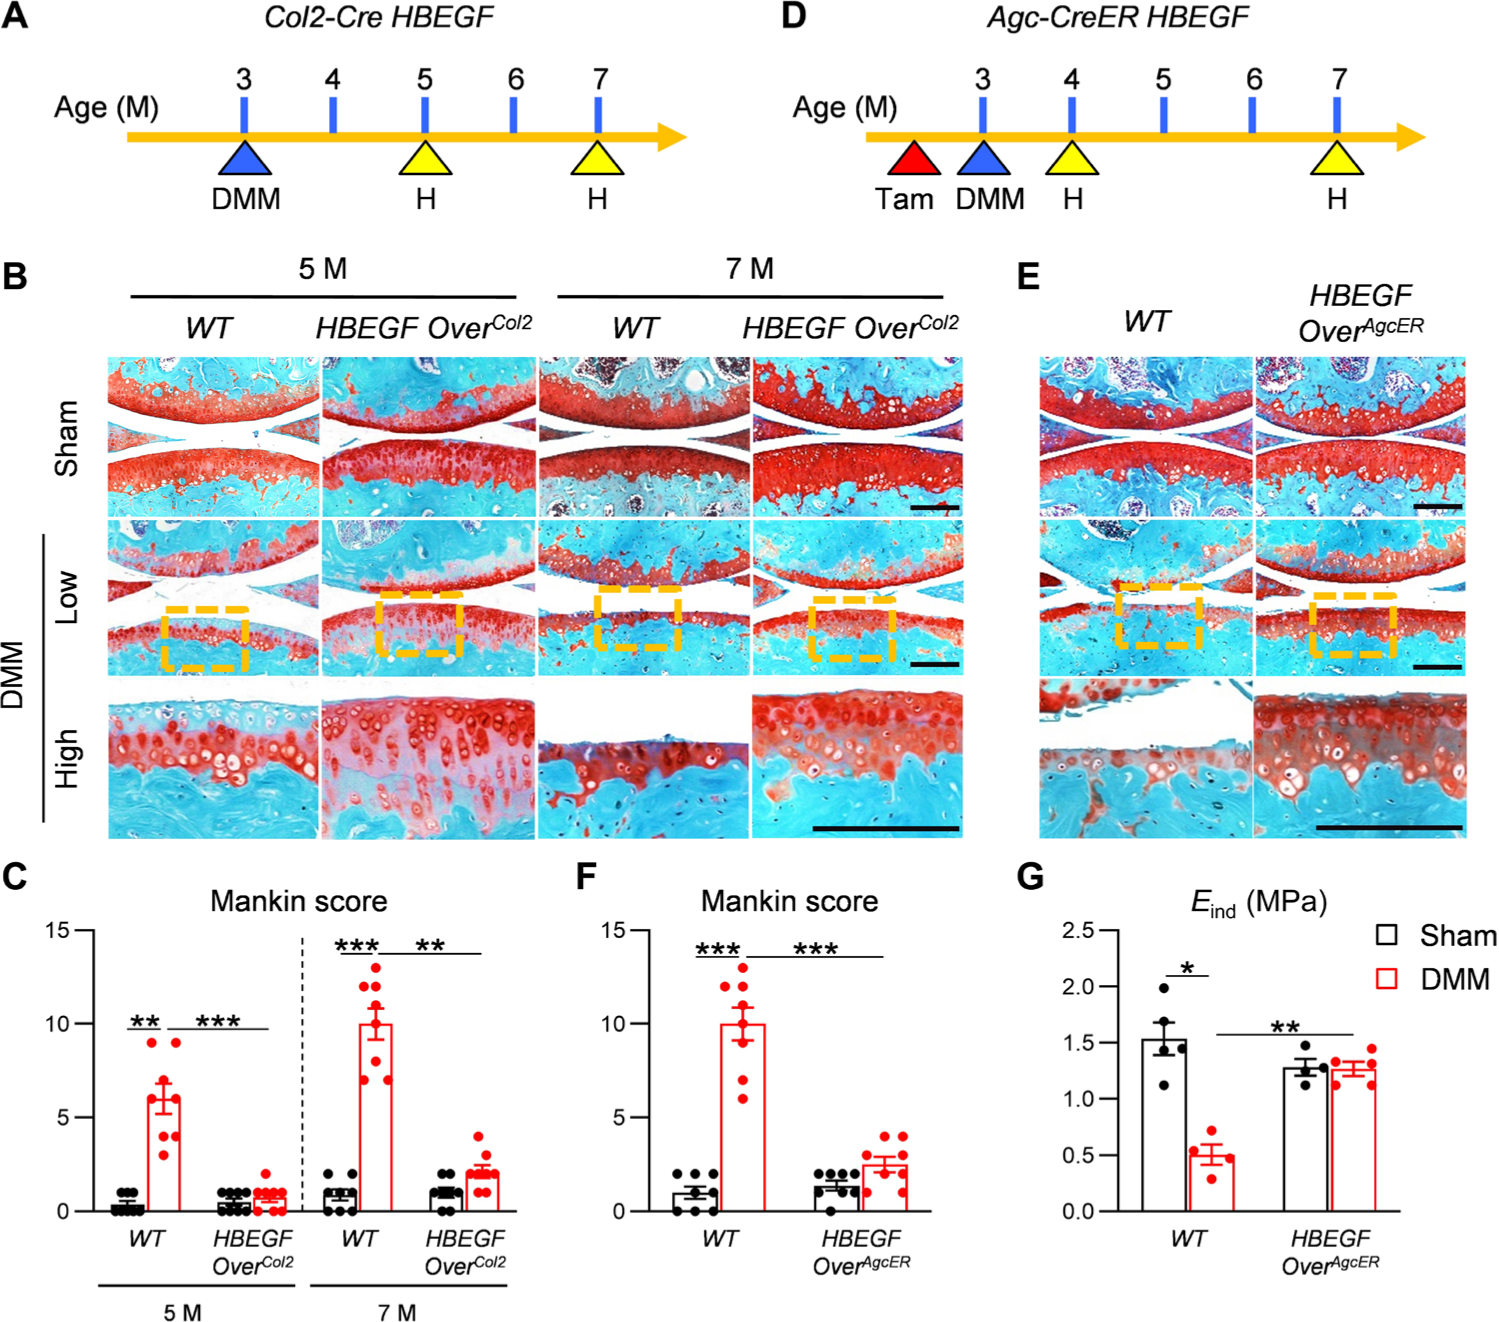
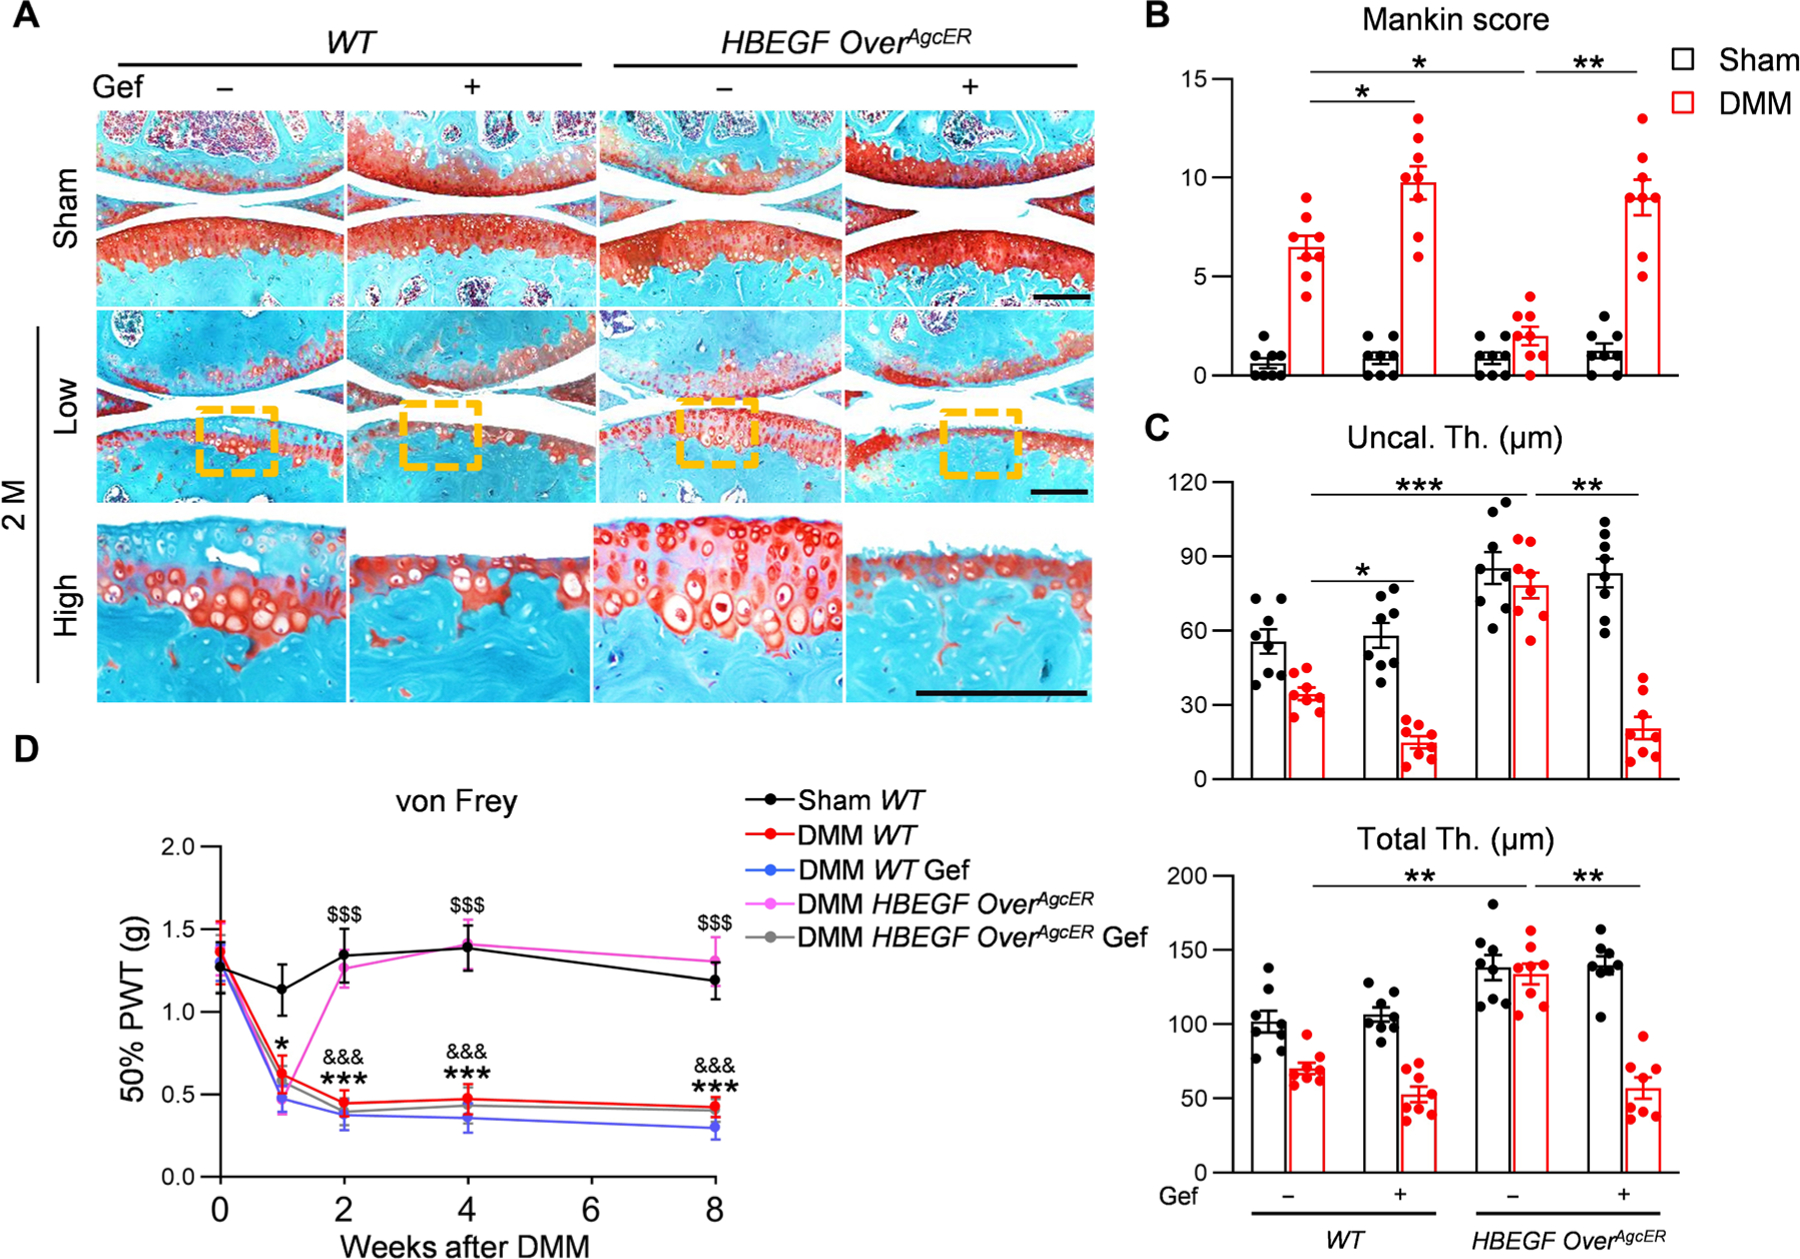
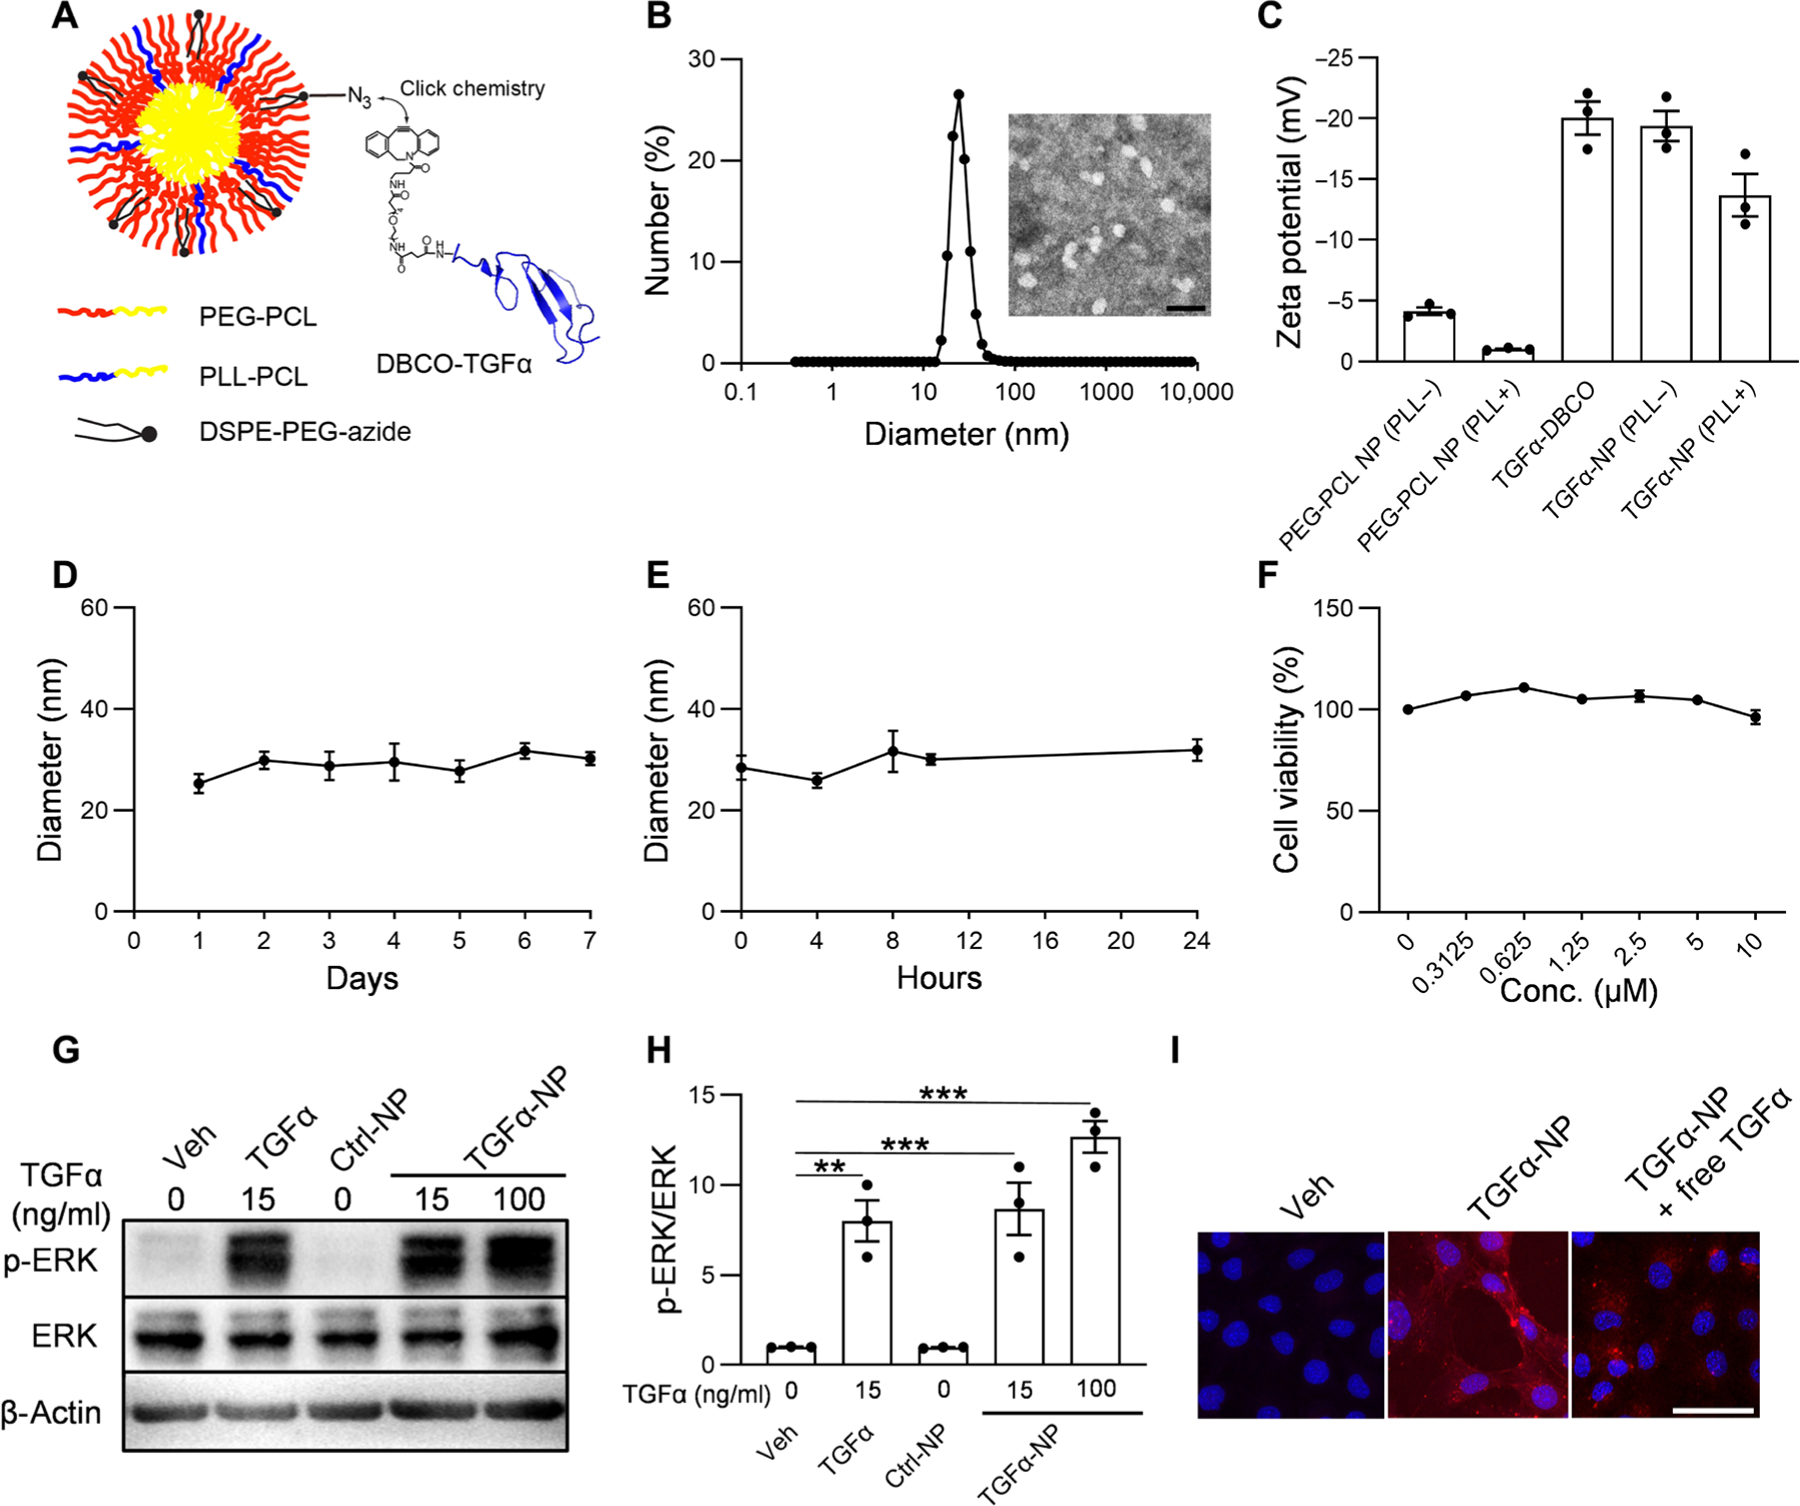
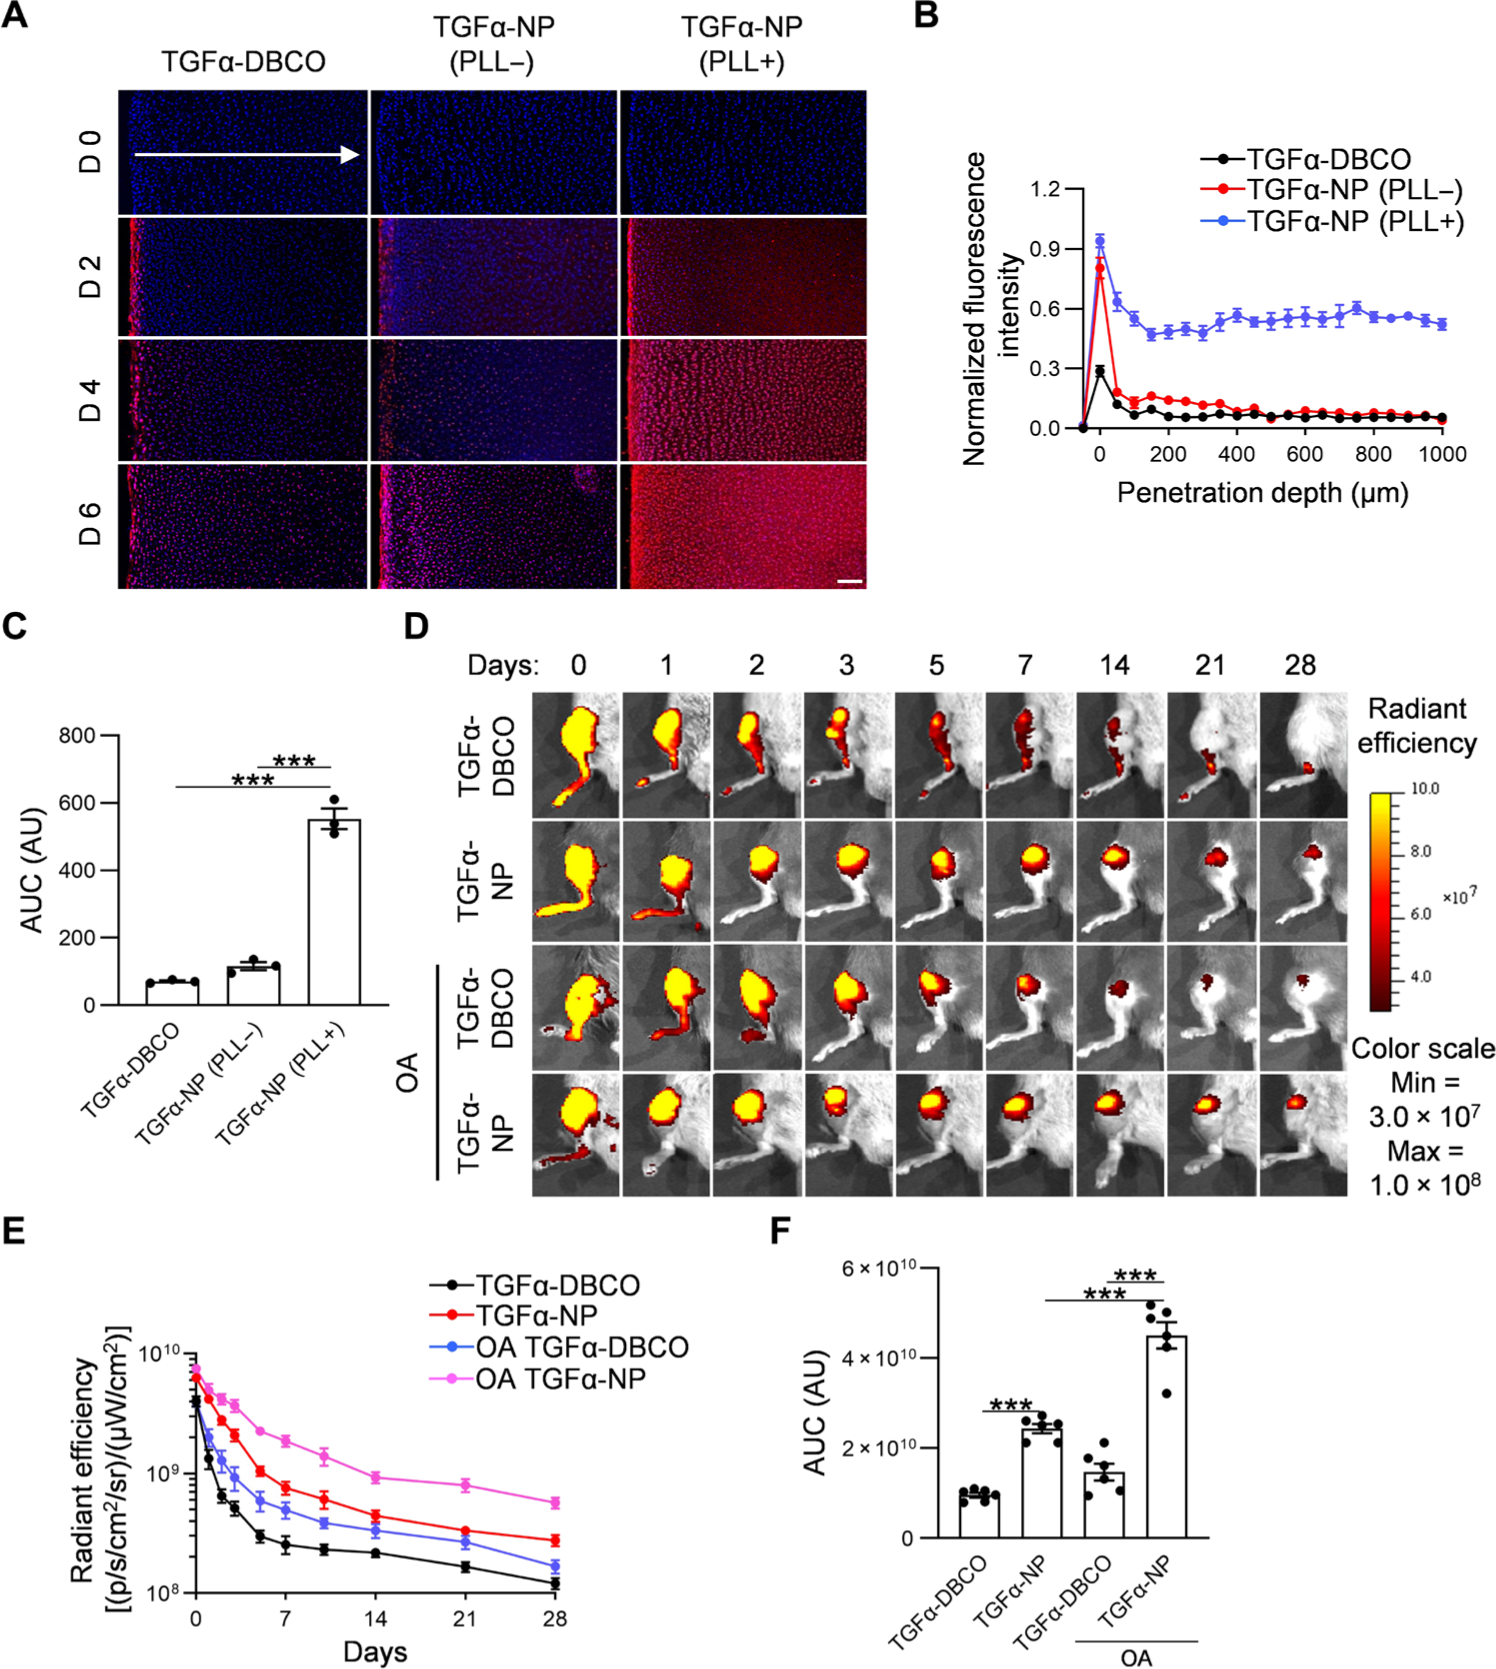
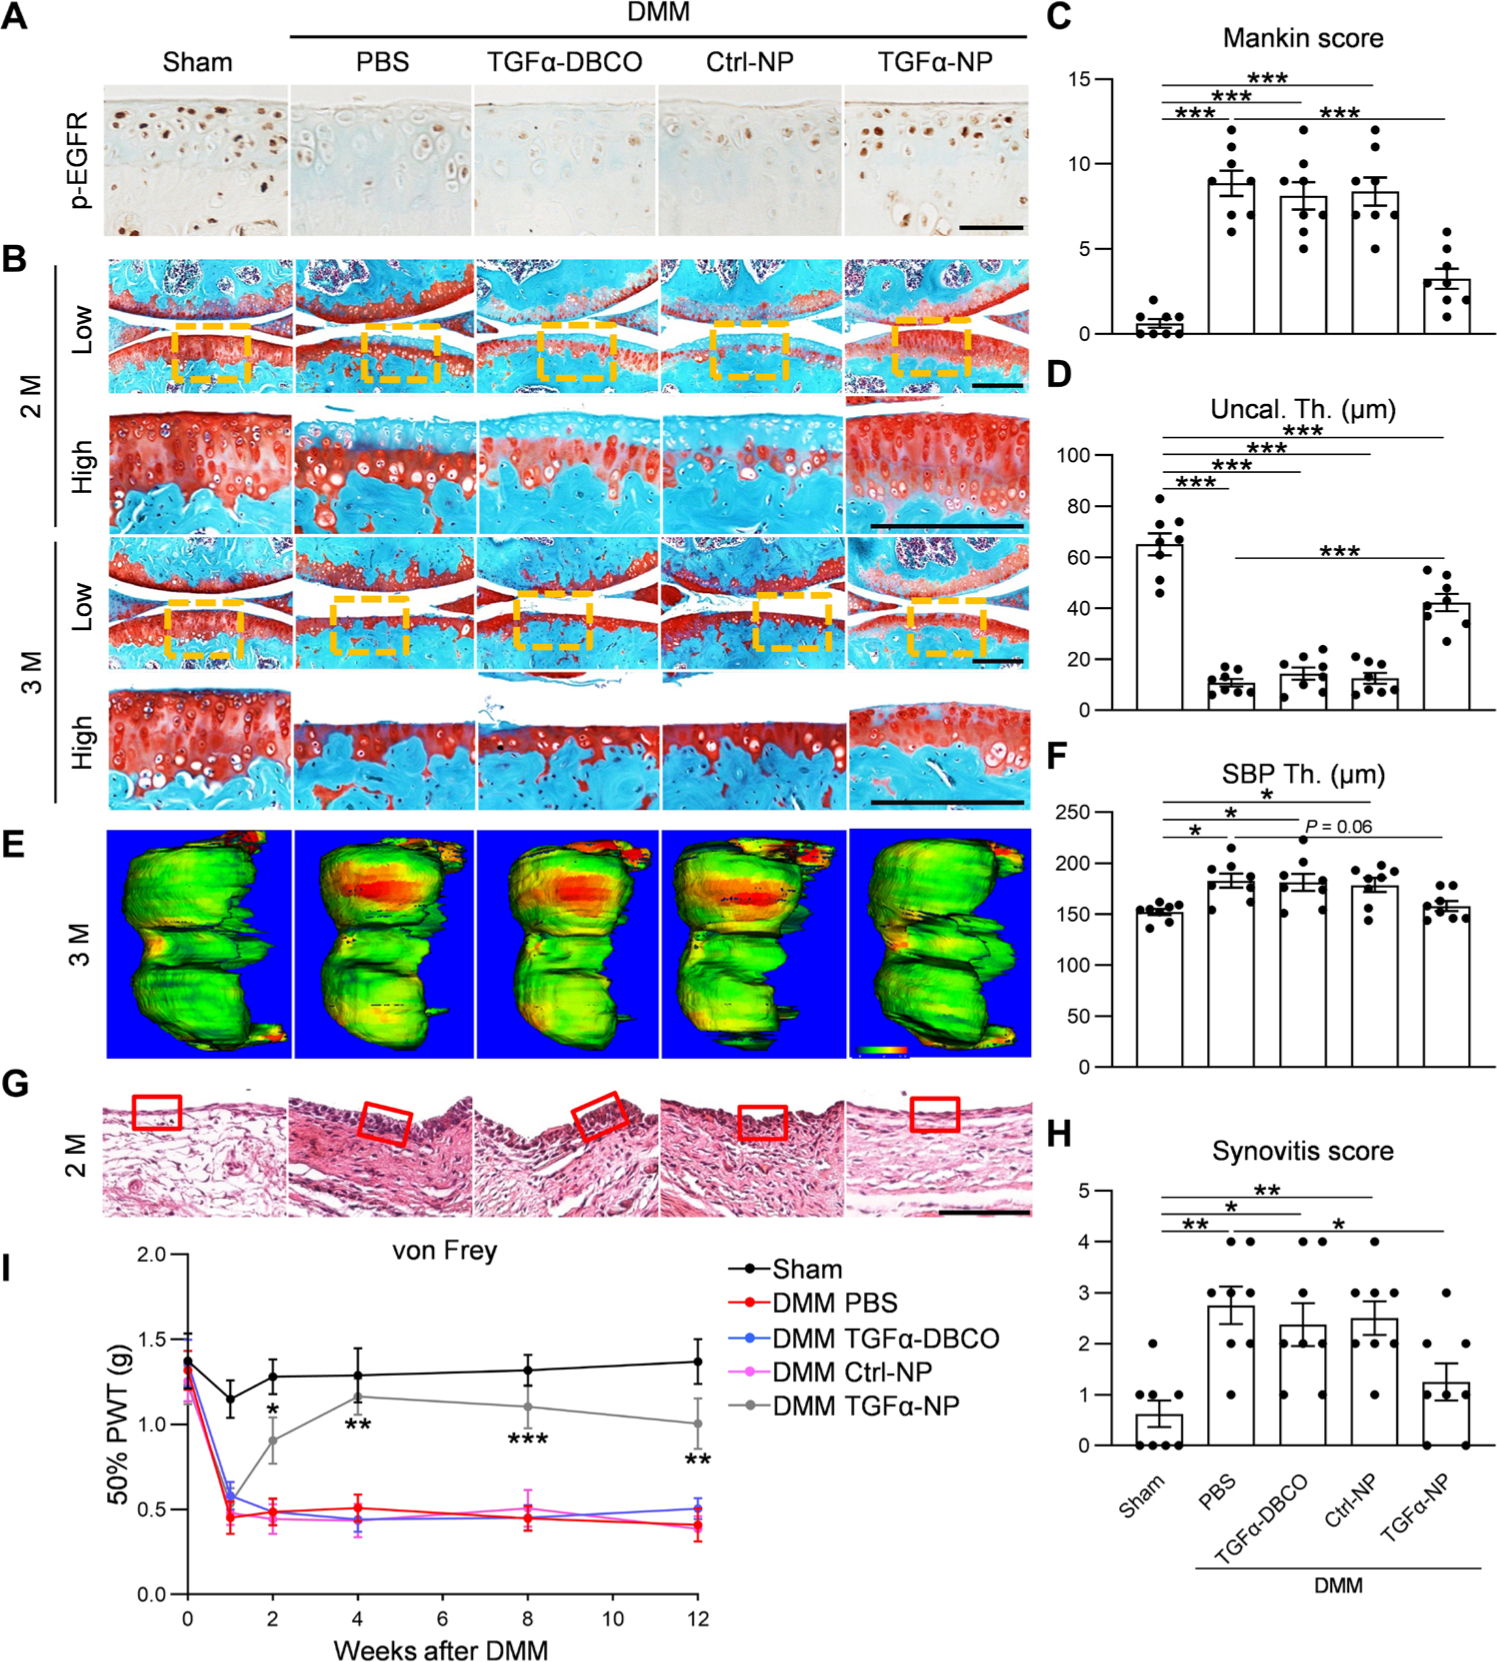
Osteoarthritis (OA) is a widespread joint disease for which there are no disease-modifying treatments. Previously, we found that mice with cartilage-specific epidermal growth factor receptor (EGFR) deficiency developed accelerated knee OA. To test whether the EGFR pathway can be targeted as a potential OA therapy, we constructed two cartilage-specific EGFR overactivation models in mice by overexpressing heparin binding EGF-like growth factor (HBEGF), an EGFR ligand. Compared to wild type, Col2-Cre HBEGF-overexpressing mice had persistently enlarged articular cartilage from adolescence, due to an expanded pool of chondroprogenitors with elevated proliferation ability, survival rate, and lubricant production. Adult Col2-Cre HBEGF-overexpressing mice and Aggrecan-CreER HBEGF-overexpressing mice were resistant to cartilage degeneration and other signs of OA after surgical destabilization of the medial meniscus (DMM). Treating mice with gefitinib, an EGFR inhibitor, abolished the protective action against OA in HBEGF-overexpressing mice. Polymeric micellar nanoparticles (NPs) conjugated with transforming growth factor-α (TGFα), a potent EGFR ligand, were stable and nontoxic and had long joint retention, high cartilage uptake, and penetration capabilities. Intra-articular delivery of TGFα-NPs effectively attenuated surgery-induced OA cartilage degeneration, subchondral bone plate sclerosis, and joint pain. Genetic or pharmacologic activation of EGFR revealed no obvious side effects in knee joints and major vital organs in mice. Together, our studies demonstrate the feasibility of using nanotechnology to target EGFR signaling for OA treatment.


Conflict of interest statement

Competing interests: L.Q., Z.C., and Y.W. are listed on a patent associated with this manuscript, “Targeting Cartilage EGFR Pathway for Osteoarthritis Treatment,” U.S. Provisional Patent Application no. 63/067,546. A.T. is an inventor on patent US20160032346A1, “Sortase-mediated protein purification and ligation,” which was used for the site-specific modification of TGFα with DBCO.

Figures

Fig. 1.
Fig. 1.. Overexpression of HBEGF in chondrocytes expands mouse growth plate and articular cartilage without affecting the gross appearance of knee joints.
(A) Western blot of HBEGF and EGFR downstream signals (p-EGFR and p-ERK) in articular cartilage chondrocytes derived from 5-month-old HBEGF OverCol2 mice. n = 3 independent experiments. (B) Safranin O/Fast Green staining of knee joints from 5- or 12-month-old HBEGF OverCol2 and control littermates (WT). M, month. Scale bars, 1 mm. n = 3 mice per group. (C) Safranin O/Fast Green staining of tibial growth plate in WT and HBEGF OverCol2 mice at 1 and 5 months of age. Scale bar, 200 μm. (D) The thicknesses (Th.) of the proliferative zone (PZ) and hypertrophic zone (HZ) in the growth plate of 1-month-old mice. n = 5 mice per group. (E) The growth plate thickness (GP Th.) quantified from 1- and 5-month-old mice. n = 5 mice per group. (F) Safranin O/Fast Green staining of articular cartilage in WT and HBEGF OverCol2 knee joints at 1 and 5 months of age. Scale bar, 200 μm. (G) Average thicknesses of the uncalcified zone (Uncal. Th.), calcified zone (Cal. Th.), and total tibial articular cartilage quantified from 1- and 5-month-old mice. n = 8 mice per group. Statistical analysis was performed using two-way ANOVA with Bonferroni’s post hoc analysis. Data are presented as means ± SEM. *P < 0.05, **P < 0.01, and ***P < 0.001.
Fig. 2.
Fig. 2.. Overexpression of HBEGF increases chondroprogenitors in articular cartilage.
(A) Hematoxylin and eosin staining of femoral articular cartilage from WT and HBEGF OverCol2 mice at 1 and 5 months of age. Scale bar, 50 μm. (B) Chondrocyte numbers (CH) in superficial zone (SZ), transition and middle zones (TZ + MZ), calcified zone (CZ), and entire femoral articular cartilage quantified at 1 and 5 months of age. n = 8 mice per group. (C) Immunostaining of Ki67, TUNEL, and PRG4 in tibial articular cartilage of 5-month-old WT and HBEGF OverCol2 mice. Scale bar, 50 μm. (D) The percentages of Ki67+, TUNEL+, and Prg4+ cells within articular cartilage were quantified. n = 8 mice per group. (E) Long-term EdU labeling of slow-cycling cells in the tibial articular cartilage of HBEGF OverCol2 mice. Mice received daily EdU injections from postnatal days 4 to 6, and their joints were harvested at 1 and 4 weeks of age for EdU staining. Dashed lines outline periarticular layer (1 week of age) and articular cartilage (4 weeks of age) for analysis. Scale bar, 100 μm. (F) Quantification of EdU+ cells in outlined regions. n = 5 mice per group. (G) CFU-F assay using chondrocytes dissociated from mouse knee joints from 5-month-old WT and HBEGF OverCol2 mice. Scale bar, 0.5 cm. (H) Quantification of CFU-F frequency. n = 5 mice per group. (I) Proliferation of primary chondroprogenitors from 5-month-old WT or HBEGF OverCol2 knee joints. Cells were seeded at the same density on day 0, and their numbers were counted every other day. n = 5 independent experiments. (J) Apoptosis assay of primary chondrocytes from 5-month-old WT and HBEGF OverCol2 knee joints. Cells were incubated with or without TNFα (25 ng/ml) or vehicle (Veh; PBS) for 2 days before analysis. n = 5 independent experiments. (K) qRT-PCR analyzes the relative gene expression in chondroprogenitors from WT and HBEGF OverCol2 knee joints undergoing 2 weeks of chondrogenic differentiation. n = 3 independent experiments. (L) Alcian blue staining of chondroprogenitors after 2 weeks of chondrogenic differentiation. Scale bar, 200 μm. n = 3 independent experiments. Statistical analysis was performed using two-way ANOVA with Tukey’s post hoc analysis for (B), (F), and (J) and unpaired t test for (D), (H), (I), and (K). Data are presented as means ± SEM. *P < 0.05, **P < 0.01, and ***P < 0.001.
Fig. 3.
Fig. 3.. Overexpressing HBEGF in articular cartilage delays OA progression.
(A) Schematic showing the study protocol of WT and HBEGF OverCol2 mice with DMM surgery at 3 months of age. H indicates time points when histology was performed. (B) Safranin O/Fast Green staining of DMM and sham joints at the medial site from 5- and 7-month-old WT and HBEGF OverCol2 mice. Low: low-magnification image; high: high-magnification image of the yellow boxed area above. Scale bars, 200 μm. (C) The OA severity was measured by Mankin score. n = 8 mice per group. (D) Schematic showing the study protocol of WT and HBEGF OverAgcER mice with tamoxifen (Tam) injections and DMM surgery at 3 months of age. (E) Safranin O/Fast Green staining of WT and HBEGF OverAgcER DMM and sham joints at the medial site from mice 7 months of age. Scale bars, 200 μm. (F) The OA severity was measured by Mankin score. n = 8 mice per group. (G) Nanoindentation assay was performed on the femoral cartilage surface at 1 month after surgery. Eind, modulus. n = 4 to 5 mice per group. Statistical analysis was performed using two-way ANOVA with Tukey’s post hoc analysis. Data are presented as means ± SEM. *P < 0.05, **P < 0.01, and ***P < 0.001.
Fig. 4.
Fig. 4.. The protective action of HBEGF overexpression on articular cartilage during OA development is EGFR dependent.
(A) Safranin O/Fast Green staining of vehicle- and gefinitib (Gef)–treated WT and HBEGF OverAgcER knee joints at the medial site 2 months after surgery. Low: low-magnification image; high: high-magnification image of the yellow boxed area above. Scale bars, 200 μm. (B) The OA severity was measured by Mankin score. n = 8 mice per group. (C) Average thicknesses of uncalcified (Uncal. Th.) and total (Total Th.) cartilage quantified at 2 months after surgery. n = 8 mice per group. (D) von Frey assay was performed at 0, 1, 2, 4, and 8 weeks after surgery. PWT, paw withdrawal threshold. n = 8 mice per group. Statistical analysis was performed using one-way ANOVA with Tukey’s post hoc analysis for (D) and two-way ANOVA with Tukey’s post hoc analysis for (B) and (C). Data are presented as means ± SEM. *P < 0.05, **P < 0.01, and ***P < 0.001 in (B) and (C). *P < 0.05 and ***P < 0.001 for DMM WT versus sham WT; $$$P < 0.001 for DMM HBEGF OverAgcER versus DMM WT; &&&P < 0.001 for DMM HBEGF OverAgcER versus DMM HBEGF OverAgcER Gef in (D).
Fig. 5.
Fig. 5.. Preparation and characterization of TGFα-NPs.
(A) Schematic diagram of TGFα-NPs. TGFα-NPs were prepared by conjugating TGFα onto polymeric micellar NPs via copper-free click chemistry. (B) Dynamic light scattering (DLS) measurements of TGFα-NP hydrodynamic diameter (size) and representative image of TGFα-NPs examined by transmission electron microscopy. Scale bar, 100 nm. (C) Zeta potential measurements of TGFα-DBCO, PEG-PCL NPs with or without PLL-PCL, and TGFα-NPs with or without PLL-PCL in 0.1× PBS (pH 7.4). PLL+ denotes the NPs that contain PLL-PCL, and PLL− denotes the NPs that do not contain PLL-PCL. n = 3 independent experiments. (D) Stability of TGFα-NPs in water was evaluated by monitoring DLS measurement of TGFα-NP hydrodynamic diameter for up to 7 days. n = 3 independent experiments. (E) Stability of TGFα-NPs in bovine synovial fluid of knee joint was evaluated by monitoring DLS measurement of TGFα-NP hydrodynamic diameter for up to 24 hours. n = 3 independent experiments. (F) Cell viability of primary mouse chondrocytes after incubation with TGFα-NPs at different concentrations. n = 3 independent experiments. (G) Western blot of EGFR downstream signal (p-ERK) in articular cartilage chondrocytes treated by vehicle (PBS), free TGFα (15 ng/ml), Ctrl-NPs (i.e., no TGFα conjugation), or TGFα-NPs (15 or 100 ng/ml of TGFα content). (H) Quantitative analysis of the relative protein amount (p-ERK/ERK) based on the images of Western blot as in (G). n = 3 independent experiments. (I) Confocal images of mouse primary chondrocytes treated with vehicle (PBS), TGFα-NPs (10 nM TGFα content), or TGFα-NPs (10 nM TGFα content) in the presence of free TGFα (100 μg/ml). Scale bar, 50 μm. n = 3 independent experiments. Statistical analysis was performed using one-way ANOVA with Dunnett’s post hoc analysis. Data are presented as means ± SEM. **P < 0.01 and ***P < 0.001.
Fig. 6.
Fig. 6.. TGFα-NPs exhibit full-length penetration of human-thickness bovine articular cartilage and extend residence time in both healthy and diseased knee joints.
(A) Representative confocal microscopy images of a cross section of bovine cartilage explants incubated with rhodamine-labeled TGFα-NPs with or without PLL-PCL or free TGFα for 2, 4, and 6 days. Arrow indicates the diffusion direction. Scale bar, 200 μm. (B) Quantitative analysis of TGFα-NP penetration depth into bovine cartilage explants after 6-day incubation. n = 3 per group. (C) Quantitative analysis of area under the curve (AUC) based on fluorescence intensity profiles in (B). n = 3 per group. (D) Representative fluorescence images of healthy and OA mouse knee joints over 28 days after intra-articular injection of IRDye 800CW–labeled TGFα or TGFα-NPs. (E) Quantitative analysis of time course fluorescence radiant efficiency within knee joints after intra-articular injection of IRDye 800CW–labeled TGFα or TGFα-NPs. n = 6 per group. (F) Quantitative analysis of area under the curve based on fluorescence intensity profile in (E). n = 6 per group. Statistical analysis was performed using one-way ANOVA with Tukey’s post hoc analysis. Data are presented as means ± SEM. ***P < 0.001. AU, arbitrary units.
Fig. 7.
Fig. 7.. TGFα-NP treatment attenuates OA progression after DMM surgery in mice.
(A) Immunostaining of p-EGFR in mouse knee cartilage at 1 month after sham or DMM surgery. In the DMM group, mice were divided into four groups receiving PBS, TGFα-DBCO, Ctrl-NP, or TGFα-NP intra-articular treatments. Scale bar, 100 μm. n = 3 mice per group. (B) Safranin O/Fast Green staining of knee joints at the medial site at 2 and 3 months after surgery. Low: low-magnification image; high: high-magnification image of the yellow boxed area above. Scale bars, 200 μm. (C) The OA severity of knee joints at 3 months after surgery measured by Mankin score. n = 8 mice per group. (D) Average uncalcified (Uncal. Th.) cartilage thickness of knee joints at 3 months after surgery was quantified. n = 8 mice per group. (E) Representative 3D color maps derived from microCT images showing SBP thickness (SBP Th.). Color ranges from 0 (blue) to 320 μm (red). (F) SBP thickness at the medial posterior site of femoral condyle was calculated. n = 8 mice per group. (G) Hematoxylin and eosin staining of mouse knee joints focusing on synovium at 2 months after surgery. Red boxed areas indicate the synovial tissues. Scale bar, 200 μm. (H) Synovitis score was measured. n = 8 mice per group. (I) von Frey assay was performed at 0, 1, 2, 4, 8, and 12 weeks after surgery. n = 8 per group. Statistical analysis was performed using one-way ANOVA with Tukey’s post hoc analysis. Data are presented as means ± SEM. *P < 0.05, **P < 0.01, and ***P < 0.001 in (C), (D), (F), and (H). *P < 0.05, **P < 0.01, and ***P < 0.001 for DMM TGFα-NP versus DMM PBS in (I).

Comment in

References

    1. GBD 2017 Disease and Injury Incidence and Prevalence Collaborators, Global, regional, and national incidence, prevalence, and years lived with disability for 354 diseases and injuries for 195 countries and territories, 1990–2017: A systematic analysis for the Global Burden of Disease Study 2017. Lancet 392, 1789–1858 (2018). - PMC - PubMed
    1. Loeser RF, Goldring SR, Scanzello CR, Goldring MB, Osteoarthritis: A disease of the joint as an organ. Arthritis Rheumatol. 64, 1697–1707 (2012). - PMC - PubMed
    1. Becerra J, Andrades JA, Guerado E, Zamora-Navas P, Lopez-Puertas JM, Reddi AH, Articular cartilage: Structure and regeneration. Tissue Eng. Part B Rev 16, 617–627 (2010). - PubMed
    1. Glasson SS, Chambers MG, Van Den Berg WB, Little CB, The OARSI histopathology initiative—Recommendations for histological assessments of osteoarthritis in the mouse. Osteoarthr. Cartil 18, S17–S23 (2010). - PubMed
    1. Pritzker KP, Gay S, Jimenez SA, Ostergaard K, Pelletier JP, Revell PA, Salter D, van den Berg WB, Osteoarthritis cartilage histopathology: Grading and staging. Osteoarthr. Cartil 14, 13–29 (2006). - PubMed

Publication types