. 2021 Feb 17;41(7):1418-1428.
doi: 10.1523/JNEUROSCI.1554-20.2020. Epub 2021 Jan 13.

Evidence for Subcortical Plasticity after Paired Stimulation from a Wearable Device

Affiliations

Evidence for Subcortical Plasticity after Paired Stimulation from a Wearable Device

Maria Germann et al. J Neurosci. .

Abstract

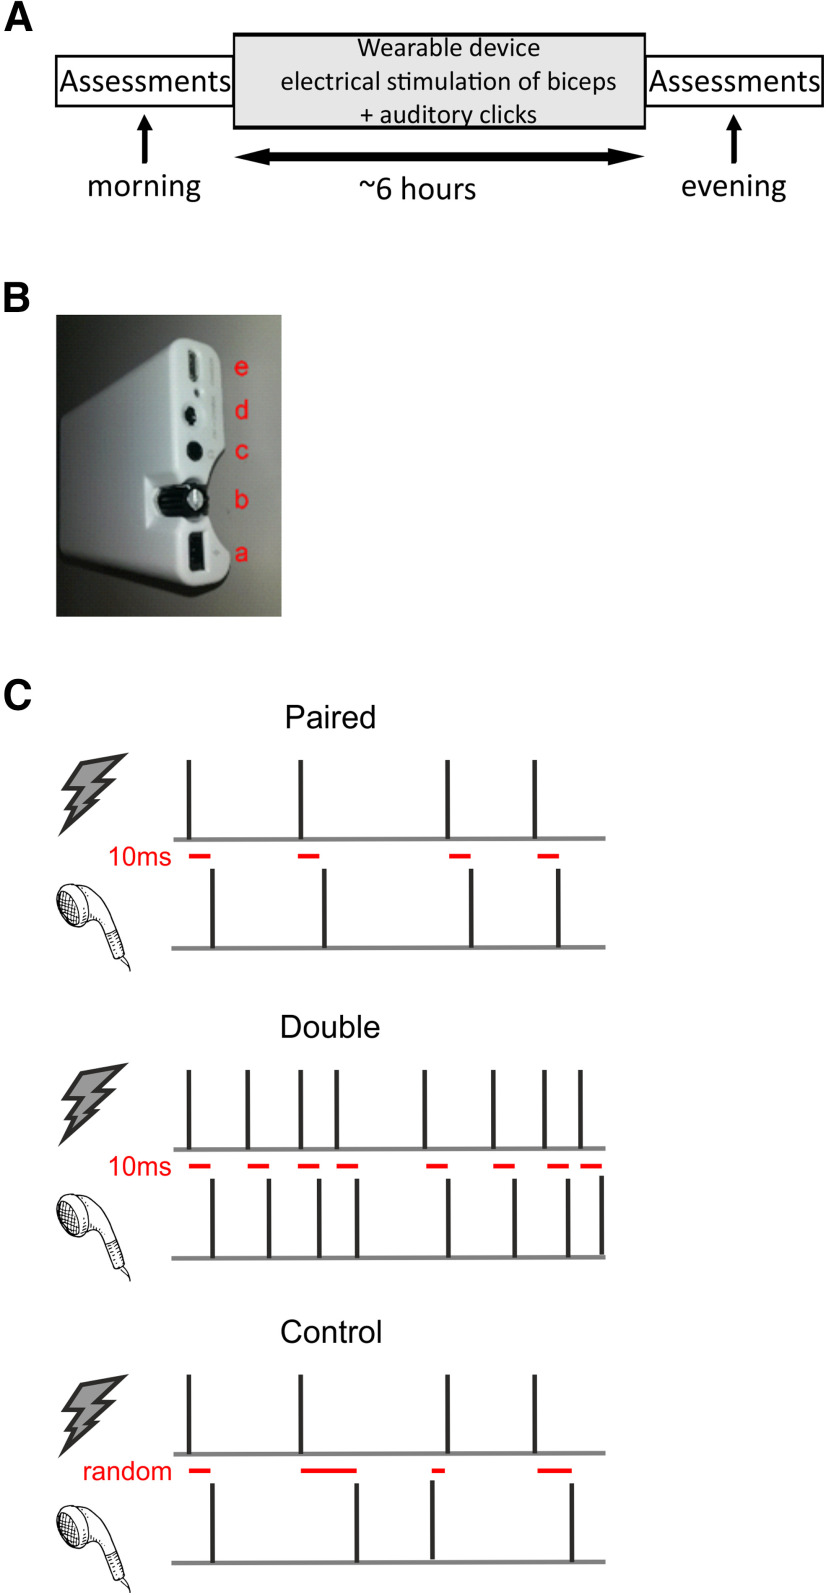
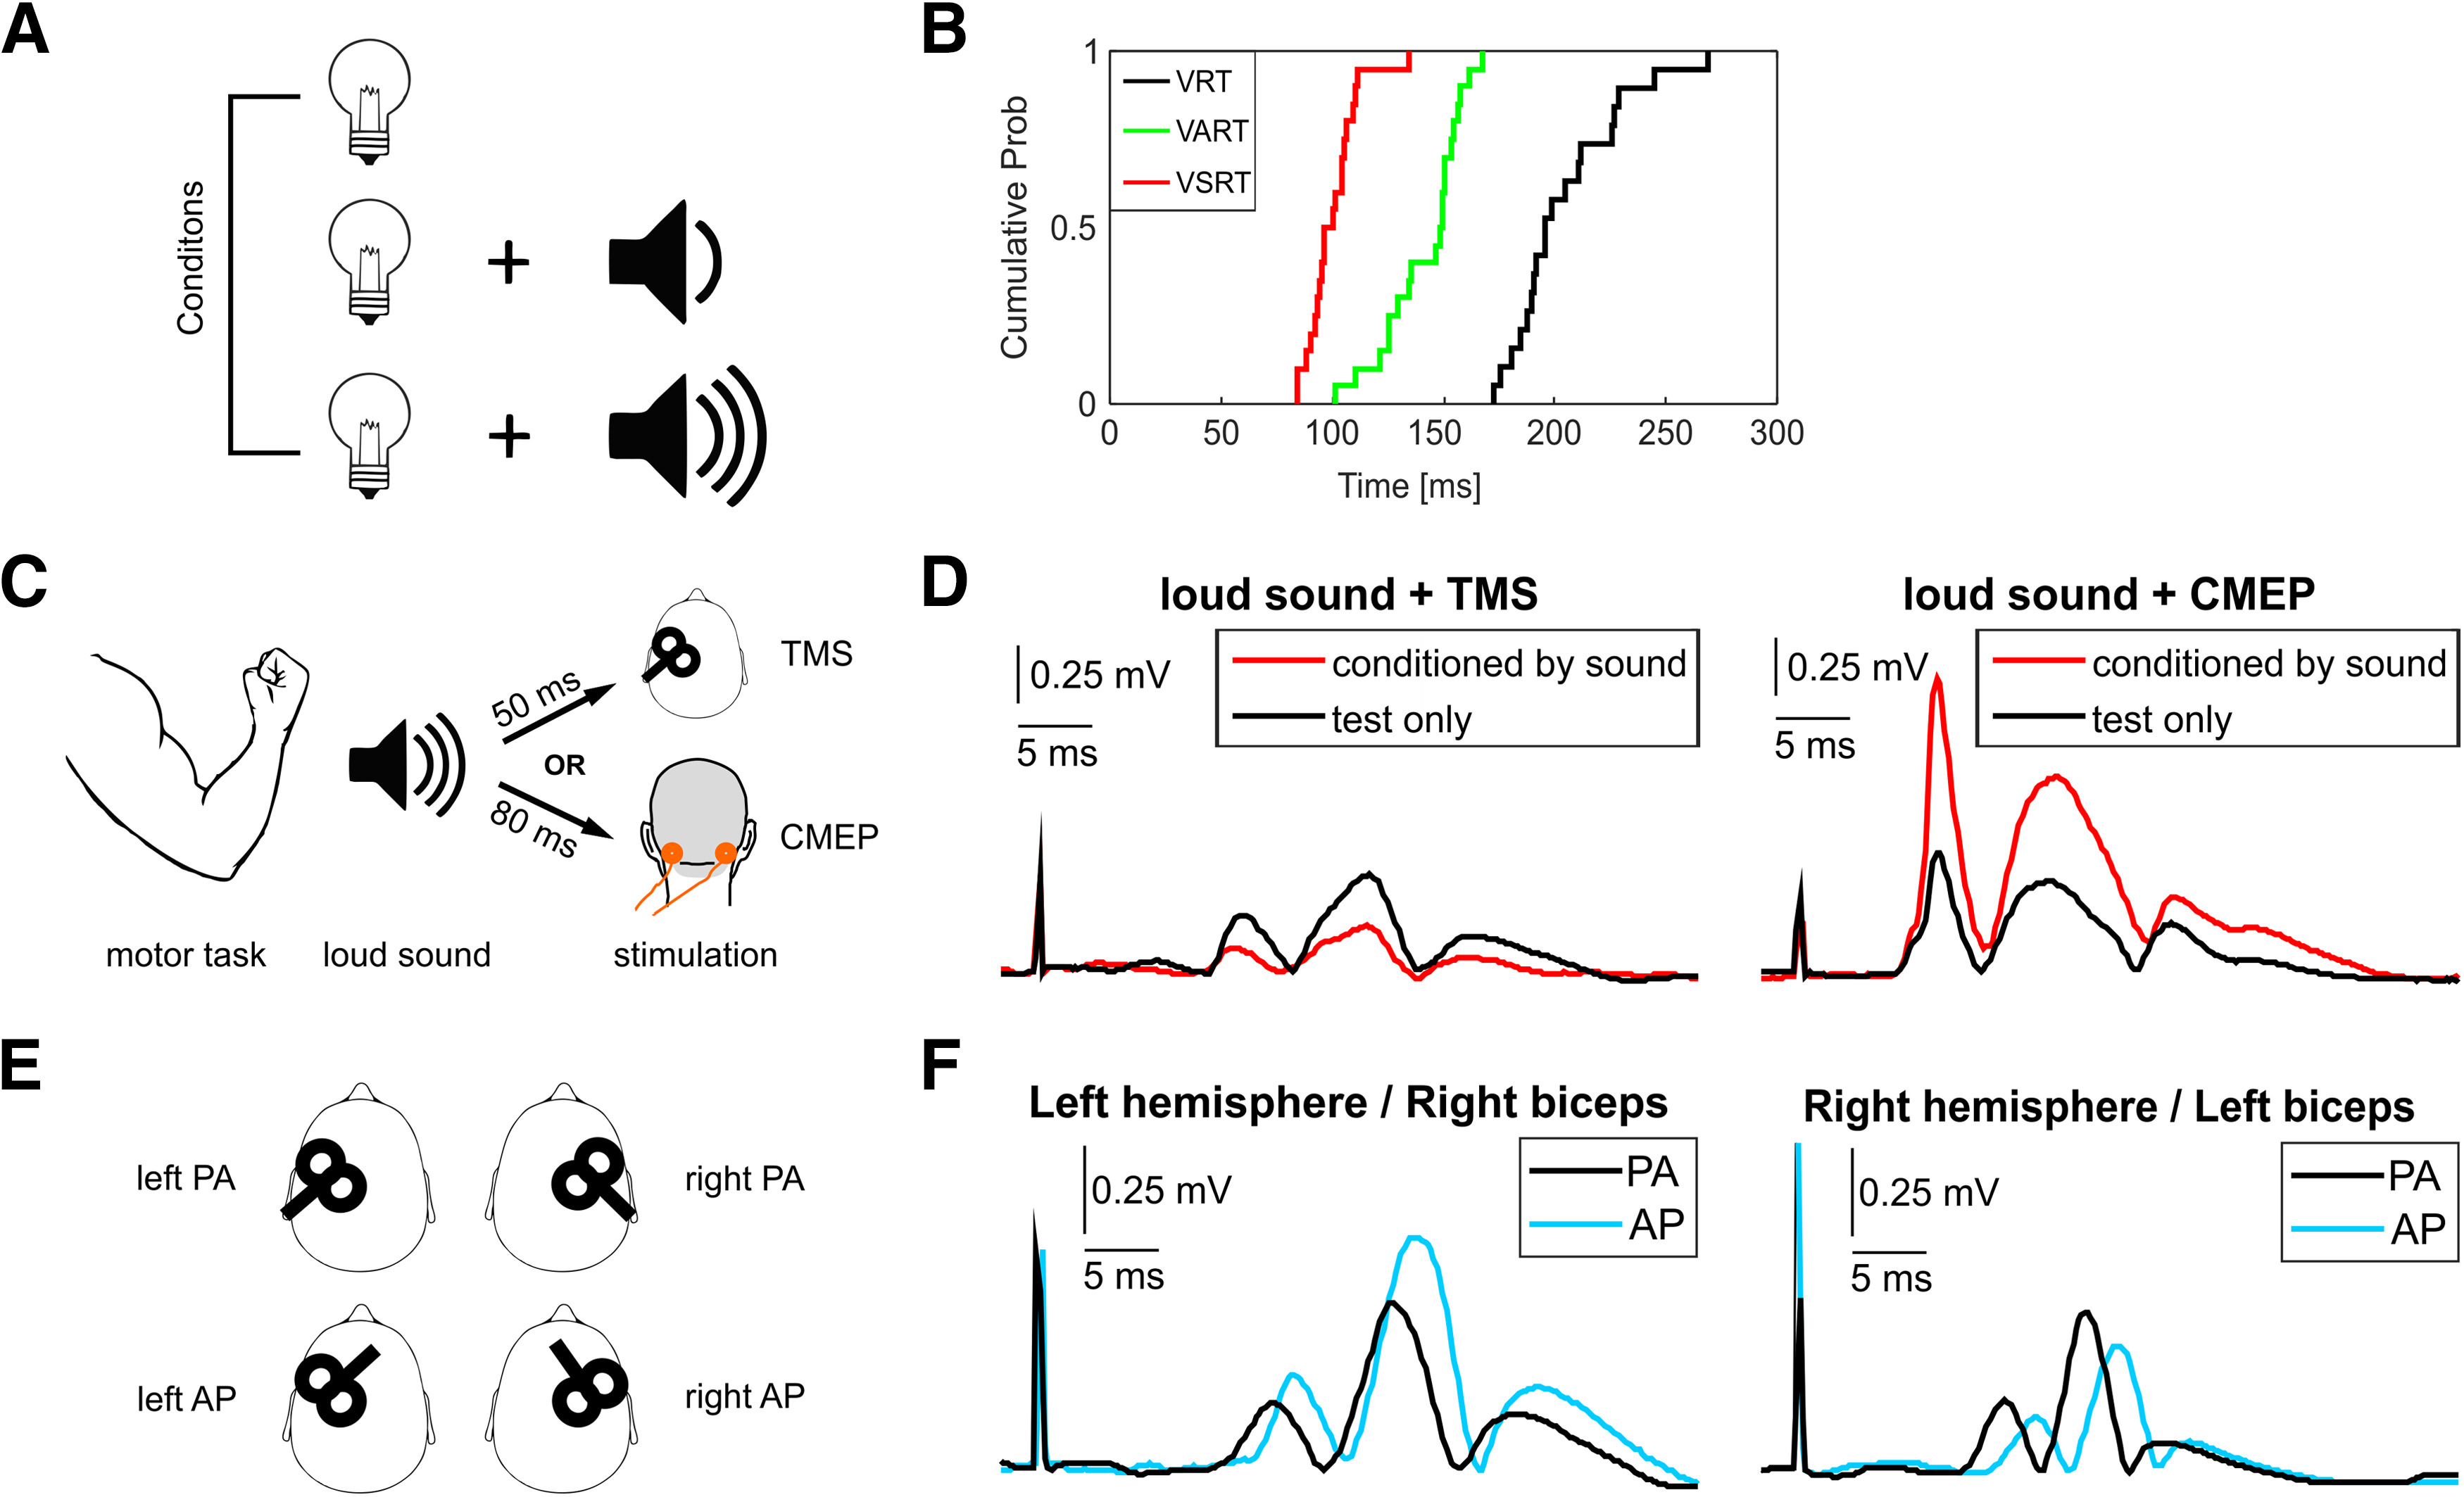
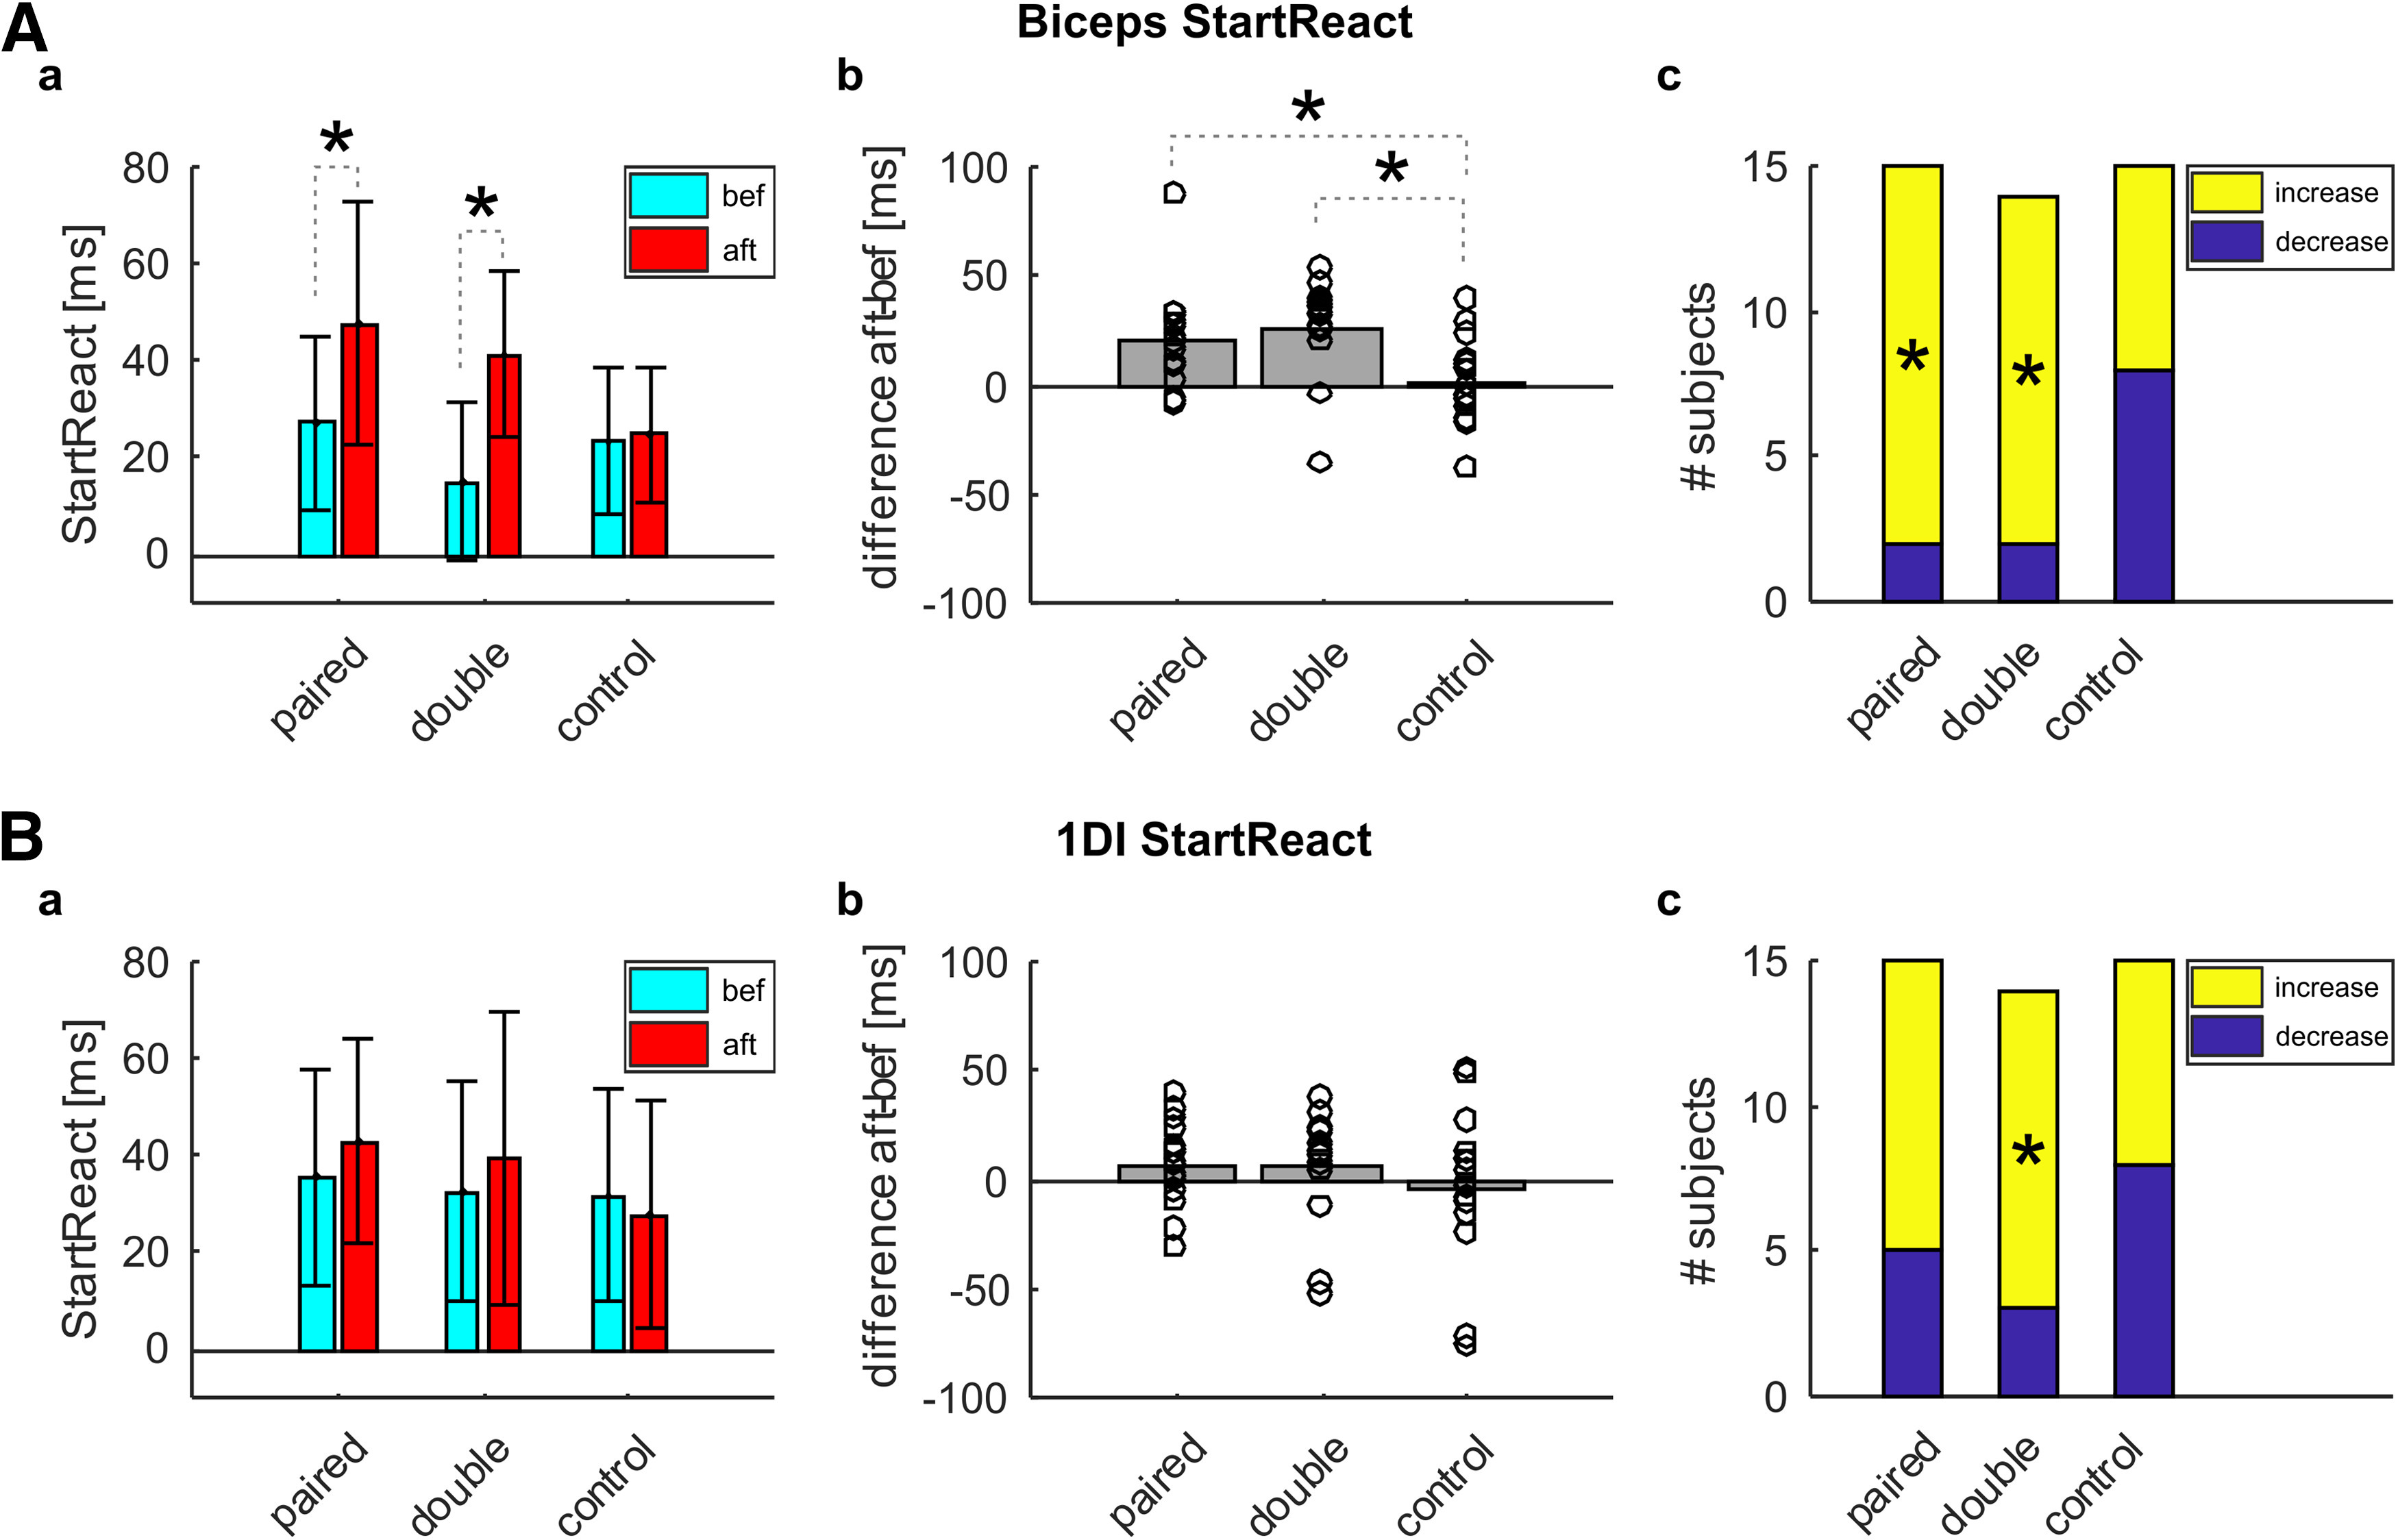
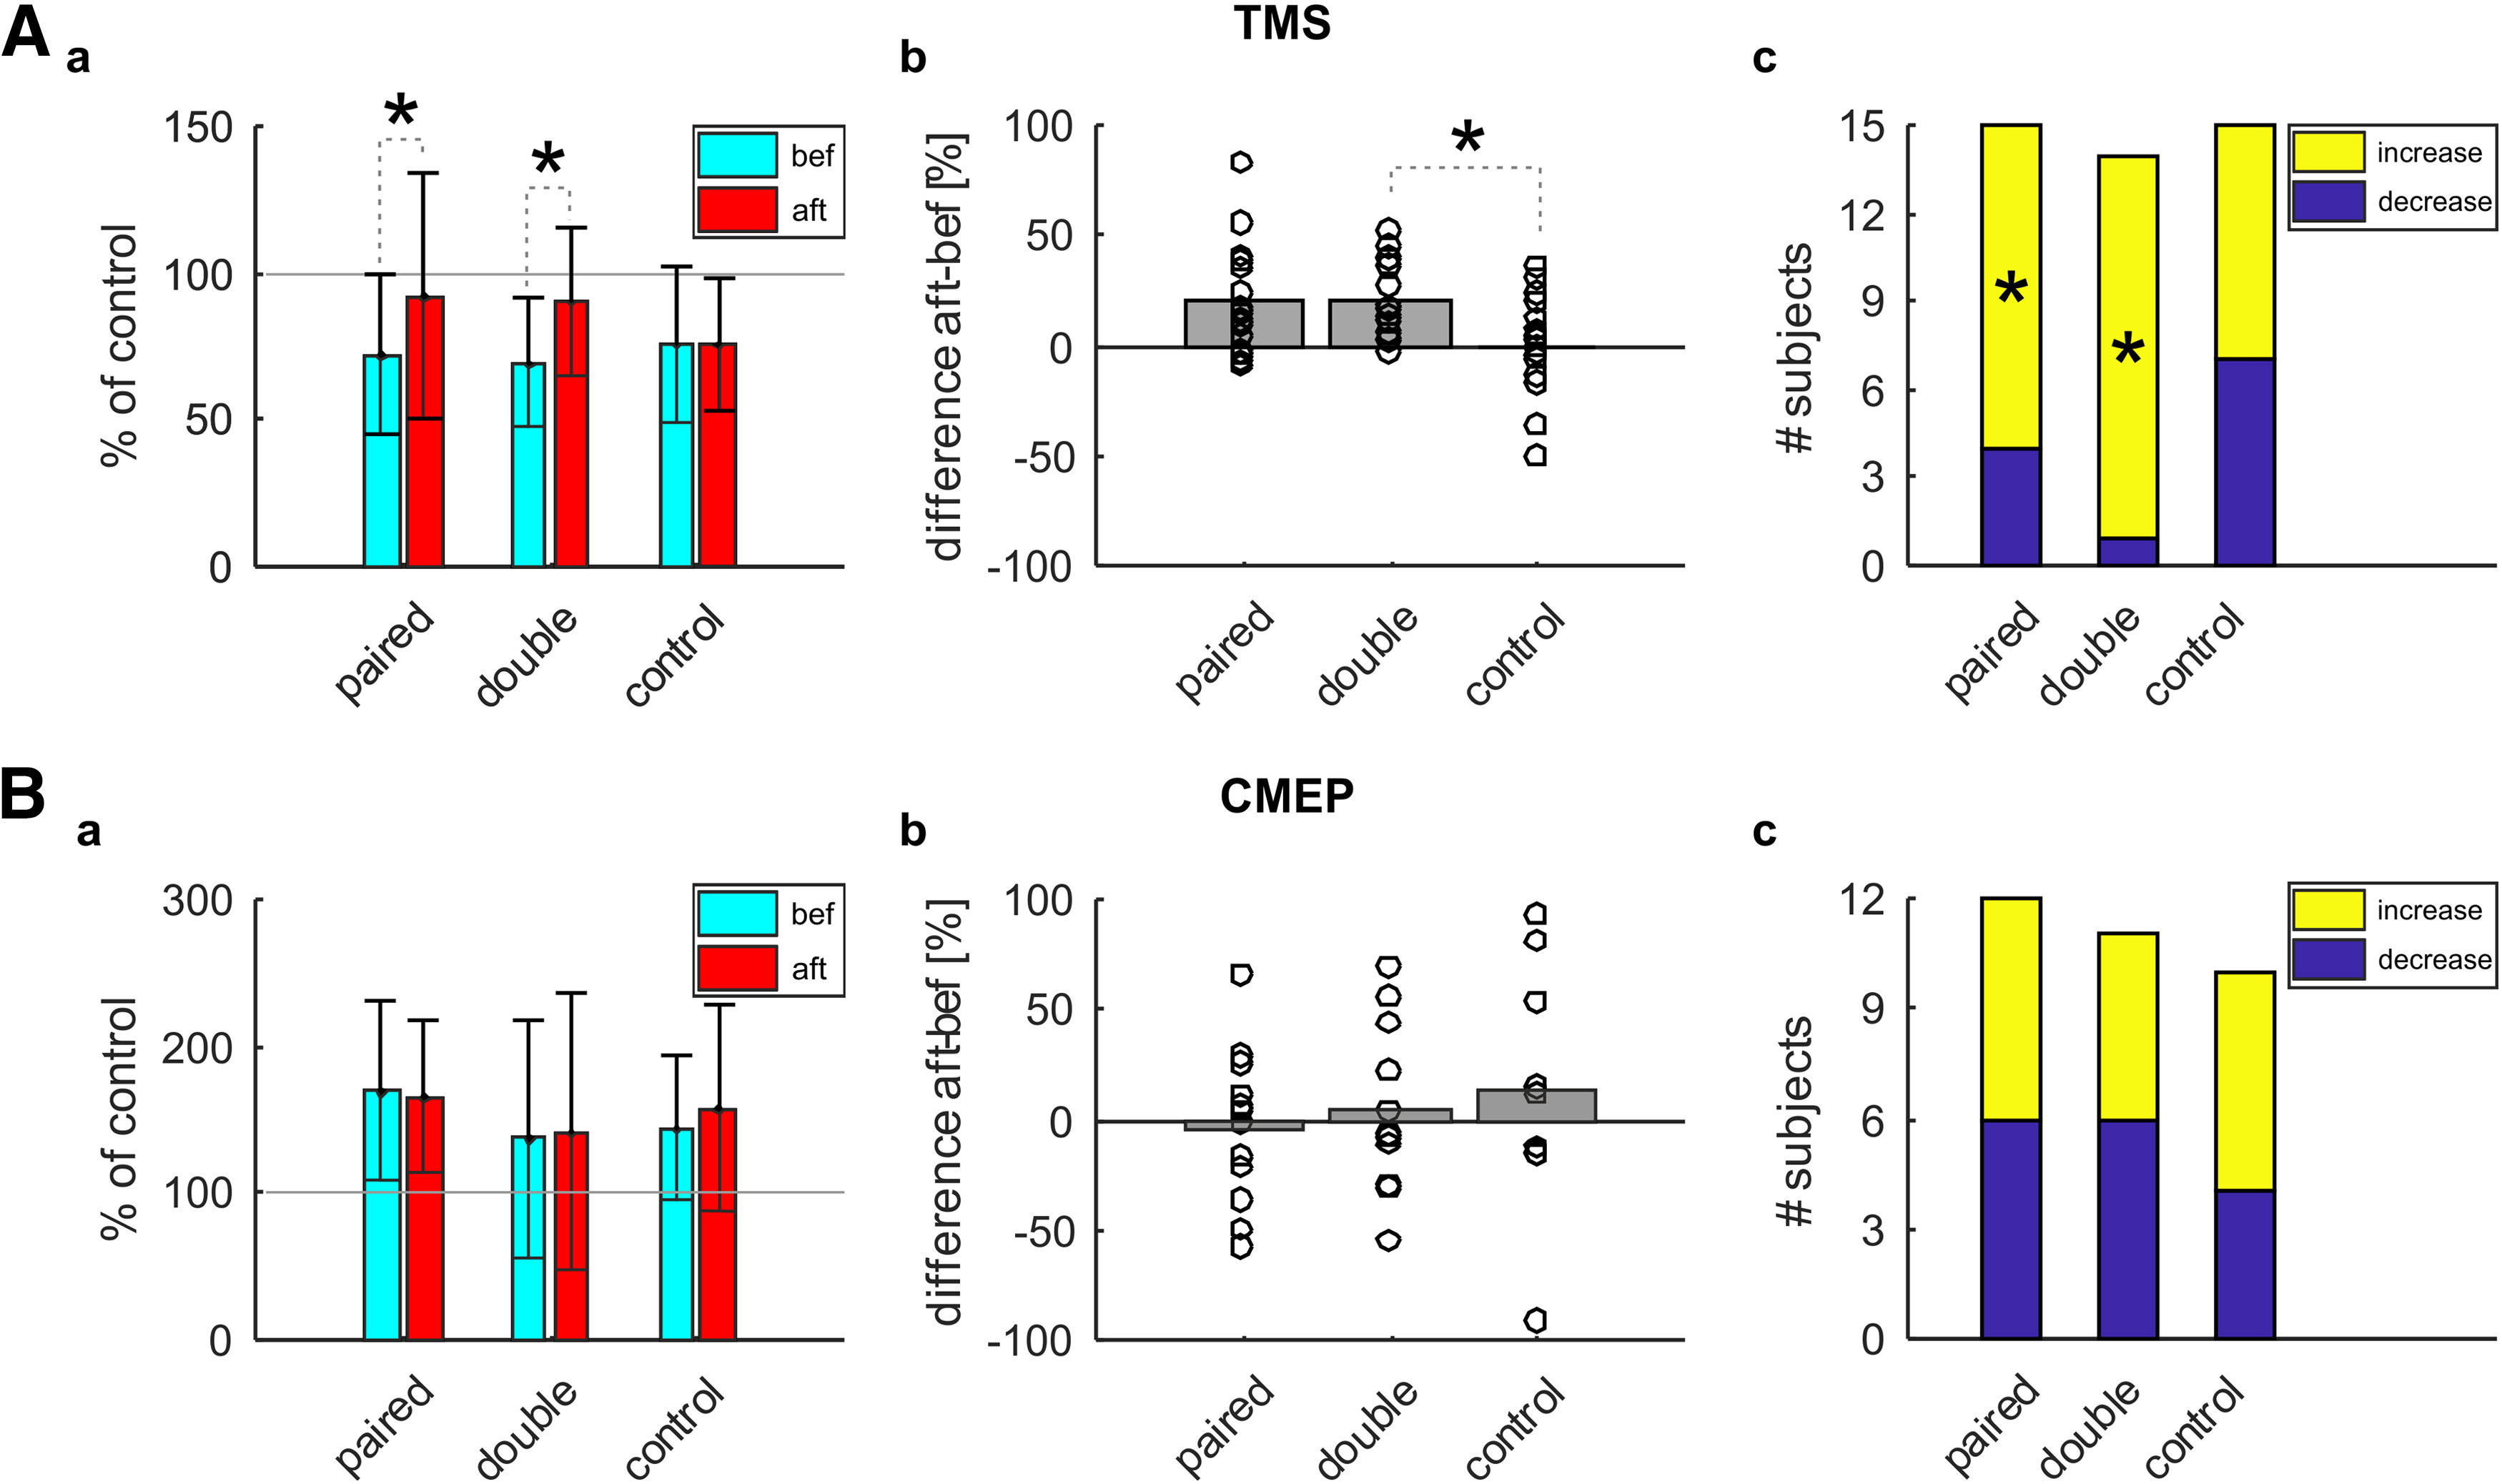
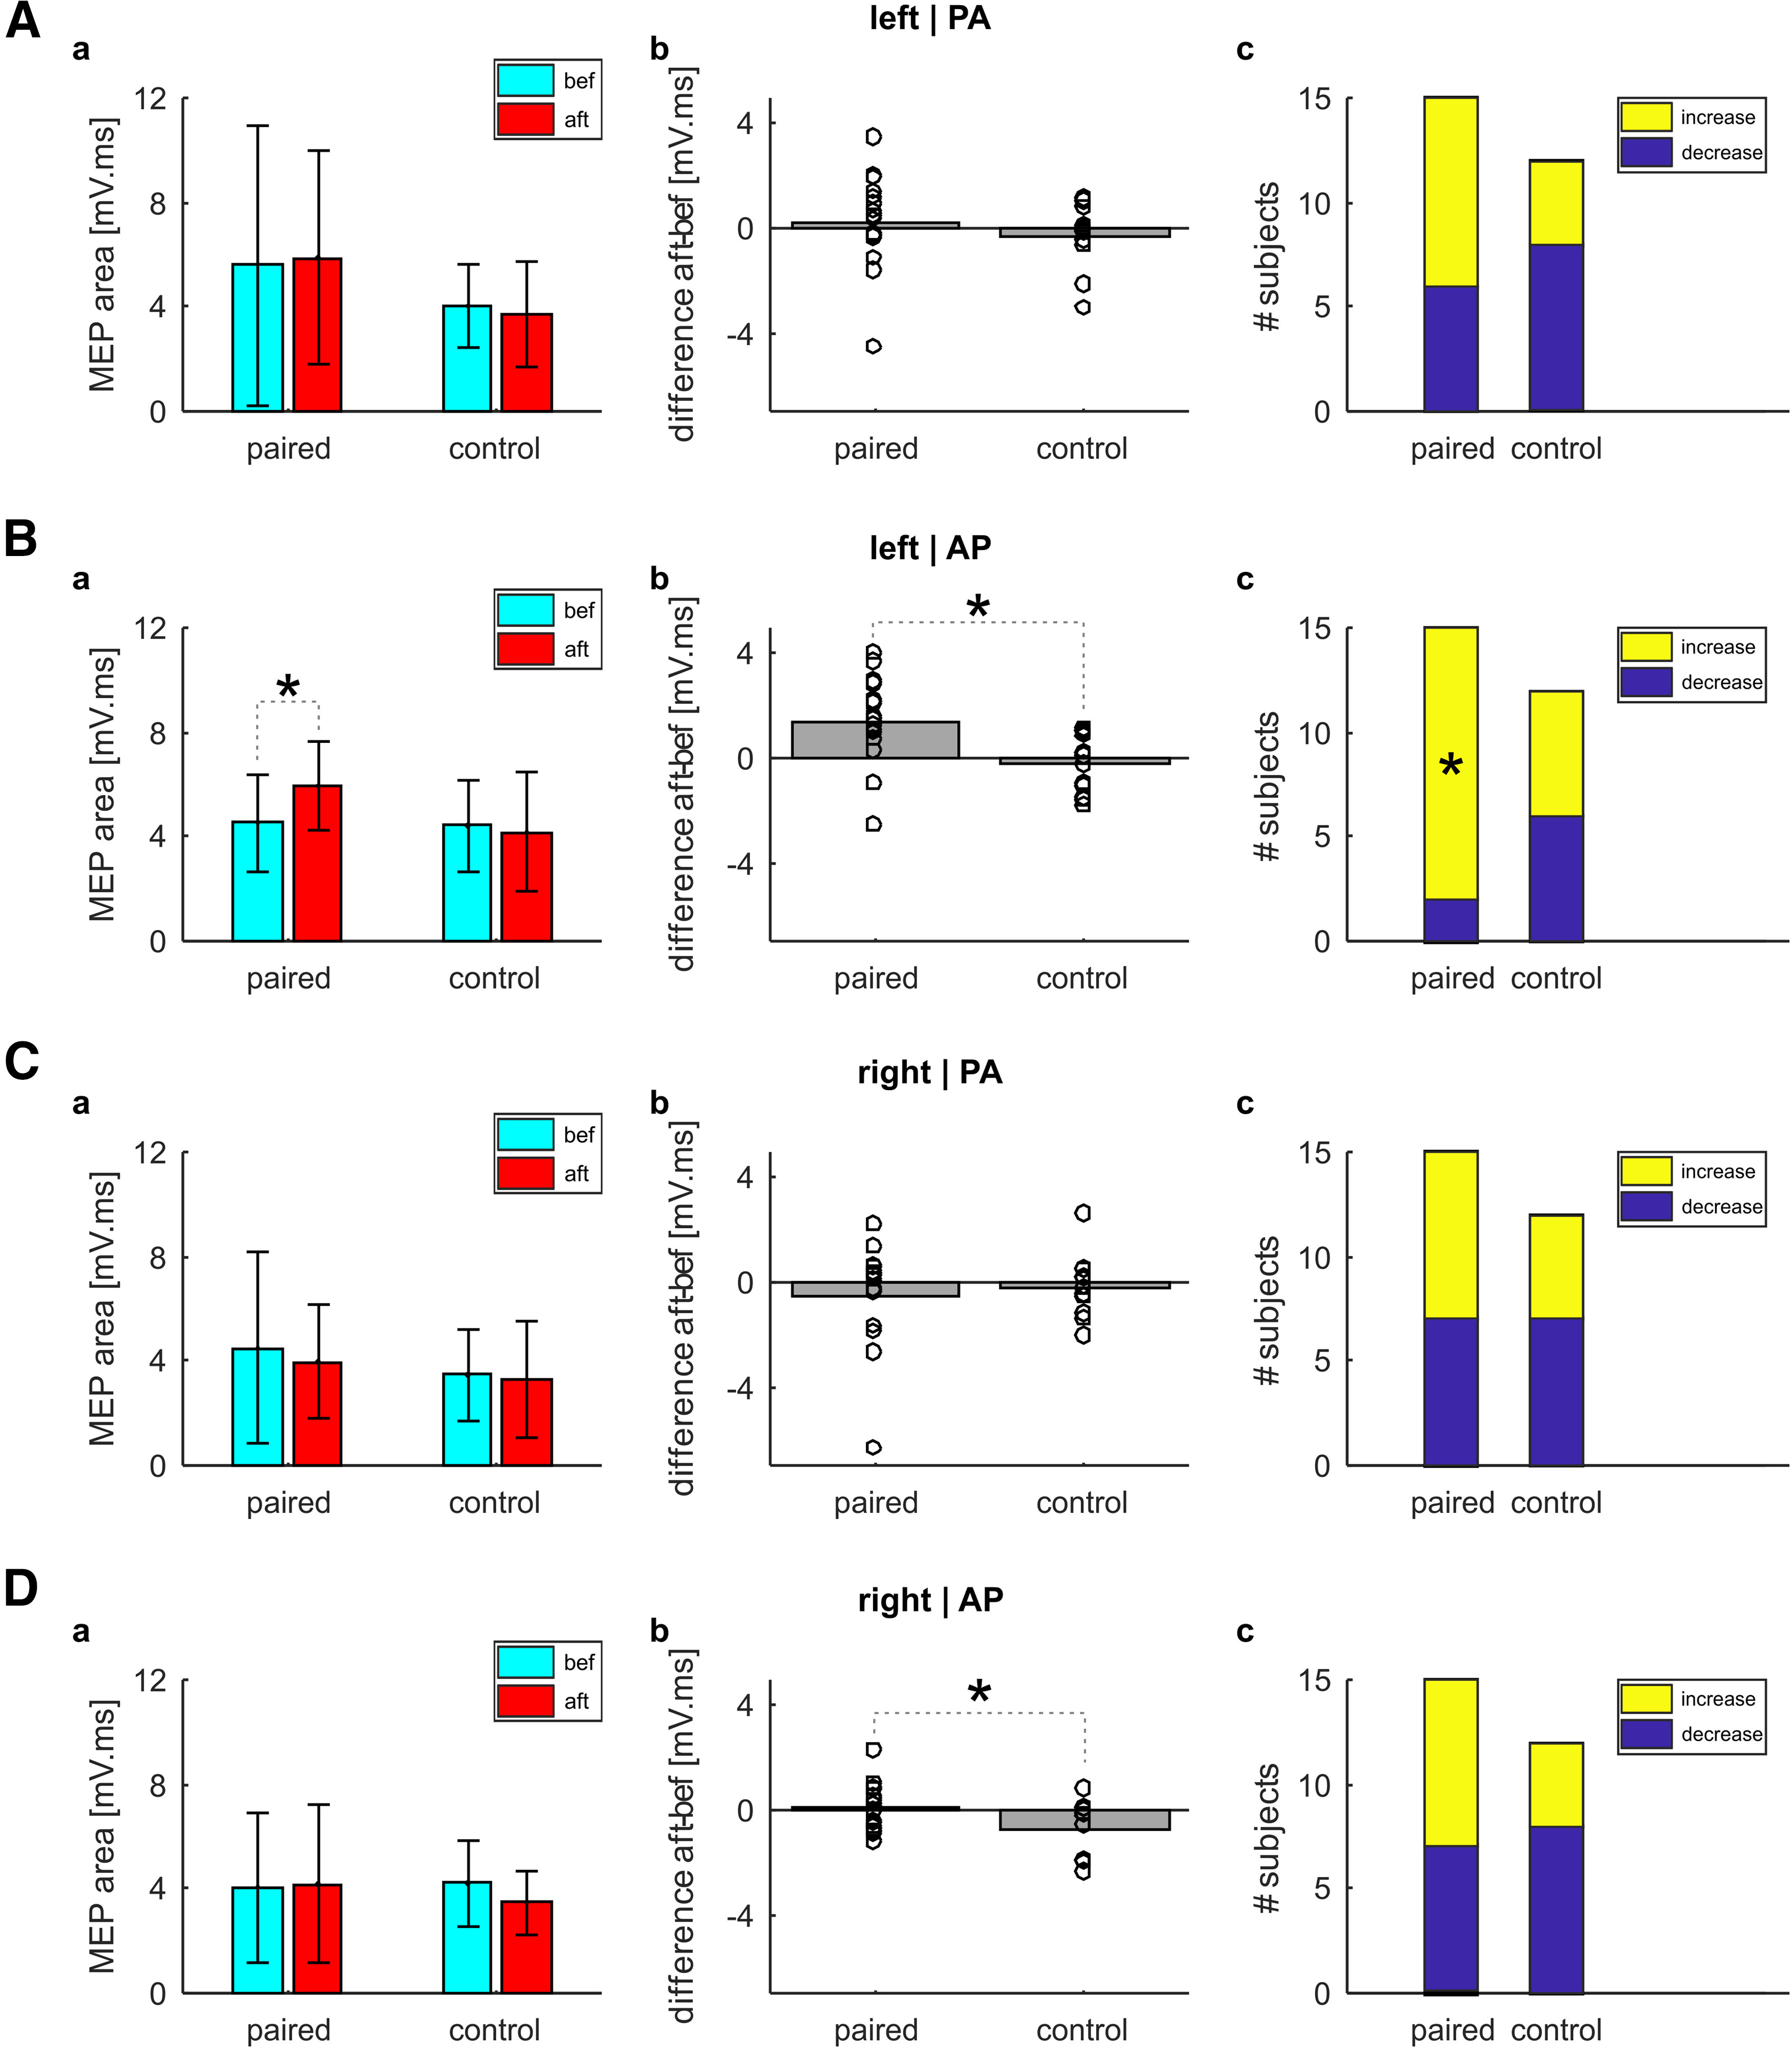
Existing non-invasive stimulation protocols can generate plasticity in the motor cortex and its corticospinal projections; techniques for inducing plasticity in subcortical circuits and alternative descending pathways such as the reticulospinal tract (RST) are less well developed. One possible approach developed by this laboratory pairs electrical muscle stimulation with auditory clicks, using a wearable device to deliver stimuli during normal daily activities. In this study, we applied a variety of electrophysiological assessments to male and female healthy human volunteers during a morning and evening laboratory visit. In the intervening time (∼6 h), subjects wore the stimulation device, receiving three different protocols, in which clicks and stimulation of the biceps muscle were paired at either low or high rate, or delivered at random. Paired stimulation: (1) increased the extent of reaction time shortening by a loud sound (the StartReact effect); (2) decreased the suppression of responses to transcranial magnetic brain stimulation (TMS) following a loud sound; (3) enhanced muscle responses elicited by a TMS coil oriented to induce anterior-posterior (AP) current, but not posterior-anterior (PA) current, in the brain. These measurements have all been suggested to be sensitive to subcortical, possibly reticulospinal, activity. Changes were similar for either of the two paired stimulus rates tested, but absent after unpaired (control) stimulation. Taken together, these results suggest that pairing clicks and muscle stimulation for long periods does indeed induce plasticity in subcortical systems such as the RST.SIGNIFICANCE STATEMENT Subcortical systems such as the reticulospinal tract (RST) are important motor pathways, which can make a significant contribution to functional recovery after cortical damage such as stroke. Here, we measure changes produced after a novel non-invasive stimulation protocol, which uses a wearable device to stimulate for extended periods. We observed changes in electrophysiological measurements consistent with the induction of subcortical plasticity. This protocol may prove an important tool for enhancing motor rehabilitation, in situations where insufficient cortical tissue survives to be a plausible substrate for recovery of function.

Keywords: electrical stimulation; long-term potentiation; reticulospinal; spike timing-dependent plasticity.


Figures

Figure 1.
Figure 1.
Wearable device and schematic diagram showing the different stimulus conditions. A, General experimental protocol. B, Photograph of the wearable device: (a) stimulus output port; (b) stimulus intensity adjustment; (c) audio output; (d) on/charge switch; (e) microUSB charge connection. C, The three different stimulus conditions implemented by the wearable device. Top, Paired stimulation group, with 10-ms interstimulus interval between clicks and biceps electrical stimuli. Middle, Double stimulation group, with 10-ms interstimulus interval, but double the stimulation frequency as the other groups. Bottom, Unpaired control stimulation group, with random interstimulus intervals.
Figure 2.
Figure 2.
Experimental setup and single subject example for the different assessments. A, The three conditions tested for the StartReact assessment; VRT, VART, and VSRT. B, Cumulative distribution of EMG onset times for all trials of a single subject at baseline. C, Setup for the two loud sound assessments. For the loud sound + TMS assessment, sound was delivered 50 ms before TMS pulse. For the loud sound + CMEP assessment, sound was delivered 80 ms before stimulation. D, Average rectified EMG traces at baseline of a single subject for conditioned (red) and unconditioned (black) MEPs for the two assessments. E, Setup for the assessment of MEPs using different coil orientations and lateralities. Stimulation over the left hemisphere elicited MEPs in the right biceps, which received wearable device stimulation; right hemisphere stimulation elicited MEPs in the left biceps, which did not receive wearable device stimulation. F, Average rectified EMG traces at baseline of a single subject for MEPs elicited with PA (black) or AP (blue) coil orientation at baseline from each hemisphere.
Figure 3.
Figure 3.
Group results for the StartReact assessment. A, Results for the biceps muscle (paired n = 15; double n = 14; control n = 15). a, StartReact effect (difference between VART and VSRT) before (cyan) and after (red) wearable device stimulation. Colored bars represent group means; error bars indicate SDs. Asterisks indicate significant differences. b, Difference in StartReact effect between before and after wearable device stimulation. A positive difference indicates a more pronounced StartReact effect after wearable device stimulation. Bars represent group means; circles show single subject values. c, Number of subjects showing an increase (yellow) or decrease (blue) in StartReact after wearable device stimulation. Asterisks indicate proportions significantly different from the 50% expected by chance. B, Results for the 1DI muscle, in the same format as A.
Figure 4.
Figure 4.
Group results for the conditioning MEPs with loud sounds. A, Group results for the loud sound + TMS assessment at 50-ms interval (paired n = 15; double n = 14; control n = 15). a, Conditioned MEP amplitude normalized to unconditioned amplitude, before (cyan) and after (red) wearable device stimulation for the three different stimulation groups. Colored bars represent group means; error bars indicate SDs across subjects. Asterisks indicate significant differences. b, Difference in normalized MEP amplitude between before and after wearable device stimulation. A positive difference indicates less suppression of the conditioned MEP after wearable device stimulation. Bars represent group means; circles show single subject values. c, Number of subjects showing an increase (yellow) or decrease (blue) in conditioned MEP amplitude after wearable device stimulation. Asterisks indicate proportions significantly different from the 50% expected by chance. B, Group results for the loud sound + CMEPs assessment at 80-ms interval (paired n = 12; double n = 11; control n = 10). Layout is the same as for A.
Figure 5.
Figure 5.
Group results for the coil orientations assessment. A, Results when holding the coil in PA orientation and stimulating over the left motor cortex. a, MEP amplitude before (cyan) and after (red) wearable device stimulation for the two different stimulation groups (paired n = 15; control n = 12). Colored bars represent group means; error bars indicate SDs. Asterisks indicate significant differences. b, Difference in MEP amplitudes between before and after wearable device stimulation. A positive difference indicates an increase in MEP size after wearable device stimulation. Bars represent group means; circles show single subject values. c, Number of subjects showing an increase (yellow) or decrease (blue) in MEP amplitude after wearable device stimulation. Asterisks indicate proportions significantly different from the 50% expected by chance. B, Results for an AP coil orientation stimulating over the left motor cortex. C, Results for a PA coil orientation stimulating over the right motor cortex. D, Results for an AP coil orientation stimulating over the right motor cortex.

Similar articles

Cited by

References

    1. Arai N, Okabe S, Furubayashi T, Terao Y, Yuasa K, Ugawa Y (2005) Comparison between short train, monophasic and biphasic repetitive transcranial magnetic stimulation (rTMS) of the human motor cortex. Clin Neurophysiol 116:605–613. 10.1016/j.clinph.2004.09.020 - DOI - PubMed
    1. Baker SN (2011) The primate reticulospinal tract, hand function and functional recovery. J Physiol 589:5603–5612. 10.1113/jphysiol.2011.215160 - DOI - PMC - PubMed
    1. Baker SN, Perez MA (2017) Reticulospinal contributions to gross hand function after human spinal cord injury. J Neurosci 37:9778–9784. 10.1523/JNEUROSCI.3368-16.2017 - DOI - PMC - PubMed
    1. Barrionuevo G, Brown TH (1983) Associative long-term potentiation in hippocampal slices. Proc Natl Acad Sci USA 80:7347–7351. 10.1073/pnas.80.23.7347 - DOI - PMC - PubMed
    1. Benjamini Y, Hochberg Y (1995) Controlling the false discovery rate: a practical and powerful approach to multiple testing. J R Stat Soc Series B Stat Methodol 57:289–300. 10.1111/j.2517-6161.1995.tb02031.x - DOI

Publication types

MeSH terms

LinkOut - more resources