TNF-α Regulates Human Plasmacytoid Dendritic Cells by Suppressing IFN-α Production and Enhancing T Cell Activation
- PMID: 33441439
- PMCID: PMC7851743
- DOI: 10.4049/jimmunol.1901358
TNF-α Regulates Human Plasmacytoid Dendritic Cells by Suppressing IFN-α Production and Enhancing T Cell Activation
Abstract
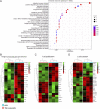
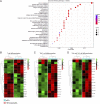
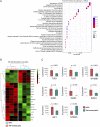
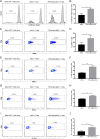
Human plasmacytoid dendritic cells (pDCs) play a vital role in modulating immune responses. They can produce massive amounts of type I IFNs in response to nucleic acids via TLRs, but they are also known to possess weak Ag-presenting properties inducing CD4+ T cell activation. Previous studies showed a cross-regulation between TNF-α and IFN-α, but many questions remain about the effect of TNF-α in regulating human pDCs. In this study, we showed that TNF-α significantly inhibited the secretion of IFN-α and TNF-α of TLR-stimulated pDCs. Instead, exogenous TNF-α promoted pDC maturation by upregulating costimulatory molecules and chemokine receptors such as CD80, CD86, HLA-DR, and CCR7. Additionally, RNA sequencing analysis showed that TNF-α inhibited IFN-α and TNF-α production by downregulating IRF7 and NF-κB pathways, while it promoted Ag processing and presentation pathways as well as T cell activation and differentiation. Indeed, TNF-α-treated pDCs induced in vitro higher CD4+ T cell proliferation and activation, enhancing the production of Th1 and Th17 cytokines. In conclusion, TNF-α favors pDC maturation by switching their main role as IFN-α-producing cells to a more conventional dendritic cell phenotype. The functional status of pDCs might therefore be strongly influenced by their overall inflammatory environment, and TNF-α might regulate IFN-α-mediated aspects of a range of autoimmune and inflammatory diseases.
Copyright © 2021 The Authors.
Conflict of interest statement
M.W. has received honoraria for educational activity and consultancy from Novartis, Janssen, Abbvie, and Cellgene. P.E. has received consultancy fees from Bristol Myers Squibb, Abbott, Pfizer, Merck Sharpe & Dohme, Novartis, Roche, and UCB. He has received research grants paid to his employer from Abbott, Bristol Myers Squibb, Pfizer, Merck Sharpe & Dohme, and Roche. G.C.T. has received consultancy fees from Jansen and is on the Scientific Advisory Boards of Silicon Pharmaceuticals and ABPRO. E.M.V. has received consultancy fees from Roche, GlaxoSmithKline, Lilly, and AstraZeneca and research grants paid to his employer from Roche and AstraZeneca. The other authors have no financial conflicts of interest.
Figures


Similar articles
-
Hepatitis C virus fails to activate NF-κB signaling in plasmacytoid dendritic cells.J Virol. 2012 Jan;86(2):1090-6. doi: 10.1128/JVI.05444-11. Epub 2011 Nov 16. J Virol. 2012. PMID: 22090103 Free PMC article.
-
Characterization of the Plasmacytoid Dendritic Cell Response to Transmitted/Founder and Nontransmitted Variants of HIV-1.J Virol. 2018 Sep 12;92(19):e00157-18. doi: 10.1128/JVI.00157-18. Print 2018 Oct 1. J Virol. 2018. PMID: 29997203 Free PMC article.
-
MicroRNA-146a regulates survival and maturation of human plasmacytoid dendritic cells.Blood. 2013 Oct 24;122(17):3001-9. doi: 10.1182/blood-2012-12-475087. Epub 2013 Sep 6. Blood. 2013. PMID: 24014244 Free PMC article.
-
Targeting uptake receptors on human plasmacytoid dendritic cells triggers antigen cross-presentation and robust type I IFN secretion.J Immunol. 2013 Nov 15;191(10):5005-12. doi: 10.4049/jimmunol.1300787. Epub 2013 Oct 14. J Immunol. 2013. PMID: 24127556
-
Human plasmacytoid dendritic cells: from molecules to intercellular communication network.Front Immunol. 2013 Nov 12;4:372. doi: 10.3389/fimmu.2013.00372. eCollection 2013. Front Immunol. 2013. PMID: 24282405 Free PMC article. Review.
Cited by
-
Low-level inflammation, immunity, and brain-gut axis in IBS: unraveling the complex relationships.Gut Microbes. 2023 Dec;15(2):2263209. doi: 10.1080/19490976.2023.2263209. Epub 2023 Oct 2. Gut Microbes. 2023. PMID: 37786296 Free PMC article. Review.
-
Type 1 interferon signature and allograft inflammatory factor-1 contribute to refractoriness to TNF inhibition in ankylosing spondylitis.Nat Commun. 2025 Jul 1;16(1):5531. doi: 10.1038/s41467-025-60445-6. Nat Commun. 2025. PMID: 40593526 Free PMC article.
-
Proteomic and Single-Cell Transcriptomic Dissection of Human Plasmacytoid Dendritic Cell Response to Influenza Virus.Front Immunol. 2022 Mar 23;13:814627. doi: 10.3389/fimmu.2022.814627. eCollection 2022. Front Immunol. 2022. PMID: 35401570 Free PMC article.
-
Nonlesional lupus skin contributes to inflammatory education of myeloid cells and primes for cutaneous inflammation.Sci Transl Med. 2022 Apr 27;14(642):eabn2263. doi: 10.1126/scitranslmed.abn2263. Epub 2022 Apr 27. Sci Transl Med. 2022. PMID: 35476593 Free PMC article.
-
TNF gives plasmacytoid dendritic cells a new life.Nat Immunol. 2025 Sep;26(9):1432-1433. doi: 10.1038/s41590-025-02254-z. Nat Immunol. 2025. PMID: 40817417 No abstract available.
References
-
- Jego, G., Palucka A. K., Blanck J. P., Chalouni C., Pascual V., Banchereau J. 2003. Plasmacytoid dendritic cells induce plasma cell differentiation through type I interferon and interleukin 6. Immunity 19: 225–234. - PubMed
-
- Fonteneau, J. F., Gilliet M., Larsson M., Dasilva I., Münz C., Liu Y. J., Bhardwaj N. 2003. Activation of influenza virus-specific CD4+ and CD8+ T cells: a new role for plasmacytoid dendritic cells in adaptive immunity. Blood 101: 3520–3526. - PubMed
Publication types
MeSH terms
Substances
Grants and funding
LinkOut - more resources
Full Text Sources
Other Literature Sources
Research Materials

