. 2021 Mar 2;96(9):e1334-e1346.
doi: 10.1212/WNL.0000000000011523. Epub 2021 Jan 13.

Role of the Nucleus Basalis as a Key Network Node in Temporal Lobe Epilepsy

Affiliations

Role of the Nucleus Basalis as a Key Network Node in Temporal Lobe Epilepsy

Hernán F J González et al. Neurology. .

Abstract

Objective: To determine whether the nucleus basalis of Meynert (NBM) may be a key network structure of altered functional connectivity in temporal lobe epilepsy (TLE), we examined fMRI with network-based analyses.

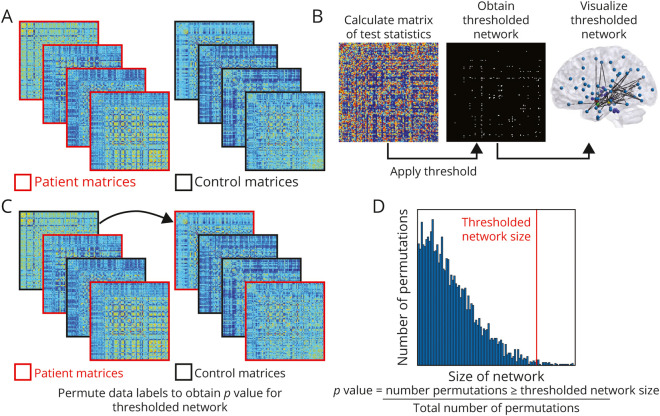
Methods: We acquired resting-state fMRI in 40 adults with TLE and 40 matched healthy control participants. We calculated functional connectivity of NBM and used multiple complementary network-based analyses to explore the importance of NBM in TLE networks without biasing our results by our approach. We compared patients to controls and examined associations of network properties with disease metrics and neurocognitive testing.

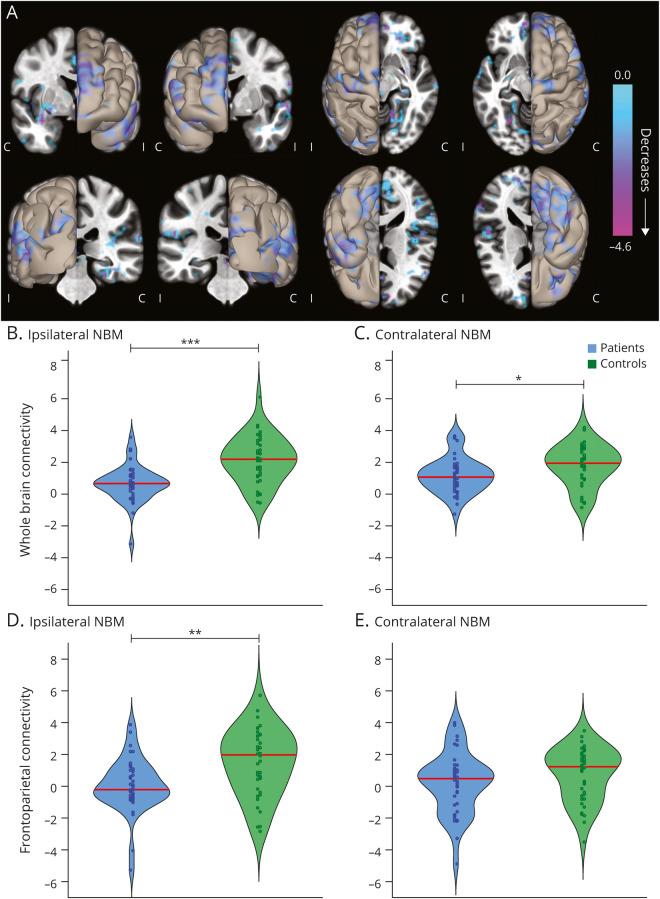
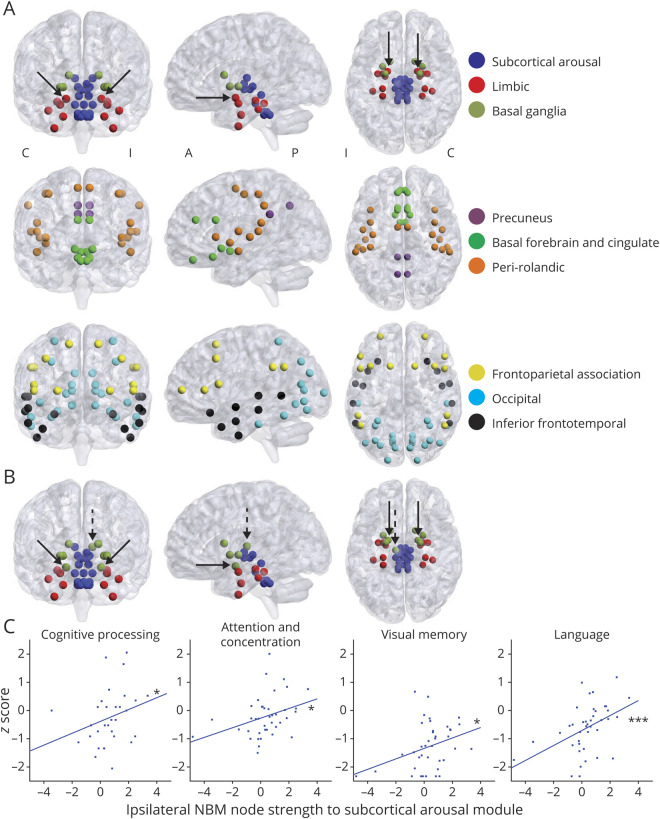
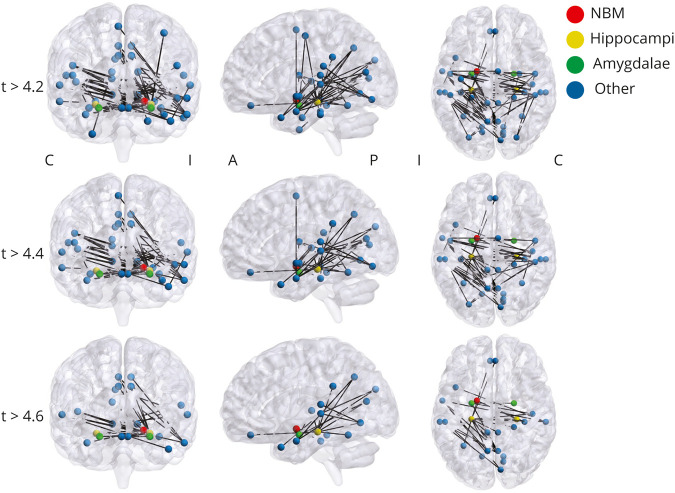
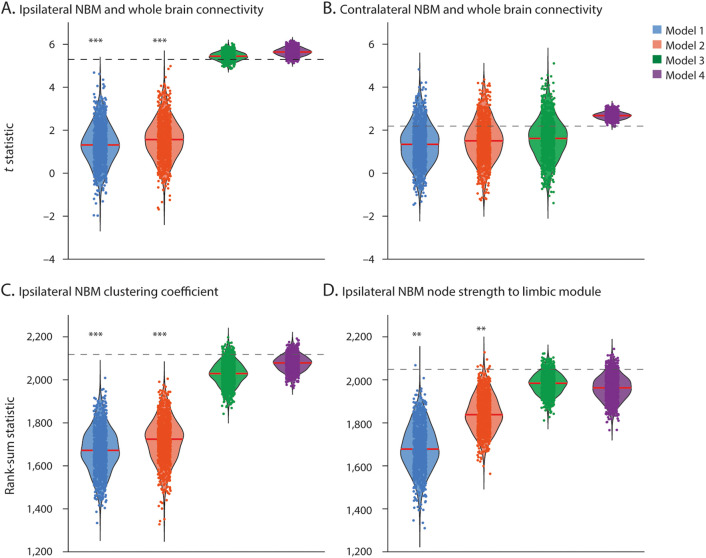
Results: We observed marked decreases in connectivity between NBM and the rest of the brain in patients with TLE (0.91 ± 0.88, mean ± SD) vs controls (1.96 ± 1.13, p < 0.001, t test). Larger decreases in connectivity between NBM and fronto-parietal-insular regions were associated with higher frequency of consciousness-impairing seizures (r = -0.41, p = 0.008, Pearson). A core network of altered nodes in TLE included NBM ipsilateral to the epileptogenic side and bilateral limbic structures. Furthermore, normal community affiliation of ipsilateral NBM was lost in patients, and this structure displayed the most altered clustering coefficient of any node examined (3.46 ± 1.17 in controls vs 2.23 ± 0.93 in patients). Abnormal connectivity between NBM and subcortical arousal community was associated with modest neurocognitive deficits. Finally, a logistic regression model incorporating connectivity properties of ipsilateral NBM successfully distinguished patients from control datasets with moderately high accuracy (78%).

Conclusions: These results suggest that while NBM is rarely studied in epilepsy, it may be one of the most perturbed network nodes in TLE, contributing to widespread neural effects in this disabling disorder.


Figures

Figure 1
Figure 1. Functional Connectivity of the NBM Is Decreased in Patients With TLE Compared to Controls
(A) Data represent seed-to-voxel fMRI functional connectivity maps (bivariate correlation) seeded from bilateral nucleus basalis of Meynert (NBM), comparing patients with temporal lobe epilepsy (TLE) vs control participants (paired t test, cluster threshold level p < 0.05, false discovery rate correction). These seed-to-voxel group-level comparisons are projected onto an average brain template. Negative contrasts are shown, and no connectivity increases were seen in patients. fMRIs are oriented with respect to the side of seizure onset for patients with TLE, and matched controls images are flipped accordingly. In evaluating functional connections between NBM and all other regions in the brain (excluding cerebellum), NBM connectivity reductions in patients with TLE vs controls are observed both (B) ipsilateral and (C) contralateral to the side of seizure onset. Restricting the analysis to selected frontoparietal regions, large reductions in NBM connectivity are noted in patients vs controls on the (D) ipsilateral but not (E) contralateral side. Red line shows median. N = 40 patients with TLE and 40 matched healthy control participants. C = contralateral; I = ipsilateral. ***p < 0.001, **p < 0.01, *p < 0.05, paired t tests with Bonferroni-Holm correction.
Figure 2
Figure 2. Community Structure of NBM Is Altered in TLE
(A) Communities were first defined in healthy control participants, and 9 communities were detected. We named these communities on the basis of anatomic and functional similarities between regions. Both ipsilateral and contralateral nucleus basalis of Meynert (NBM) (solid arrows) clustered together with limbic structures (red) and did not cluster within a community including other subcortical arousal nuclei, including ascending reticular activating system and intralaminar thalamic nuclei (blue). A list of all communities and nodes is provided in table 2. N = 40 healthy control participants. (B) When this community structure was applied to patients with temporal lobe epilepsy (TLE) and node strength to module was calculated, ipsilateral and contralateral NBM (solid arrows) in patients did not cluster (i.e., did not demonstrate maximum node strength to module) with the limbic community as in controls. Instead, these nodes clustered with the basal ganglia community. Other nodes that clustered with different communities in patients compared to controls included ipsilateral central lateral thalamic nucleus (dashed arrow), as well as ipsilateral frontal operculum cortex, ipsilateral orbitofrontal cortex, and contralateral orbitofrontal cortex (not shown). N = 40 patients with TLE. (C) We compared performance on neurocognitive testing in patients with ipsilateral NBM node strength to subcortical arousal module to determine whether there were any associations. On the y-axis for each plot is z-score performance in each domain in the title, and on x-axis in each plot is ipsilateral NBM node strength to subcortical module. We observed trends toward increasing node strength to module between ipsilateral NBM and subcortical arousal module associated with improved performance on tests measuring cognitive processing (n = 31 patients), attention and concentration (n = 40 patients), visual memory (n = 40 patients), and language abilities (n = 40 patients). A = anterior; C = contralateral; I = ipsilateral; P = posterior. ***p < 0.001, *p < 0.05, Spearman ρ, uncorrected.
Figure 3
Figure 3. Calculation of the Network-Based Statistic in Patients With Temporal Lobe Epilepsy and Controls
(A) Functional connectivity matrices for each participant are calculated. (B, left) A test statistic (t test) is calculated at each cell of the connectivity network. Then network components of interest are identified using a primary threshold of t statistic > 4.2, 4.4, 4.6. This thresholded network can be visualized in a matrix (B, middle) where white cells represent suprathreshold links or in a schematic diagram (B, right) where connected nodes represent the suprathreshold network components. (C) Random permutation of data labels (10,000 permutations) across participants is then applied to calculate family-wise error. (D) After the calculations are repeated on every permutation, a null distribution is generated, and family-wise error rate at desired level of p < 0.01 is controlled in the final result.
Figure 4
Figure 4. Core Network of Altered Connectivity in TLE Includes Bilateral Mesial Temporal Structures and Ipsilateral NBM
Network-based statistic reveals a central network of nodes and edges that are altered in patients vs controls. This component network was tested at multiple t statistic thresholds, and the network contained 43 nodes and 66 edges at t > 4.2, 35 nodes and 49 edges at t > 4.4, and 24 nodes and 27 edges at t > 4.6. At multiple t statistic thresholds, this network included ipsilateral but not contralateral nucleus basalis of Meynert (NBM), included bilateral hippocampi and amygdalae, but did not include other subcortical arousal nuclei. Network-based statistic is performed at p < 0.01 with family-wise error correction. N = 40 patients with temporal lobe epilepsy (TLE) and 40 matched healthy control participants. A = anterior; C = contralateral; I = ipsilateral; P = posterior.
Figure 5
Figure 5. Network Models Explain Connectivity Differences Between Patients With TLE and Controls
Data points represent test statistics (t statistic for normally distributed data or rank-sum statistic for nonnormally distributed data) quantifying differences between patient and control null models (1,000 data points per null model). Dashed line represents the original data test statistic. Models with sufficient data points above the line represent network models that capture the difference between patients and controls observed in empirical data. (A) Reduced connectivity of ipsilateral nucleus basalis of Meynert (NBM) with the whole brain is best explained by models 3 and 4, while (B) reductions in contralateral NBM connectivity with the whole brain are explained equally well by all models. Decreases in (C) ipsilateral NBM clustering coefficient and (D) ipsilateral NBM node strength to limbic module are best explained by models 3 and 4. The 4 models are defined in the Methods section. Red line shows median. N = 1,000 comparisons per model. ***p < 0.001, **p < 0.01, t statistic or rank-sum statistic.

Comment in

Similar articles

Cited by

References

    1. Engel J Jr. What can we do for people with drug-resistant epilepsy? The 2016 Wartenberg Lecture. Neurology 2016;87:2483–2489. - PMC - PubMed
    1. Blumenfeld H, Taylor J. Why do seizures cause loss of consciousness? Neuroscientist 2003;9:301–310. - PubMed
    1. Gargaro AC, Sakamoto AC, Bianchin MM, et al. . Atypical neuropsychological profiles and cognitive outcome in mesial temporal lobe epilepsy. Epilepsy Behav 2013;27:461–469. - PubMed
    1. Zhao F, Kang H, You L, Rastogi P, Venkatesh D, Chandra M. Neuropsychological deficits in temporal lobe epilepsy: a comprehensive review. Ann Indian Acad Neurol 2014;17:374–382. - PMC - PubMed
    1. Englot DJ, Morgan VL, Chang C. Impaired vigilance networks in temporal lobe epilepsy: mechanisms and clinical implications. Epilepsia 2020;61:189–202. - PMC - PubMed

Publication types

MeSH terms

LinkOut - more resources