. 2021 Jan 13;12(1):364.
doi: 10.1038/s41467-020-20605-2.

Age-related and disease locus-specific mechanisms contribute to early remodelling of chromatin structure in Huntington's disease mice

Affiliations

Age-related and disease locus-specific mechanisms contribute to early remodelling of chromatin structure in Huntington's disease mice

Rafael Alcalá-Vida et al. Nat Commun. .

Abstract

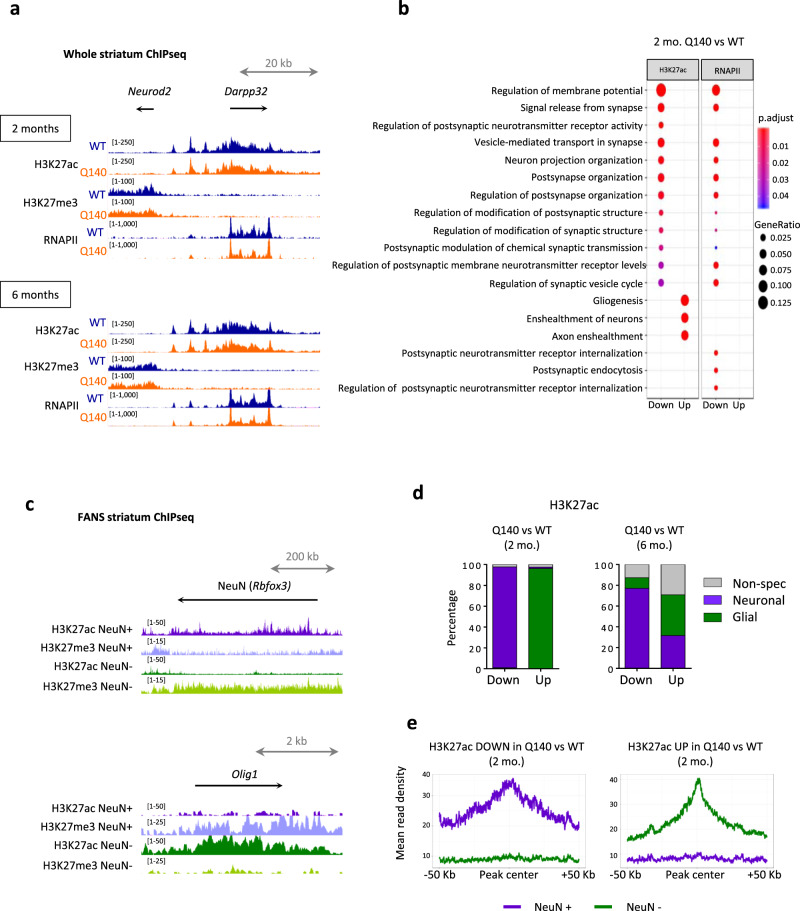
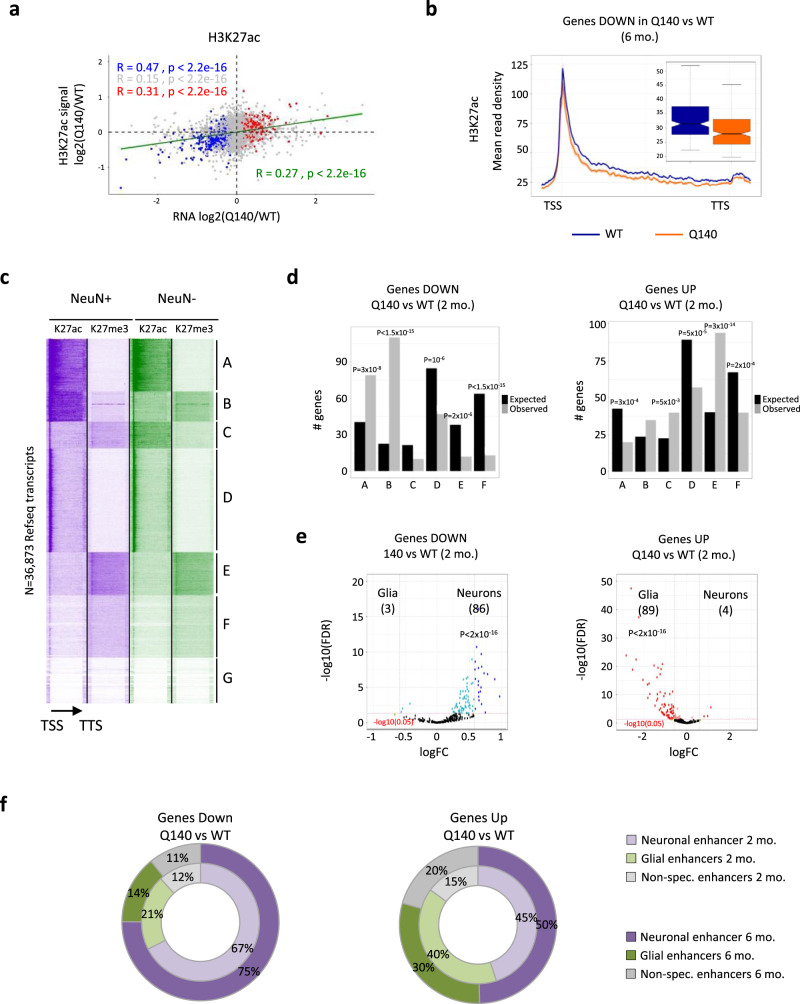
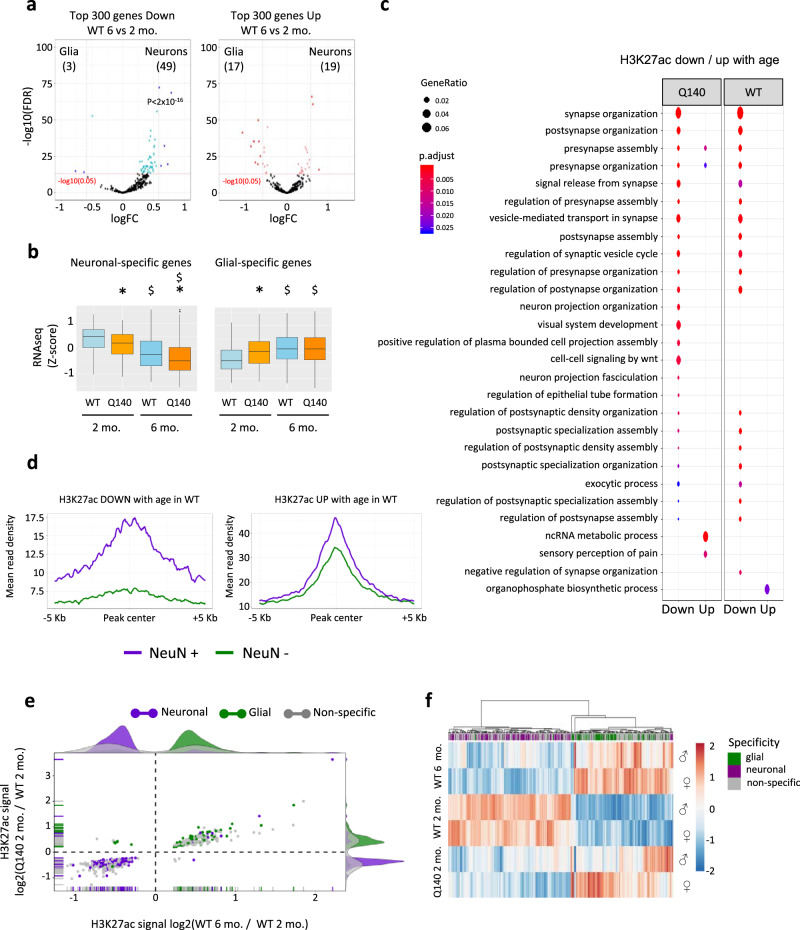
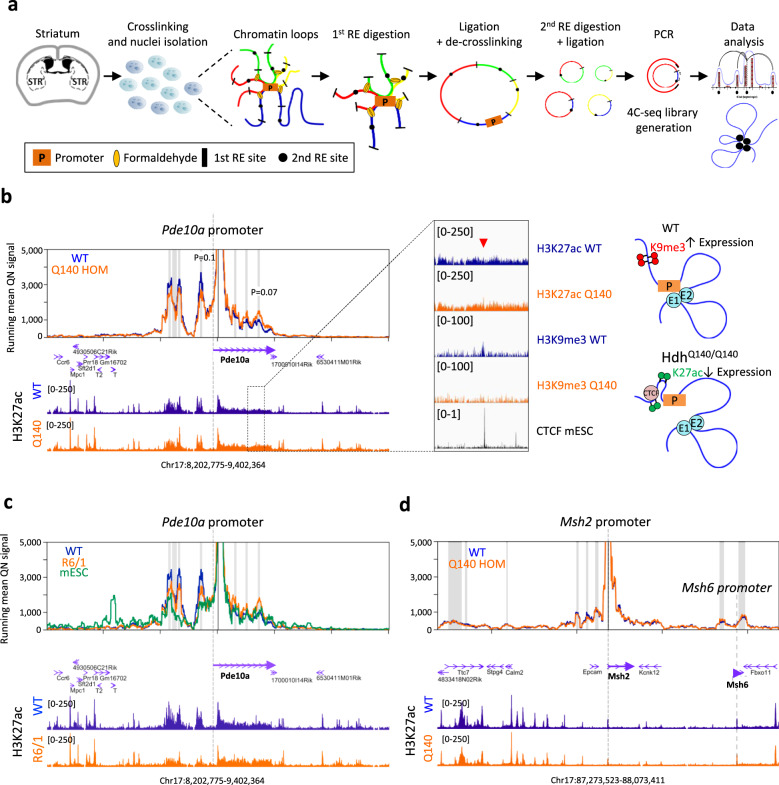
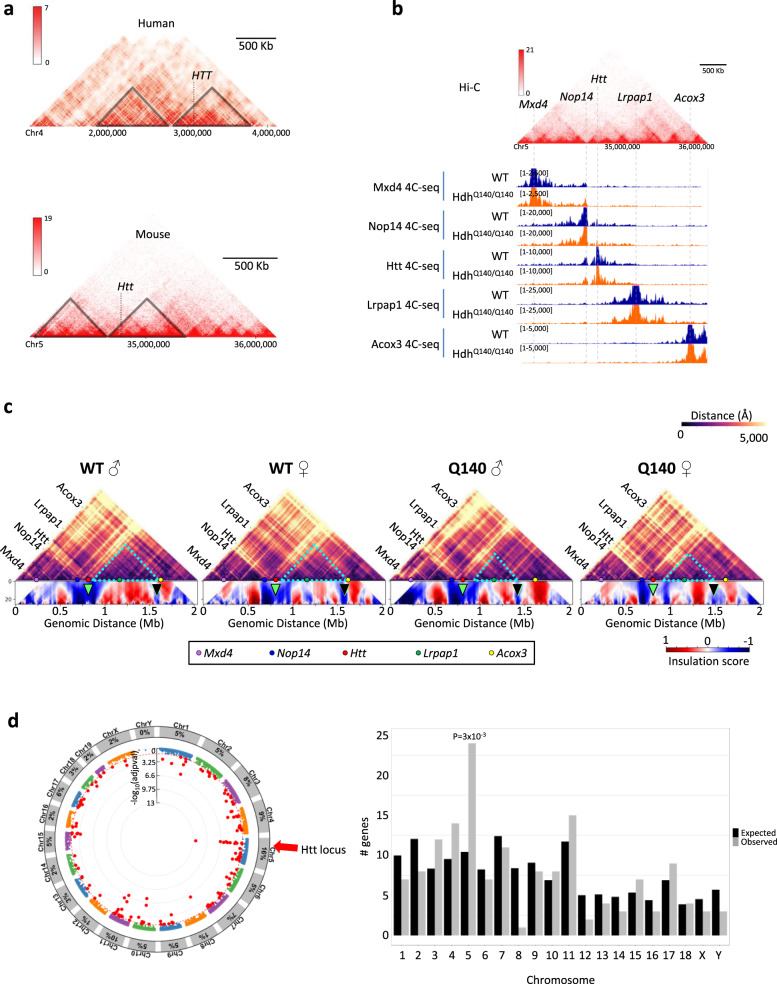
Temporal dynamics and mechanisms underlying epigenetic changes in Huntington's disease (HD), a neurodegenerative disease primarily affecting the striatum, remain unclear. Using a slowly progressing knockin mouse model, we profile the HD striatal chromatin landscape at two early disease stages. Data integration with cell type-specific striatal enhancer and transcriptomic databases demonstrates acceleration of age-related epigenetic remodelling and transcriptional changes at neuronal- and glial-specific genes from prodromal stage, before the onset of motor deficits. We also find that 3D chromatin architecture, while generally preserved at neuronal enhancers, is altered at the disease locus. Specifically, we find that the HD mutation, a CAG expansion in the Htt gene, locally impairs the spatial chromatin organization and proximal gene regulation. Thus, our data provide evidence for two early and distinct mechanisms underlying chromatin structure changes in the HD striatum, correlating with transcriptional changes: the HD mutation globally accelerates age-dependent epigenetic and transcriptional reprogramming of brain cell identities, and locally affects 3D chromatin organization.


Conflict of interest statement

The authors declare no competing interests.

Figures

Fig. 1
Fig. 1. Striatal epigenetic alterations induced by the HD mutation establish early and in cell-type-dependent manner in HD Q140 mice.
a UCSC genome browser capture showing representative H3K27ac, H3K27me3 and RNAPII signals in the striatum of WT and Q140 mouse striatum at 2 and 6 months at selected locus, including active (Darpp32 (Ppp1r1b)) and repressed (Neurod2) genes in the adult striatum. 2 mo., 2 months; 6 mo., 6 months b Gene Ontology analysis of regions differentially enriched in H3K27ac and RNAPII between Q140 and WT mouse striatal samples at 2 months (FDR < 0.05). Significant biological processes are shown using dot size proportional to gene ratio and heatmap reflecting adjusted P value. c UCSC genome browser capture showing representative H3K27ac and H3K27me3 signals in striatal NeuN+ and NeuN− populations in WT mice at 6 months at selected neuronal gene (NeuN (Rbfox3)) and glial gene (Olig2). d Bargraphs showing cell-type distribution of regions differentially enriched in H3K27ac in Q140 vs WT mouse striatum at 2 and 6 months of age. e Metaprofiles showing H3K27ac signal in NeuN+ and NeuN− sorted nuclei, considering differentially enriched peaks in Q140 vs WT striata at 2 months. Source data are provided as a Source Data file.
Fig. 2
Fig. 2. Concomitant epigenetic and transcriptional reprogramming of neuronal- and glial-specific genes in HD Q140 striatum.
a Linear regression analysis between transcriptional and H3K27ac changes in the striatum of Q140 vs WT mice of 6 months. The correlation is shown for all genes (green), genes significantly downregulated (Fold change (FC) <1 and adj. P value <0.05; blue), genes significantly upregulated (FC >1 and adj. P value <0.05; red) and non-significantly altered genes (grey). Pearson’s correlation index and P value for fitted linear model are shown. b Gene body metaprofiles representing H3K27ac read count distribution for top 300 downregulated genes, ranked according to adj. P value, in Q140 mouse striatum at 6 months. TSS transcription start site; TTS transcription termination site. Data from male and female samples were used to generate average profile. Boxplots represent the distribution of mean read density along the profiles and show median, first quartile (Q1), third quartile (Q3) and range (min, Q1−1.5×(Q3−Q1); max, Q3+1.5×(Q3−Q1)). c Heatmap of the 36,873 annotated mm10 RefSeq gene transcripts, integrating H3K27ac and H3K27me3 gene profiles from NeuN+ and NeuN− sorted nuclei and showing seven distinct epigenetic profiles generated by k-means clustering (clusters A-G). The arrow indicates the orientation of genes; TSS transcription start site; TTS transcription termination site. d Histograms showing cluster distribution of genes down- (upper panel) and upregulated (lower panel) in Q140 vs WT striatum at 2 months of age. Three-hundred top dysregulated genes were analysed from RNAseq data and ranked according to P value. Observed numbers were compared with expected numbers and a binomial test (two-sided) was used to assess significant differences, with multiple testing correction using the Bonferroni method. e Volcano plot representation of differential expression values between glial cells (astrocytes and microglia) and neurons (medium spiny neurons, MSNs, including D1 and D2 MSNs) using top-ranked 300 genes down (top) and 300 genes up (bottom) in Q140 vs WT striatum at 2 months. Genes down in Q140 vs WT striatum and significantly changed in neurons vs glial cells (FC >1 and adj. P value <0.05) are shown in blue; genes up in Q140 vs WT striatum and significantly changed in neurons vs glial cells (FC <1 and adj. P value <0.05) shown in red. A binomial test (two-sided) was performed to assessed enrichment in neuronal- or glial-specific genes. Adjustment for multiple comparisons was not performed. f Pie chart showing the distribution of neuronal-, glial- and non-specific enriched H3K27ac regions (as defined in Supplementary Dataset 1) associated with top 300 genes down (left) and top 300 genes up (right) in Q140 vs WT striatum at 2 and 6 months. Source data are provided as a Source Data file.
Fig. 3
Fig. 3. Age-related epigenetic and transcriptional reprogramming of neuronal and glial identities are accelerated in the striatum of HD Q140 mice.
a Volcano plot representation of differential expression values between glial cells (astrocytes and microglia) and neurons (medium spiny neurons, MSNs, including D1 and D2 MSNs) using top-ranked (according to adj. P val) 300 genes down (left) and top-ranked 300 genes up (right) in WT striatum at 6 months vs 2 months. Genes down at 6 vs 2 months in WT striatum and significantly changed in neurons vs glial cells (FC >1 and adj. P value <0.05) are shown in blue; genes up at 6 vs 2 months in WT striatum and significantly changed in neurons vs glial cells (FC <1 and adj. P value) are shown in red. A binomial test (two-sided) was performed to assess enrichment in neuronal- or glial-specific genes. Adjustment for multiple comparisons was not performed. b Boxplots representing z-score values computed from RNAseq data generated in Q140 and WT striatum at 2 months and 6 months, considering genes increased in neurons vs glial cells (neuronal-specific genes, left) and genes increased in glial cells vs neurons (glial-specific genes, right). Boxplots show median, first quartile (Q1), third quartile (Q3) and range (min, Q1−1.5×(Q3–Q1); max, Q3+1.5×(Q3–Q1). Statistical analysis was performed using Kruskal–Wallis test (one-sided), with multiple testing correction using the Benjamini-Hochberg method. Neuronal-specific genes: *, P < 2 × 10−16, Q140 vs WT comparison at 2 months; *, P < 2 × 10−16, Q140 vs WT comparison at 6 months; $, P < 2 × 10−16, 6- vs 2-month comparison in WT; $, P = 2 × 10−13, 6- vs 2-month comparison in R6/1. Glial-specific genes: *, P < 2 × 10−16, Q140 vs WT comparison at 2 months; *; $, P < 2 × 10−16, 6- vs 2-month comparison in WT; $, P = 9 × 10−10, 6- vs 2-month comparison in R6/1. RNAseq data from transcriptomic databases, were used for these analyses. c Gene Ontology analysis of regions differentially enriched in H3K27ac in 6- vs 2-month striatal samples, in Q140 and WT contexts (FDR < 0.05). Significant biological processes are shown using dot size proportional to gene ratio and heatmap reflecting adj. P value. d Metaprofiles showing H3K27ac signal in NeuN+ and NeuN− sorted nuclei, considering differentially enriched peaks in WT striatal samples of 6 vs 2 months. FC <1 and adj. P value <0.05, down, left; FC >1 and adj. P value <0.05, up, right. e Scatter plot and density population graphs representing log2 of fold-change in H3K27ac at regions significantly changed (P < 0.05) both in Q140 vs WT samples at 2 months and in WT samples at 6 vs 2 months. Differentially H3K27ac-enriched regions distribute in three categories: non-specific (Non-specific, grey), neuronal-specific (Neuronal, purple) and glial-specific (Glial, green). f Heatmap representing z-score values of H3K27ac signal at regions differentially enriched in H3K27ac (P < 0.05) both in Q140 vs WT samples at 2 months and in WT samples at 6 vs 2 months. Differentially H3K27ac-enriched regions distribute in three categories: non-specific (Non-specific, grey), neuronal-specific (Neuronal, purple) and glial-specific (Glial, green); hierarchical clustering was performed according to H3K27ac signal. Source data are provided as a Source Data file.
Fig. 4
Fig. 4. Chromatin architecture at Pde10a is impaired in the striatum of HD Q140 mice.
a Scheme showing 4C-seq technique major steps using mouse striatum. PCR primers specific to each bait can be found in the “Methods” section. RE restriction enzyme. b On the left, 4C-seq profiles at Pde10a locus using HD Q140 (orange) and WT (blue) mouse striatum at 6 months. The mean of male and female 4C-seq quartile normalized read counts is plotted as the main lane for each condition. Statistical analysis of differential interacting peaks in Q140 vs WT was performed using two-paired t-test, with multiple testing correction using the Benjamini-Hochberg method. P = 0.1 (upstream of Pde10a promoter), P = 0.07 (downstream of Pde10a promoter). Gene annotations are included as well as H3K27ac ChIPseq signals (using ChIPseq data generated in this study on the striatum of Q140 and WT mice at same age). Grey shadows show specific interacting regions. On the middle, zoom into Pde10a intronic region, showing H3K27ac and H3K9me3 levels in WT and Q140 mice striatum together with CTCF enrichment (from CTCF ChIP-seq data generated in mESC). On the right, model to explain chromatin conformational changes at Pde10a locus in HD mouse striatum. c 4C-seq profiles at Pde10a locus generated using HD R6/1 (orange) and WT (blue) mouse striatum at 14 weeks of age and using mESC (green). Gene annotations and H3K27ac ChIPseq signals are included. Grey shadows show specific interacting regions. d 4C-seq profiles at Msh2 locus using Q140 (orange) and WT (blue) striatum at 6 months. The mean of male and female 4C-seq quartile normalized read counts is plotted as the main lane for each condition. Gene annotations and H3K27ac ChIPseq signals are included. Grey shadows show specific interacting regions. Msh6 promoter is annotated to highlight the distal chromatin loop formed with Msh2 promoter.
Fig. 5
Fig. 5. The HD mutation induces disease locus-specific alterations of chromatin architecture and transcription regulation in the striatum of Q140 mice.
a Hi-C data capture showing 3 and 2.3 megabase genome region from human hippocampus and mouse cortical neurons, respectively. In both cases, Htt is in the vicinity of TAD borders (~250 Kb for human HTT and ~115 Kb for mouse Htt). b Genome browser representation of mouse cortical neuron Hi-C data, zooming on the region encompassing Htt, and aligned with 4C-seq data generated in this study using striatal tissue of WT (blue) and Q140 (orange) mice. The genomic locations of Mxd4, Nop14, Htt, Lrpap1 and Acox3 4C-seq baits are indicated. c Virtual Hi-C heatmap of contact matrices for WT and Q140 striatal data at Htt locus (top). Colour scale indicates distance between regions in Angstroms (Å). Colour spheres depicting the location of the original baits are shown. In the bottom, insulation score cumulative heatmaps were computed using bins from 4 (40 Kb) to 30 (300 Kb) adding 1 bin each time. Green arrow shows the location of Htt at TAD boundary. Black arrow shows the location of subTAD boundary downstream to Htt, displaced in Q140 mice data. d Left, Manhattan plot representing the distribution of differentially expressed genes (DEGs) in Q140 vs WT striatum at 2 months across the different chromosomes. Significant DEG (adj. P value <0.05) are labelled as red dots and the percentage of DEG within each chromosome is shown in peripheral arc. Right, Histogram showing chromosome distribution of DEGs in Q140 vs WT striatum at 2 months of age. Observed numbers were compared with expected numbers for each chromosome and a binomial test (two-sided) was used to assess significant differences, with multiple testing correction using the Bonferroni correction. Source data are provided as a Source Data file.

References

    1. McColgan P, et al. Selective vulnerability of Rich Club brain regions is an organizational principle of structural connectivity loss in Huntington’s disease. Brain. 2015;138:3327–3344. doi: 10.1093/brain/awv259. - DOI - PMC - PubMed
    1. Bates GP, et al. Huntington disease. Nat. Rev. Dis. Primers. 2015;1:15005. doi: 10.1038/nrdp.2015.5. - DOI - PubMed
    1. Achour M, et al. Neuronal identity genes regulated by super-enhancers are preferentially down-regulated in the striatum of Huntington’s disease mice. Hum. Mol. Genet. 2015;24:3481–3496. doi: 10.1093/hmg/ddv099. - DOI - PubMed
    1. Francelle L, Lotz C, Outeiro T, Brouillet E, Merienne K. Contribution of neuroepigenetics to Huntington’s disease. Front. Hum. Neurosci. 2017;11:17. doi: 10.3389/fnhum.2017.00017. - DOI - PMC - PubMed
    1. Langfelder P, et al. Integrated genomics and proteomics define huntingtin CAG length-dependent networks in mice. Nat. Neurosci. 2016;19:623–633. doi: 10.1038/nn.4256. - DOI - PMC - PubMed

Publication types

MeSH terms