. 2021 Jan 13;12(1):362.
doi: 10.1038/s41467-020-20598-y.

Single cell transcriptomic analysis of human pluripotent stem cell chondrogenesis

Affiliations

Single cell transcriptomic analysis of human pluripotent stem cell chondrogenesis

Chia-Lung Wu et al. Nat Commun. .

Abstract

The therapeutic application of human induced pluripotent stem cells (hiPSCs) for cartilage regeneration is largely hindered by the low yield of chondrocytes accompanied by unpredictable and heterogeneous off-target differentiation of cells during chondrogenesis. Here, we combine bulk RNA sequencing, single cell RNA sequencing, and bioinformatic analyses, including weighted gene co-expression analysis (WGCNA), to investigate the gene regulatory networks regulating hiPSC differentiation under chondrogenic conditions. We identify specific WNTs and MITF as hub genes governing the generation of off-target differentiation into neural cells and melanocytes during hiPSC chondrogenesis. With heterocellular signaling models, we further show that WNT signaling produced by off-target cells is responsible for inducing chondrocyte hypertrophy. By targeting WNTs and MITF, we eliminate these cell lineages, significantly enhancing the yield and homogeneity of hiPSC-derived chondrocytes. Collectively, our findings identify the trajectories and molecular mechanisms governing cell fate decision in hiPSC chondrogenesis, as well as dynamic transcriptome profiles orchestrating chondrocyte proliferation and differentiation.


Conflict of interest statement

F.G. is an employee of Cytex Therapeutics, Inc. The remaining authors declare no competing interests.

Figures

Fig. 1
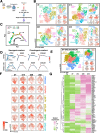
Fig. 1. DEGs of mesodermal and chondrogenic differentiation of three hiPSC lines by bulk RNA-seq.
A Schematic of the chondrogenic differentiation protocol for hiPSCs. B, C PCA indicates that three unique hiPSC lines followed similar differentiation trajectories. D, E DEGs averaged from three unique hiPSC lines at each stage of differentiation, respectively. Each column of the heatmap represents a comparison between two stages/time points, and each gene presented was assigned a colored dot (following the gene label). The color of the dot matches the color of the timepoint label on the left side of the heatmap. When the color of a gene label and a timepoint label match, that gene was significantly upregulated at the corresponding time points.
Fig. 2
Fig. 2. In vitro and in vivo characterization of hiPSC-derived chondrocytes.
A Temporal gene expression of chondrogenic markers SOX9 and COL2A1, hypertrophic marker COL10A1, and osteogenic marker COL1A1. B Pellets showed enriched Saf-O, COL2A1, and COL6A1 staining. Most COL1A1 staining (green arrowheads) was located at the edge of the pellets, while faint COL10A1 (yellow arrowheads) was observed. Left column scale bar = 400 µm. Right column scale bar = 200 µm. Inset scale bar = 50 µm. The experiment was repeated three times with similar results. C Heatmap of 134 significantly upregulated genes identified in GO term cartilage development (GO:0051216). Genes in red font are either TFs or transcription regulators. D hiPSC-derived chondrocytes exhibit a similar phenotype to embryonic limb bud chondrocytes. E hiPSC-derived chondrocytes repaired osteochondral defects in the cartilage of mouse knee joints and retained a chondrocyte phenotype 28 days post implantation. n = 3 mice per group. Top row scale bar = 500 µm. Bottom row scale bar = 100 µm.
Fig. 3
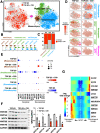
Fig. 3. scRNA-seq and WGCNA reveal neural cells and melanocytes as off-target cells.
A scRNA-seq was performed at hiPSC, Sclerotome, Cp, and six chondrogenic pellet time points. B Reconstruction of differentiation trajectory reveals an off-target lineage bifurcation toward neural cells. A total of 19,195 cells that passed quality control from the stage of hiPSC to d42 chondrogenic pellet were used to reconstruct the differentiation trajectory. C Chondrogenic markers were enriched in the chondrogenic branch, while neurogenic markers were observed in the branch of neurogenesis. D Annotated cell populations at different time points during hiPSC chondrogenesis. Cells that passed quality are used for tSNE plots; Cp: 1888 cells, d1: 2216 cells, d7: 1200 cells, d14: 2148 cells, d28: 1271 cells, and d42: 1328 cells. E WGCNA and GO term analysis identified WNT4 as a hub gene of neurogenesis while WNT2B was highly associated with melanocyte development. scRNA-seq data of d14 pellets (with a total of 2148 cells and 3784 genes) was used for this computation.
Fig. 4
Fig. 4. WNT inhibition during pellet culture enhanced homogeneity of hiPSC chondrogenesis.
A Experimental scheme of WNT inhibition. B C59 treatment during pellet culture enhanced Saf-O staining and decreased off-target cells (yellow arrowheads) as compared to other WNT inhibition culture regiments. Top row scale bar = 400 µm. Bottom row scale bar = 200 µm. The experiment was performed twice with similar results. C Pellets treated with C59 in only pellet culture exhibited an increased GAG/DNA ratio compared to pellets treated with other culture regiments. *p = 0.00001 at d28. #p = 0.0228 at d42. Mean ± SEM. n = 4 pellets per group. Statistical significance was determined by one-way ANOVA with Tukey’s post hoc test at a specific time point. D C59 significantly decreased, but WNT3A significantly increased, CD146+/CD166+/CD45 progenitors at the Cp stage. Different letters are significantly different (a vs. b, p = 0.0005; a vs. c, p = 0.0021; b vs. c, p = 0.0001). Mean ± SEM. n = 3 per group (independent experiment). Statistical significance was determined by one-way ANOVA with Tukey’s post hoc test. E RNA-FISH of d28 pellets showing C59-treated pellets had decreased WNT3A and WNT4 labeling (green) but more homogenous COL2A1 distribution (red) in the pellets. Scale bar = 200 µm. The experiment was performed twice with similar results.
Fig. 5
Fig. 5. scRNA-seq of pellets with WNT inhibition shows improved chondrogenesis.
A scRNA-seq was performed on the pellets with WNT inhibition. B Chondrocytes and mesenchymal cells were two major populations in C59-treated pellets. Cells that passed quality control were used for tSNE plots; hiPSC: 4798 cells, Cp: 1888 cells, d7: 1682 cells, d14: 3076 cells, d28: 1756 cells, and d42: 1483 cells. C Differentiation trajectory of C59-treated pellets. scRNA-seq data with a total of 14,683 cells from the stage of hiPSC, Cp as well as d7, d14, d28, and d42 C59-treated pellets were used to reconstruct the differentiation trajectory. D C59-treated pellets exhibited decreased neurogenic markers but increased chondrogenic markers. E Multiple CCA alignment of d7–d42 pellets. A total of 7977 cells from d7–d42 timepoints of C59-treated pellets were used to perform CCA alignment. F Dynamic changes in gene expression and percentages of chondrocyte subpopulations over time. G Heat map of top 20 DEGs at each timepoint for LECT1/EPYC/FRZB+ early mature chondrocytes.
Fig. 6
Fig. 6. CCA analysis reveals that most WNTs, except WNT5B, were secreted by off-target cells.
A Three major conserved populations in d14 pellets. A total of 5224 cells from the d14 pellets with or without C59 treatment was analyzed. B Violin plots of the specific markers for each conserved population. C C59-treated pellets comprised more chondrocytes and mesenchymal cells. D Expression levels of chondrogenic markers were higher in C59-treated pellets while expression of neurogenic markers and melanocyte markers was higher in TGF-β3-treated pellets. E Dot plot showing proliferative cells (mainly neural cells) from TGF-β3-treated pellets had high expression levels of WNT ligands. WNT inhibition largely decreased expression levels of WNTs in cells. F Western blots confirm that WNT inhibition significantly decreased WNTs in cells at protein levels. *p = 0.026, #p = 0.021, $p = 0.0003, p = 0.00029, p = 0.021 to its corresponding group. Mean ± SEM. n = 3 per treatment condition. Statistical significance was determined by a two-tailed Student’s t test for the groups with or without specific WNT inhibition. G Most WNTs were upregulated along the lineage of neural cells, where WNT5B was clustered with chondrogenic differentiation in TGF-β3-treated pellets. A total of 2148 cells from the TGF-β3-treated d14 pellets was analyzed and used to generate the heatmap.
Fig. 7
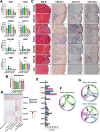
Fig. 7. Heterogenous multicellular WNT signaling models.
A, B RT-qPCR and GAG/DNA ratios of pellets treated with various WNTs during pellet culture. Different letters are significantly different from each other (p < 0.05). Mean ± SEM. n = 3–4 pellets per group. Statistical significance was determined by one-way ANOVA with Tukey’s post hoc test. C WNT treatment increased infiltration of off-target cells (pink arrowheads and white dashed lines) into the pellets, decreased COL2A1 staining, but increased COL1A1 (yellow arrowheads) and COL10A1 staining in the pellets. The pellets with C59 treatment exhibited homogenous COL2A1 staining and decreased COL1A1 and COL10A1 staining. Scale bar = 0.2 mm. The experiment was performed twice with similar results. D Heatmap showing distinct expression levels of various WNTs in various cellular subpopulations in d14 TGF-β3-treated pellets. A total of 2148 cells from the TGF-β3-treated d14 pellets was analyzed and used to generate the heatmap. E Percentage of the cells expressing WNT3A and its putative receptors in d14 TGF-β3-treated pellets. F, G Heterogenous multicellular signaling models in d14 TGF-β3-treated pellets.

Comment in

References

    1. Adkar SS, et al. Genome engineering for personalized arthritis therapeutics. Trends Mol. Med. 2017;23:917–931. doi: 10.1016/j.molmed.2017.08.002. - DOI - PMC - PubMed
    1. Nam Y, Rim YA, Jung SM, Ju JH. Cord blood cell-derived iPSCs as a new candidate for chondrogenic differentiation and cartilage regeneration. Stem Cell Res. Ther. 2017;8:16. doi: 10.1186/s13287-017-0477-6. - DOI - PMC - PubMed
    1. Koyama N, et al. Human induced pluripotent stem cells differentiated into chondrogenic lineage via generation of mesenchymal progenitor cells. Stem Cells Dev. 2012;22:102–113. doi: 10.1089/scd.2012.0127. - DOI - PubMed
    1. Craft AM, et al. Generation of articular chondrocytes from human pluripotent stem cells. Nat. Biotechnol. 2015;33:638. doi: 10.1038/nbt.3210. - DOI - PubMed
    1. Yamashita A, et al. Generation of scaffoldless hyaline cartilaginous tissue from human iPSCs. Stem Cell Rep. 2015;4:404–418. doi: 10.1016/j.stemcr.2015.01.016. - DOI - PMC - PubMed

Publication types

MeSH terms

Substances