

Fine scale human genetic structure in three regions of Cameroon reveals episodic diversifying selection
- PMID: 33441574
- PMCID: PMC7807043
- DOI: 10.1038/s41598-020-79124-1
Fine scale human genetic structure in three regions of Cameroon reveals episodic diversifying selection
Abstract
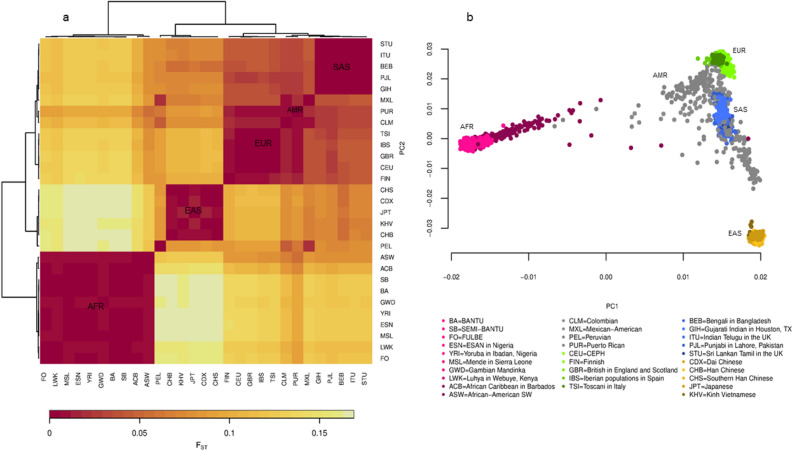
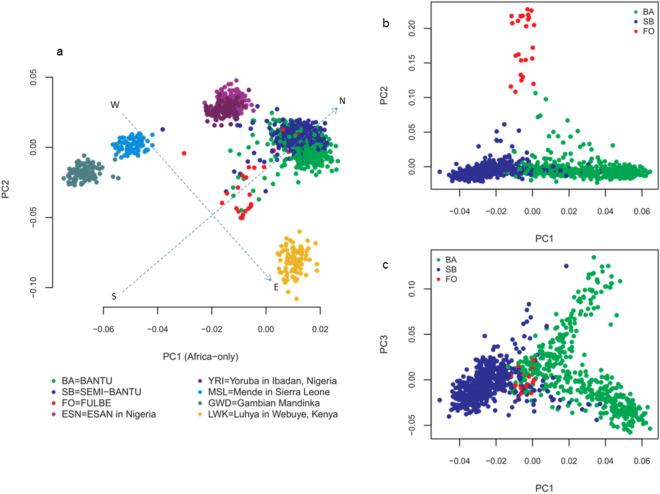
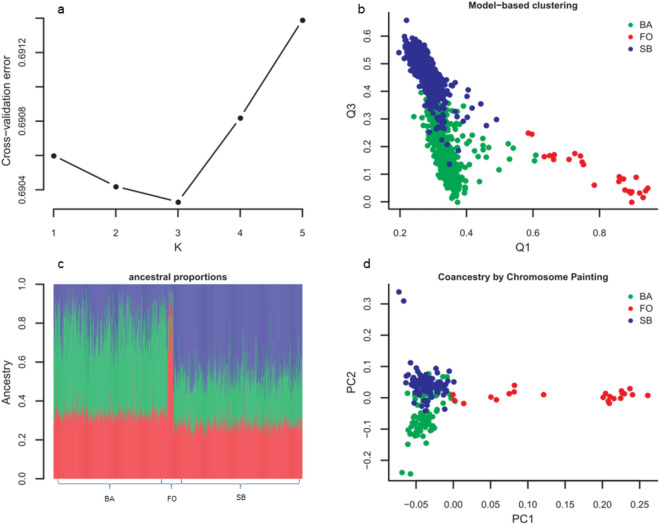
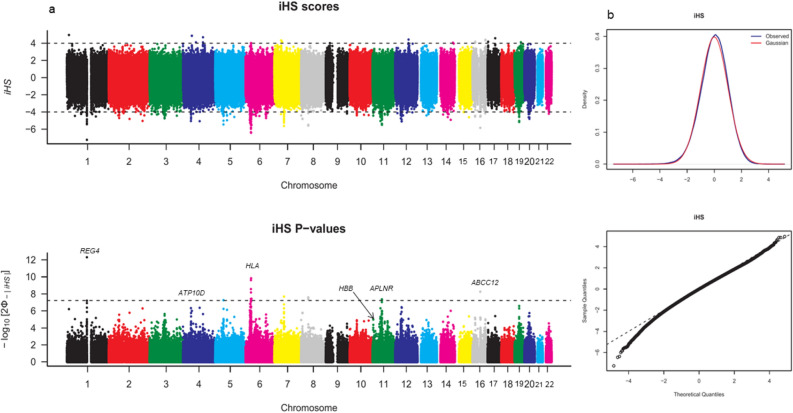
Inferences from genetic association studies rely largely on the definition and description of the underlying populations that highlight their genetic similarities and differences. The clustering of human populations into subgroups (population structure) can significantly confound disease associations. This study investigated the fine-scale genetic structure within Cameroon that may underlie disparities observed with Cameroonian ethnicities in malaria genome-wide association studies in sub-Saharan Africa. Genotype data of 1073 individuals from three regions and three ethnic groups in Cameroon were analyzed using measures of genetic proximity to ascertain fine-scale genetic structure. Model-based clustering revealed distinct ancestral proportions among the Bantu, Semi-Bantu and Foulbe ethnic groups, while haplotype-based coancestry estimation revealed possible longstanding and ongoing sympatric differentiation among individuals of the Foulbe ethnic group, and their Bantu and Semi-Bantu counterparts. A genome scan found strong selection signatures in the HLA gene region, confirming longstanding knowledge of natural selection on this genomic region in African populations following immense disease pressure. Signatures of selection were also observed in the HBB gene cluster, a genomic region known to be under strong balancing selection in sub-Saharan Africa due to its co-evolution with malaria. This study further supports the role of evolution in shaping genomes of Cameroonian populations and reveals fine-scale hierarchical structure among and within Cameroonian ethnicities that may impact genetic association studies in the country.
Conflict of interest statement
The authors declare no competing interests.
Figures

Similar articles
-
Genome-wide association study identifies novel candidate malaria resistance genes in Cameroon.Hum Mol Genet. 2023 Jun 5;32(12):1946-1958. doi: 10.1093/hmg/ddad026. Hum Mol Genet. 2023. PMID: 36752565 Free PMC article.
-
A genomic analysis identifies a novel component in the genetic structure of sub-Saharan African populations.Eur J Hum Genet. 2011 Jan;19(1):84-8. doi: 10.1038/ejhg.2010.141. Epub 2010 Aug 25. Eur J Hum Genet. 2011. PMID: 20736976 Free PMC article.
-
High Levels of Genetic Diversity within Nilo-Saharan Populations: Implications for Human Adaptation.Am J Hum Genet. 2020 Sep 3;107(3):473-486. doi: 10.1016/j.ajhg.2020.07.007. Epub 2020 Aug 10. Am J Hum Genet. 2020. PMID: 32781046 Free PMC article.
-
African genetic diversity provides novel insights into evolutionary history and local adaptations.Hum Mol Genet. 2018 Aug 1;27(R2):R209-R218. doi: 10.1093/hmg/ddy161. Hum Mol Genet. 2018. PMID: 29741686 Free PMC article. Review.
-
Genetic variation and adaptation in Africa: implications for human evolution and disease.Cold Spring Harb Perspect Biol. 2014 Jul 1;6(7):a008524. doi: 10.1101/cshperspect.a008524. Cold Spring Harb Perspect Biol. 2014. PMID: 24984772 Free PMC article. Review.
Cited by
-
Genome-wide association study identifies novel candidate malaria resistance genes in Cameroon.Hum Mol Genet. 2023 Jun 5;32(12):1946-1958. doi: 10.1093/hmg/ddad026. Hum Mol Genet. 2023. PMID: 36752565 Free PMC article.
-
Genome-wide association studies on malaria in Sub-Saharan Africa: A scoping review.PLoS One. 2025 May 16;20(5):e0309268. doi: 10.1371/journal.pone.0309268. eCollection 2025. PLoS One. 2025. PMID: 40378106 Free PMC article.
References
Publication types
MeSH terms
Substances
Grants and funding
LinkOut - more resources
Full Text Sources
Other Literature Sources
Research Materials
