. 2021 Jan 13;11(1):932.
doi: 10.1038/s41598-020-79656-6.

Altered hippocampal gene expression, glial cell population, and neuronal excitability in aminopeptidase P1 deficiency

Affiliations

Altered hippocampal gene expression, glial cell population, and neuronal excitability in aminopeptidase P1 deficiency

Sang Ho Yoon et al. Sci Rep. .

Abstract

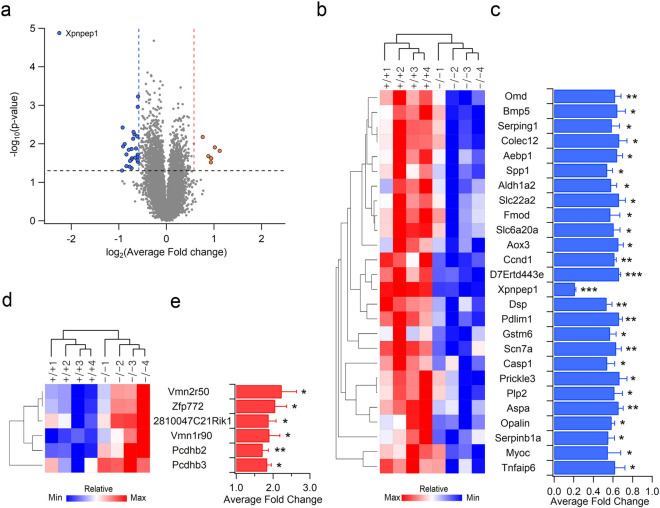
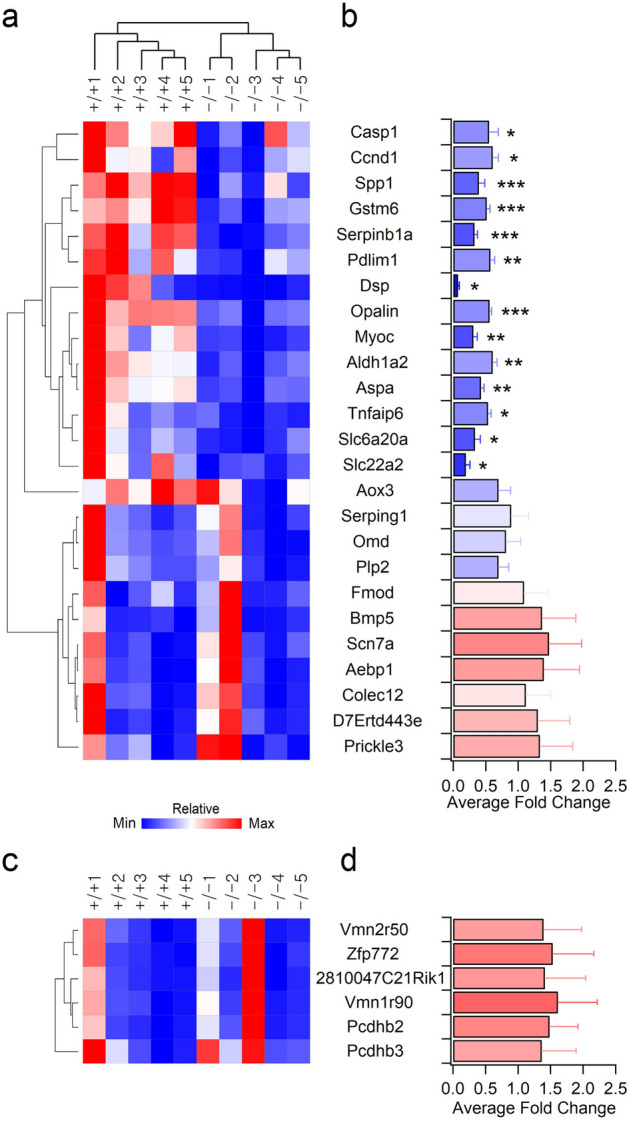
Inborn errors of metabolism are often associated with neurodevelopmental disorders and brain injury. A deficiency of aminopeptidase P1, a proline-specific endopeptidase encoded by the Xpnpep1 gene, causes neurological complications in both humans and mice. In addition, aminopeptidase P1-deficient mice exhibit hippocampal neurodegeneration and impaired hippocampus-dependent learning and memory. However, the molecular and cellular changes associated with hippocampal pathology in aminopeptidase P1 deficiency are unclear. We show here that a deficiency of aminopeptidase P1 modifies the glial population and neuronal excitability in the hippocampus. Microarray and real-time quantitative reverse transcription-polymerase chain reaction analyses identified 14 differentially expressed genes (Casp1, Ccnd1, Myoc, Opalin, Aldh1a2, Aspa, Spp1, Gstm6, Serpinb1a, Pdlim1, Dsp, Tnfaip6, Slc6a20a, Slc22a2) in the Xpnpep1-/- hippocampus. In the hippocampus, aminopeptidase P1-expression signals were mainly detected in neurons. However, deficiency of aminopeptidase P1 resulted in fewer hippocampal astrocytes and increased density of microglia in the hippocampal CA3 area. In addition, Xpnpep1-/- CA3b pyramidal neurons were more excitable than wild-type neurons. These results indicate that insufficient astrocytic neuroprotection and enhanced neuronal excitability may underlie neurodegeneration and hippocampal dysfunction in aminopeptidase P1 deficiency.


Conflict of interest statement

The authors declare no competing interests.

Figures

Figure 1
Figure 1
Microarray analysis of gene expression profiling in the Xpnpep1−/− hippocampus. (a) Volcano plot showing the fold change and p value of the individual probe sets by microarray analysis. The vertical lines indicate 1.5-fold up-regulation (dotted red line) and down-regulation (dotted blue line), respectively. The horizontal dotted line represents the cutoff significance level (p = 0.05). The red and blue dots indicate up-regulated and down-regulated genes, respectively, with statistical significance. (b) The down-regulated genes in the Xpnpep1−/− hippocampus are visualized by heatmap and hierarchical clustering. Each gene and sample were clustered by similarity between the expression patterns of genes. Red indicates high relative expression and blue indicates low relative expression. (c) Bar graphs represent average fold changes of down-regulated genes in the Xpnpep1−/− hippocampus. (d,e) Treeview and hierarchical clustering (d) and average fold changes (e) of up-regulated genes in the Xpnpep1−/− hippocampus. (b,d) Male: +/+1, +/+4, −/− 1, and −/−4; female: +/+2, +/+3, −/−2, and −/−3. (c,e) *p < 0.05; **p < 0.01; ***p < 0.001 by Student’s t-test, n = 4 pairs.
Figure 2
Figure 2
Validation of microarray results by quantitative reverse transcription PCR (qRT-PCR) (a,b) qRT-PCR validation of 25 down-regulated genes identified by microarray analysis. (a) Genes with similar expression patterns were clustered and visualized by Treeview. (b) Average fold changes in expression levels of genes identified as down-regulated genes from microarray analysis were analyzed by qRT-PCR. *p < 0.05; **p < 0.01; ***p < 0.001 by Student’s t-test, n = 5 pairs. (c,d) mRNA expression levels of genes identified as up-regulated genes from microarray analysis were not statistically different between genotypes. Treeview representation (c) and average fold changes (d) of expression determined by qRT-PCR.
Figure 3
Figure 3
X-gal staining and immunohistochemistry revealed predominant neuronal expression of aminopeptidase P1 in the Xpnpep1+/− hippocampus. (a) Transmitted image of X-gal inclusions in the Xpnpep1+/− CA1 stratum radiatum region was merged with the fluorescence image of DAPI, NeuN, and/or MAP2. (b,c) Combined transmission and fluorescence of images show the presence of X-gal precipitates in the somata and dendrites of Xpnpep1+/− CA1 (b) and CA3 (c) neurons. (d) X-gal precipitates (black) were detected in the GC layer, hilus (polymorphic layer), and outer molecular layer of DG (left). Right, X-gal signals overlapped well with NeuN immunoreactive signals in the DG hilus. (e,f) Left, astrocytes in CA1 (e), and CA3 (f) stratum radiatum from the X-gal (top) stained sections were identified by immunohistochemical staining with GFAP and S100β (bottom). X-gal signals are rarely found in the cell body and processes of Xpnpep1+/− astrocytes (right). (g,h) Cell nuclei, neuronal dendrites, and astrocytic processes in the CA1 (g) and CA3 (h) areas from X-gal stained sections were labeled with DAPI, anti-MAP2, and anti-GFAP antibodies, respectively (left). Right, punctate X-gal signals in the CA1 stratum radiatum (g) and CA3 stratum lucidum (h) were predominantly localized in the MAP2-positive dendrites, but they were occasionally detected in GFAP-positive astrocyte processes. (i,j) Sections were stained with X-gal (left, top), and microglia located in the CA1 (i) and CA3 (j) stratum radiatum were immunostained with Iba1 (left, bottom). The merged images (right) show the absence of β-galactosidase activity in Xpnpep1+/− microglia. (k,l) After X-gal staining (left, top), oligodendrocytes in the CA1 stratum radiatum (k) and stratum oriens (l) were immunolabeled with anti-O4 antibodies (left, bottom). Right, X-gal signals were not observed in the O4-positive cells (arrows). (al) DAPI was used to label the nuclei of neurons and glia. Scale bars: 10 µm (j), 20 µm (ac,ei,k,l), and 100 µm (d).
Figure 4
Figure 4
Cellular localization of aminopeptidase P1 in hippocampal neurons. (a) Schematic diagram of the bicistronic expression vector. (b) Cultured hippocampal neurons were transfected with the bicistronic expression vector using a calcium phosphate method. The dendrites of transfected (EGFP-positive) and neighboring untransfected (EGFP-negative) neurons were visualized by MAP2. Exogenously expressed aminopeptidase P1 protein was mainly distributed in the soma and dendrites of cultured hippocampal neurons. Arrows indicate MAP2-negative axons of transfected neurons. Scale bars, 20 μm. (c) Distribution of aminopeptidase P1 in subcellular brain fractions. Endogenous aminopeptidase P1 was detected in all fractions, with the strongest signal observed in the cytosolic fractions (S2 and S3). Whole brain homogenates from WT and Xpnpep1–/– mice were used to determine the specificity of the aminopeptidase P1 antibody. S1, supernatant after P1 sedimentation; P1, crude nuclear fraction; S2, supernatant after P2 sedimentation; P2, crude synaptosomal pellet; S3, cytosolic; P3, light membranes; LP1, synaptosomal membranes.
Figure 5
Figure 5
Reduction of astrocytes in the Xpnpep1−/− hippocampus. (a) Astrocytes in the hippocampal CA3 regions from 4- to 5-week-old WT (top) and Xpnpep1−/− (bottom) mice were stained with GFAP and S100β antibodies. DAPI was used to visualize cell nuclei, and arrows indicate vacuoles. Immunofluorescence images of hippocampal CA3 regions show fewer astrocytes in Xpnpep1−/− mice than in WT mice. (b,c) Astrocytes in the CA1 (b) and DG (c) subfields of Xpnpep1+/+ (top) and Xpnpep1−/− (bottom) mice are visualized. Scale bars, 50 µm (ac). SP, stratum pyramidale; SR, stratum radiatum; SO, stratum oriens; ML, molecular layer; GL, granule cell layer. (df) The density of GFAP- and S100β-positive cells in the CA3, CA1, and DG regions were lower in Xpnpep1−/− mice than in WT mice. *p < 0.05; **p < 0.01; ***p < 0.001 by Student’s t-test, n = 6 slices from 3 mice for each genotype. (g) The morphology of astrocytes and cell nuclei in the hippocampal CA3 subfield were visualized by GFAP (green) and DAPI (blue), respectively. The morphological features of reactive astrocytes, such as hypertrophy and extension of processes, were not detected in Xpnpep1−/− astrocytes. Arrow indicates vacuole. Scale bars, 10 µm. (h) Sholl analysis of astrocyte complexity in the hippocampal CA3 subfield. n = 28 cells from 3 mice per genotype. p > 0.05 by Student’s t-test and Mann–Whitney test. (i) Representative western blots showing the expression levels of aminopeptidase P1 and GFAP in the hippocampal extracts. Western blotting using anti-α-tubulin antibody was performed to ensure equal protein loading and transfer, and quantification of protein levels in each sample. (j) Quantification of GFAP protein levels (right) in the Xpnpep1+/+ (n = 4) and Xpnpep1−/− (n = 4) hippocampus. t(6) = 4.62, **p = 0.0036 by Student’s t-test.
Figure 6
Figure 6
The density of microglia was increased in the Xpnpep1−/− CA3 area. (a) Representative images of hippocampal CA3 regions stained with CD68 and Iba1 antibodies showing a higher number of microglia in Xpnpep1−/− (bottom) than WT (top) mice. Scale bars, 50 µm. (b) Higher magnification views of areas indicated by the dotted white box in panel (a) show morphological features of normal resting microglia in both Xpnpep1+/+ (top) and Xpnpep1−/− (bottom) mice. Scale bars, 10 µm. Note the punctate immunoreactive signals of CD68 (arrows) near the cell body but not the processes of microglia. (c) Increased density of microglia in the Xpnpep1−/− CA3 region. n = 6 slices from 3 mice per genotype. U = 82 (Iba1+) and 102.5 (Iba1+CD68+), Z =  − 4.39 (Iba1+) and − 3.97 (Iba1+CD68+), ***p < 0.001 by Mann–Whitney test. (d) Microglia in the hippocampal CA1 area were immunostained with Iba1 antibodies (left) and merged (right) with DAPI signals. Scale bars, 50 µm. (e) Quantification of Iba1-positive cell density in hippocampal CA1 subfields. n.s., not significant. t(10) =  − 0.17, p = 0.87 by Student’s t-test. (f) Iba1-immnostained (left) and merged (right) images with DAPI staining showing normal density of microglia in the Xpnpep1−/− (bottom) DG subfield. Scale bars, 50 µm. (g) The density of microglia in the hippocampal DG is not changed by aminopeptidase P1 deficiency. n.s., not significant. t(10) = 1.59, p = 0.13 by Student’s t-test. (h,i) Western blot images (h) and quantification (i) of Iba1 and CD68 proteins in the hippocampal lysates. n = 4 pairs. α-tubulin was used as a loading control for western blotting. t(6) =  − 0.21 (Iba1) and − 0.81 (CD68), p = 0.84 (Iba1) and 0.45 (CD68) by Student’s t-test. n.s., not significant.
Figure 7
Figure 7
Hyperexcitability of CA3b pyramidal neurons in mice lacking aminopeptidase P1. (a) Mean traces of APs (n = 12 for each genotype) recorded in the CA3b pyramidal neurons. Inset, enlarged traces showing the peak amplitudes and time course of AP spikes. (b) Bar graphs represent the amplitude of APs in CA3b neurons. t(22) = 3.386, **p = 0.003 by Student’s t-test. (c) First order derivatives (dV/dt) of the membrane potential during the action potential were calculated from WT (n = 12, blue traces) and Xpnpep1−/− (n = 12; orange traces) CA3b neurons and plotted as a function of membrane voltage. (d) Sample traces of voltage response to hyperpolarizing current injection (500 ms) in CA3b pyramidal neurons. (e) Bar graphs represent the input resistance of CA3b pyramidal neurons measured by the hyperpolarizing step shown in (d). t(22) =  − 4.15, ***p < 0.001 by Student’s t-test. (f) Voltage responses shown in (d) were normalized to their maximum amplitude, and the initial portion of the responses is shown with an expanded time scale. (g) Increased membrane time constant in Xpnpep1−/− CA3b neurons. t(22) =  − 4.10, ***p < 0.001 by Student’s t-test. (h) Sample traces of APs recorded in CA3 neurons in response to depolarizing current pulses (100–500 pA, 500 ms). (i) Averaged F–I curves in CA3 pyramidal neurons from WT (n = 12 from 3 animals) and Xpnpep1−/− (n = 12 from 3 animals) mice. n.s., not significant (p > 0.05); *p < 0.05; **p < 0.01 by Student’s t-test. (j) The slopes of the F–I relationship measured between 100 and 300 pA of input current were plotted against Rin of each cell. The dashed line represents the best fit for the linear relation between the F–I gain and Rin. (k) Sample traces of membrane currents measured from WT and Xpnpep1−/− CA3b neurons. Inset, Voltage steps elicited from a holding potential of − 70 mV in 20 mV increments from − 120 to − 20 mV. (l) Current–voltage (I–V) relationship for net membrane current at the end of the voltage step recorded from Xpnpep1+/+ (n = 13 cells from 3 animals) and Xpnpep1−/− (n = 13 cells from 3 animals) CA3b neurons. n.s., not significant (p > 0.05); *p < 0.05; **p < 0.01 by Student’s t-test.

Similar articles

Cited by

References

    1. DeBerardinis RJ, Thompson CB. Cellular metabolism and disease: what do metabolic outliers teach us? Cell. 2012;148:1132–1144. doi: 10.1016/j.cell.2012.02.032. - DOI - PMC - PubMed
    1. Pan L, Vockley J. Neuropsychiatric symptoms in inborn errors of metabolism: incorporation of genomic and metabolomic analysis into therapeutics and prevention. Curr. Genet. Med. Rep. 2013;1:65–70. doi: 10.1007/s40142-012-0004-0. - DOI - PMC - PubMed
    1. van Karnebeek CD, Stockler S. Treatable inborn errors of metabolism causing intellectual disability: a systematic literature review. Mol. Genet. Metab. 2012;105:368–381. doi: 10.1016/j.ymgme.2011.11.191. - DOI - PubMed
    1. Campeau PM, Scriver CR, Mitchell JJ. A 25-year longitudinal analysis of treatment efficacy in inborn errors of metabolism. Mol. Genet. Metab. 2008;95:11–16. doi: 10.1016/j.ymgme.2008.07.001. - DOI - PubMed
    1. Cottrell GS, Hooper NM, Turner AJ. Cloning, expression, and characterization of human cytosolic aminopeptidase P: a single manganese(II)-dependent enzyme. Biochemistry. 2000;39:15121–15128. doi: 10.1021/bi001585c. - DOI - PubMed

Publication types

MeSH terms