. 2021 Jan 13;11(1):952.
doi: 10.1038/s41598-020-78654-y.

Multiplex gene and phenotype network to characterize shared genetic pathways of epilepsy and autism

Affiliations

Multiplex gene and phenotype network to characterize shared genetic pathways of epilepsy and autism

Jacqueline Peng et al. Sci Rep. .

Abstract

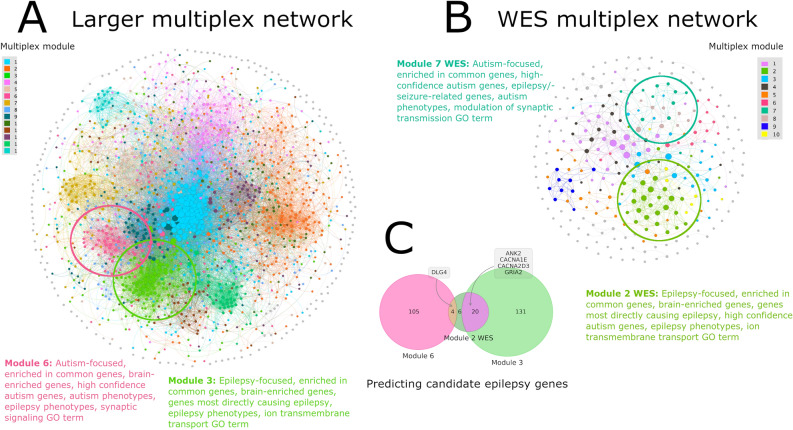
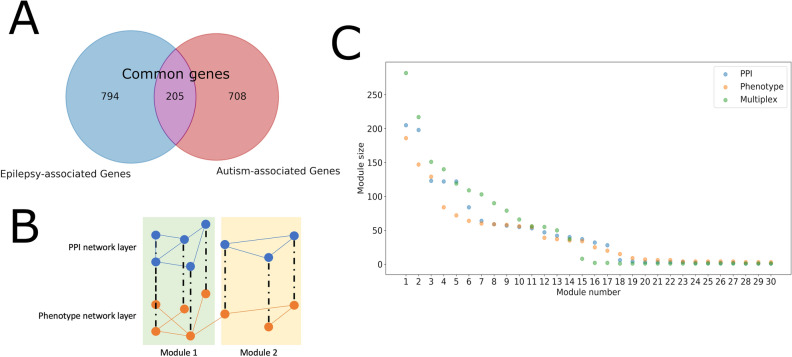
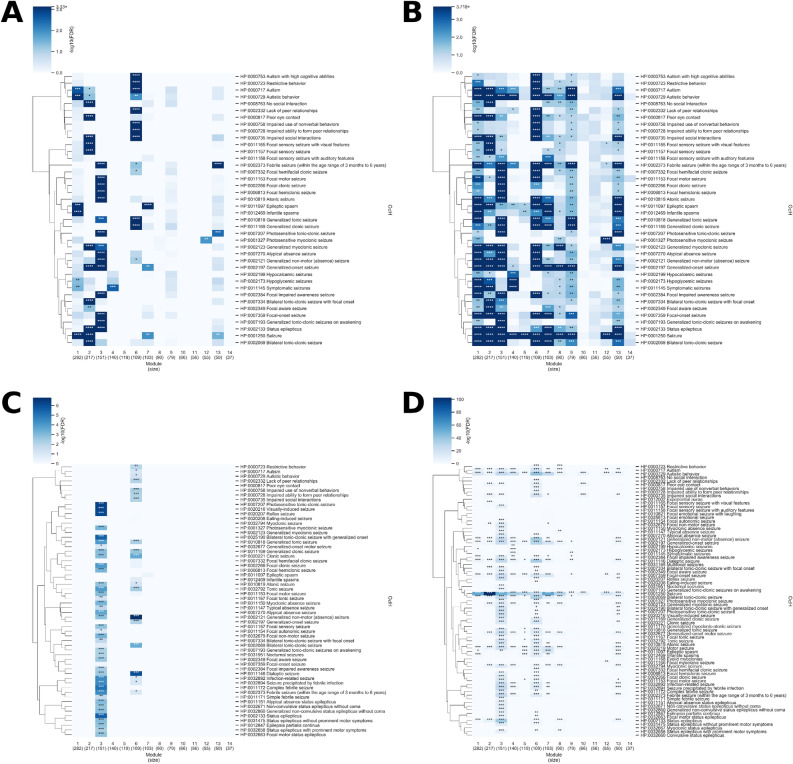
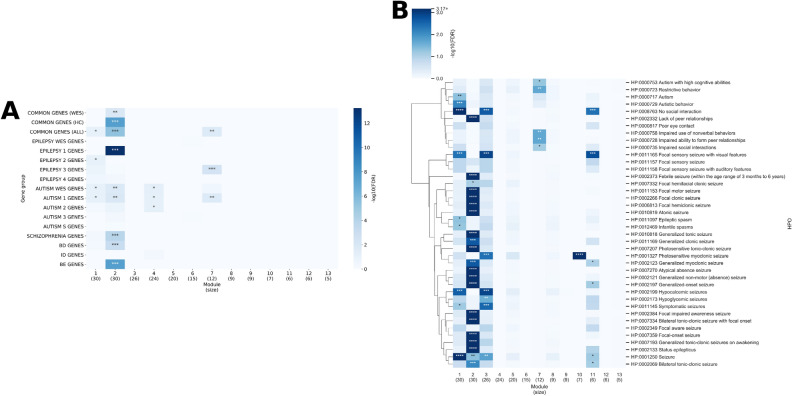
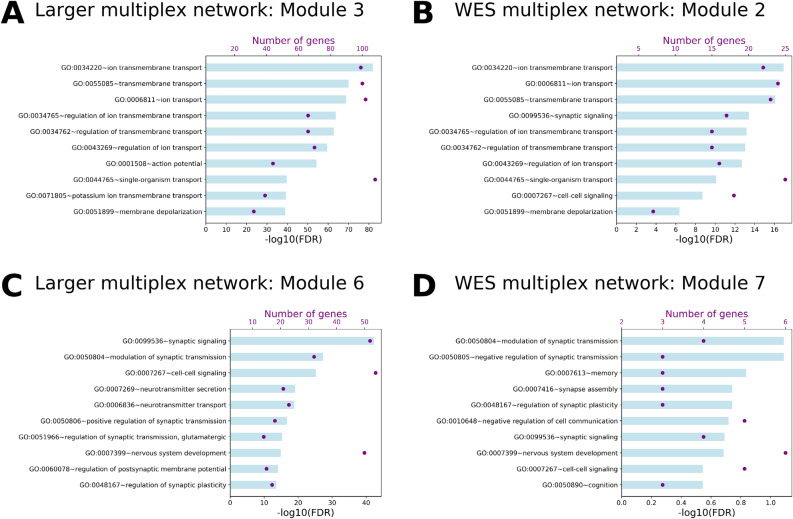
It is well established that epilepsy and autism spectrum disorder (ASD) commonly co-occur; however, the underlying biological mechanisms of the co-occurence from their genetic susceptibility are not well understood. Our aim in this study is to characterize genetic modules of subgroups of epilepsy and autism genes that have similar phenotypic manifestations and biological functions. We first integrate a large number of expert-compiled and well-established epilepsy- and ASD-associated genes in a multiplex network, where one layer is connected through protein-protein interaction (PPI) and the other layer through gene-phenotype associations. We identify two modules in the multiplex network, which are significantly enriched in genes associated with both epilepsy and autism as well as genes highly expressed in brain tissues. We find that the first module, which represents the Gene Ontology category of ion transmembrane transport, is more epilepsy-focused, while the second module, representing synaptic signaling, is more ASD-focused. However, because of their enrichment in common genes and association with both epilepsy and ASD phenotypes, these modules point to genetic etiologies and biological processes shared between specific subtypes of epilepsy and ASD. Finally, we use our analysis to prioritize new candidate genes for epilepsy (i.e. ANK2, CACNA1E, CACNA2D3, GRIA2, DLG4) for further validation. The analytical approaches in our study can be applied to similar studies in the future to investigate the genetic connections between different human diseases.


Conflict of interest statement

The authors declare no competing interests.

Figures

Figure 1
Figure 1
Summary of study findings. (A) A network of all 1707 epilepsy- and autism-associated genes from Wang et al. (2017) and SFARI and (B) A network of 294 epilepsy and autism genes from WES studies,. The edges represent the union of edges from the PPI network layer and phenotype network layer of the multiplex network. The color of a node represents the module it belongs to in the multiplex network and the size of the node is relative to its degree in the network. Key modules identified in the study are annotated. The network plots were generated using Gephi version 0.9.2, a graph visualization software. (C) The five autism-specific genes (i.e. not listed in Wang et al. (2017)) in module 3 and 6 of the larger multiplex network that overlap with epilepsy-focused module 2 of the WES network are predicted candidate epilepsy genes.
Figure 2
Figure 2
Similarity of the PPI and phenotype network layers in the epilepsy-autism multiplex network. (A) The degree distribution within each layer of the multiplex network is plotted. (B) There is a significant number of edges overlapping between the PPI network layer and phenotype network layer (p < 0.0001). The distribution represents the number of overlapping edges from 10,000 trials where the PPI network and phenotype network were randomly generated maintaining their original degree distribution. The red line represents the actual number of overlapping edges between the two networks. (C) There is a significant overlap in the modules in the PPI network layer and the modules in the phenotype network layer (p < 0.001). The distribution represents the normalized mutual information from 1000 trials where the PPI network and phenotype network were randomly generated maintaining their original degree distribution. The red line represents the actual normalized mutual information. (D) There is a correlation between the degree of a node in the PPI network layer and phenotype network layer. Each point represents one of the 1707 genes/nodes in the multiplex network.
Figure 3
Figure 3
Summary of multiplex network construction and network modules. (A) In the epilepsy-autism gene network there are a total of 1707 genes represented, including 999 epilepsy-associated genes and 913 autism-associated genes (205 genes are shared). (B) Using the 1707 genes a multiplex gene network was created. One layer of the multiplex network represents protein–protein interactions (PPIs) between the genes retrieved from the STRING database. The other layer was created using gene-phenotype relations retrieved from the Phen2Gene knowledge base. A multiplex version of the well-known Louvain algorithm was applied on the multiplex network to generate modules taking both layers of the network into consideration. The regular Louvain algorithm was also applied to each layer separately to generate modules using only one layer. (C) The figure plots the size of the 30 largest modules generated from the PPI network layer, the phenotype network layer, and the multiplex network.
Figure 4
Figure 4
Gene enrichment analysis on modules in the epilepsy-autism multiplex network. The enrichment analysis of different gene groups over the 14 largest modules in the epilepsy-autism multiplex network. The hypergeometric test was used to determine the p-value and the false discovery rate (FDR) is reported since multiple gene groups were tested. (A) The background of the hypergeometric test is the 1707 genes in the network. (B) The background of the hypergeometric test is 19,556 genes (the number of genes in the STRING database). COMMON GENES (WES) = genes in both the epilepsy and autism WES gene lists, COMMON GENES (HC) = genes that are both in the epilepsy 1 subgroup and autism 1 subgroup (high confidence), COMMON GENES (ALL) = all genes in both  epilepsy subgroup and autism subgroup, BD = bipolar disorder, ID = intellectual disability, BE GENES = genes that have significantly higher expression in brain tissue vs control tissue. For both A) and B), “***” denotes FDR < 0.01, “**” denotes FDR < 0.05, and “*” denotes FDR < 0.1, assuming a hypergeometric distribution. The heatmap was generated using seaborn version 0.10.0 (https://seaborn.pydata.org/).
Figure 5
Figure 5
Enrichment analysis of epilepsy- and autism-related HPO terms for modules in the multiplex network. The enrichment of different epilepsy and autism phenotypes over the 14 largest modules in the epilepsy-autism multiplex network is shown. The first cluster of HPO terms represent autism phenotypes and the rest represent epilepsy phenotypes. Only HPO IDs with gene-HPO relationships in the Phen2Gene knowledgebase are shown. The p-value was determined by computing the mean gene-phenotype association score for each HPO ID over the genes in the module and comparing it to the mean of 10,000 trials using n genes, where n is the size of the module, randomly chosen from (A) the 1707 genes in the multiplex network or (B) all genes in the Phen2Gene knowledge base. (C) and (D) correspond to (A) and (B), respectively, except that the phenotype enrichment was calculated using annotated gene-HPO relationships from hpo.jax.org, The hypergeometric test was used to determine the p-value and the false discovery rate (FDR) is reported. For all plots, the false discovery rate (FDR) is reported since multiple HPO IDs were tested. “****” denotes FDR < 0.0001, “***” denotes FDR < 0.01, “**” denotes FDR < 0.05, and “*” denotes FDR < 0.1. The clustermap was generated using seaborn version 0.10.0 (https://seaborn.pydata.org/). The linkage on the rows was generated based on the distance between HPO IDs in the HPO tree.
Figure 6
Figure 6
Enrichment analysis on modules in the multiplex network generated with WES epilepsy and autism genes. The enrichment analysis of (A) different gene groups and (B) epilepsy and autism phenotypes over the 13 largest modules (those that have at least 5 genes) in the multiplex network generated using only WES epilepsy and autism genes. (A) The hypergeometric test was used to determine the p-value for enrichment in each gene group. The false discovery rate (FDR) is reported since multiple gene groups were tested. The background of the hypergeometric test is the 294 genes in the network. COMMON GENES (WES) = genes in both the epilepsy and autism WES gene lists, COMMON GENES (HC) = genes that are both in the epilepsy 1 subgroup and autism 1 subgroup (high confidence), COMMON GENES (ALL) = all genes in an epilepsy subgroup and autism subgroup, BD = bipolar disorder, ID = intellectual disability, BE GENES = genes that have a significantly higher expression in brain tissue vs control tissue. (B) The first cluster of HPO terms represent autism phenotypes and the rest represent epilepsy phenotypes. Only HPO IDs with gene-HPO relationships in the Phen2Gene knowledgebase are shown. The p-value was determined by computing the mean gene-phenotype association score for each HPO ID over the genes in the module and comparing it to the mean of 10,000 trials using n genes, where n is the size of the module, randomly chosen from the 294 genes in the WES multiplex network. The FDR is reported since multiple HPO IDs were tested. For both (A) and (B) “***” denotes FDR < 0.01, “**” denotes FDR < 0.05, and “*” denotes FDR < 0.1 and for (B) “****” denotes FDR < 0.0001. The heatmap and cluster map were generated using seaborn version 0.10.0 (https://seaborn.pydata.org/). The linkage on the rows of the cluster map was generated based on the distance between HPO IDs in the HPO tree.
Figure 7
Figure 7
Comparison of prioritized modules in the WES multiplex network and larger epilepsy-autism multiplex network. The top 10 most significant biological process Gene Ontology terms by FDR are shown for (A) Module 3 and (B) Module 6 of the larger multiplex network and their corresponding modules (C) Module 2 and (D) Module 7 of the WES multiplex network.

Similar articles

Cited by

References

    1. Poduri A, Lowenstein D. Epilepsy genetics—past, present, and future. Curr. Opin. Genet. Dev. 2011;21:325–332. doi: 10.1016/j.gde.2011.01.005. - DOI - PMC - PubMed
    1. Persico AM, Napolioni V. Autism genetics. Behav. Brain Res. 2013;251:95–112. doi: 10.1016/j.bbr.2013.06.012. - DOI - PubMed
    1. Vorstman JAS, et al. Autism genetics: opportunities and challenges for clinical translation. Nat. Rev. Genet. 2017;18:362–376. doi: 10.1038/nrg.2017.4. - DOI - PubMed
    1. Ramaswami G, Geschwind DH. Genetics of autism spectrum disorder. Handb. Clin. Neurol. 2018;147:321–329. doi: 10.1016/B978-0-444-63233-3.00021-X. - DOI - PubMed
    1. Jeste SS, Geschwind DH. Disentangling the heterogeneity of autism spectrum disorder through genetic findings. Nat. Rev. Neurol. 2014;10:74–81. doi: 10.1038/nrneurol.2013.278. - DOI - PMC - PubMed

Publication types