. 2021 Jan 13;11(1):856.
doi: 10.1038/s41598-020-79998-1.

Enhanced oncolytic adenoviral production by downregulation of death-domain associated protein and overexpression of precursor terminal protein

Affiliations

Enhanced oncolytic adenoviral production by downregulation of death-domain associated protein and overexpression of precursor terminal protein

Jihyun Lee et al. Sci Rep. .

Abstract

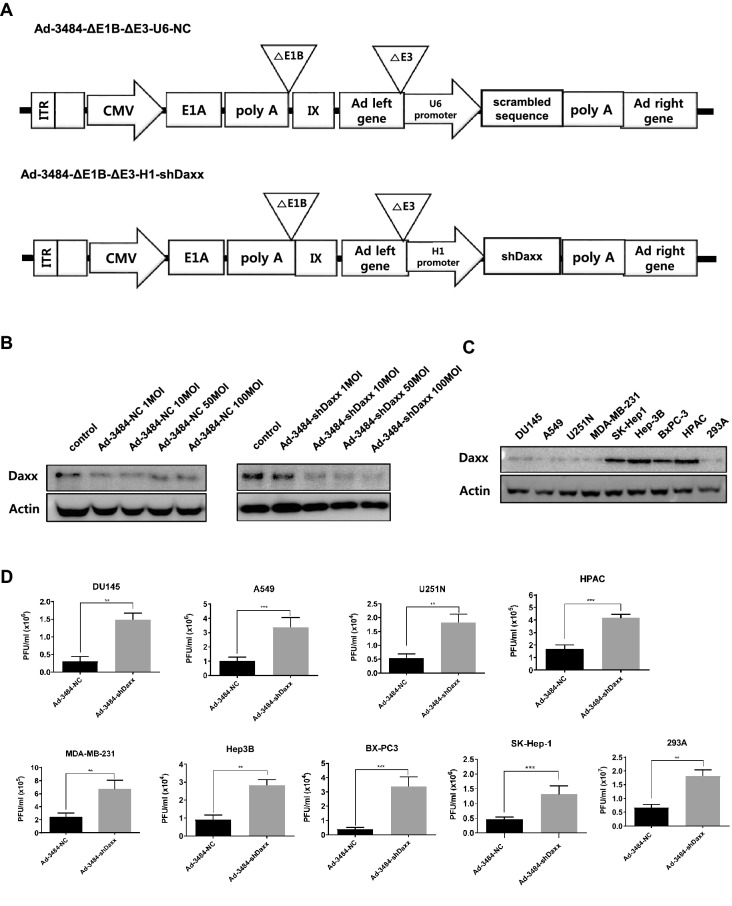
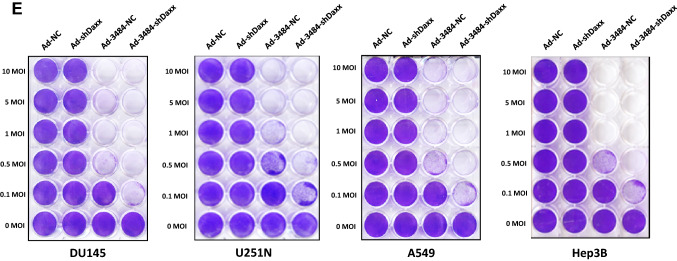
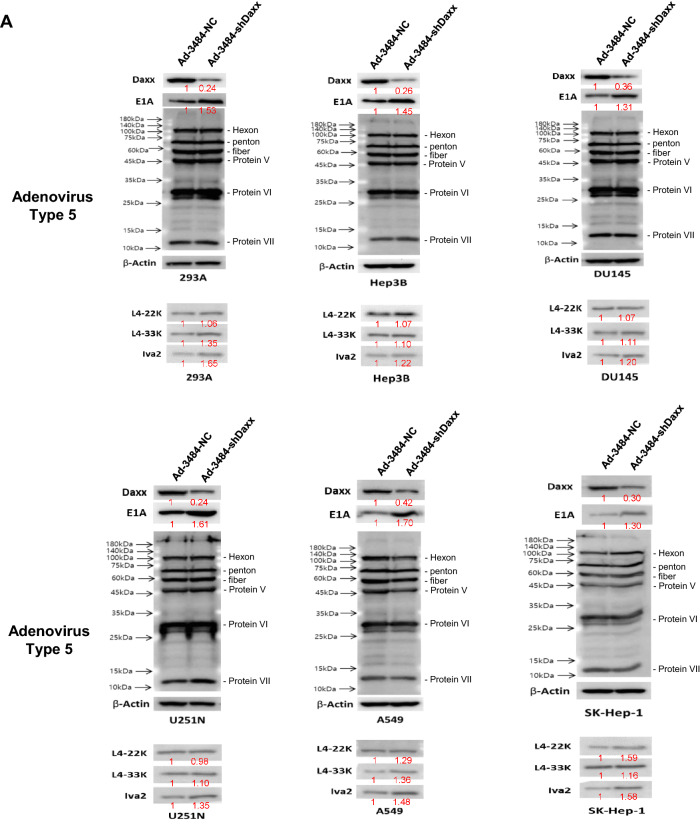
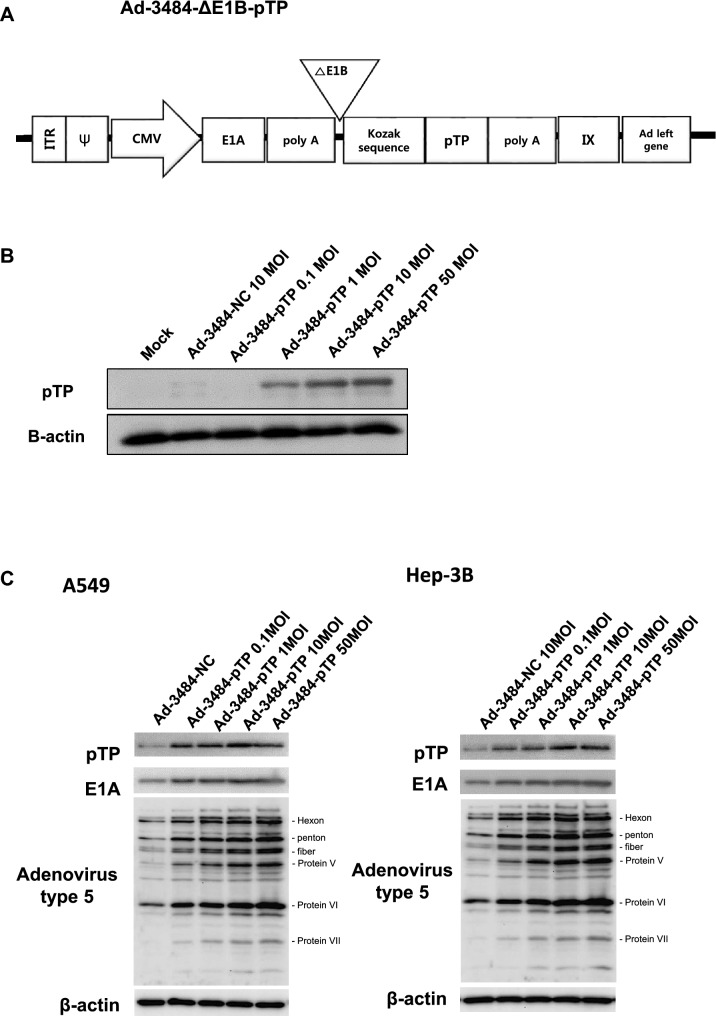
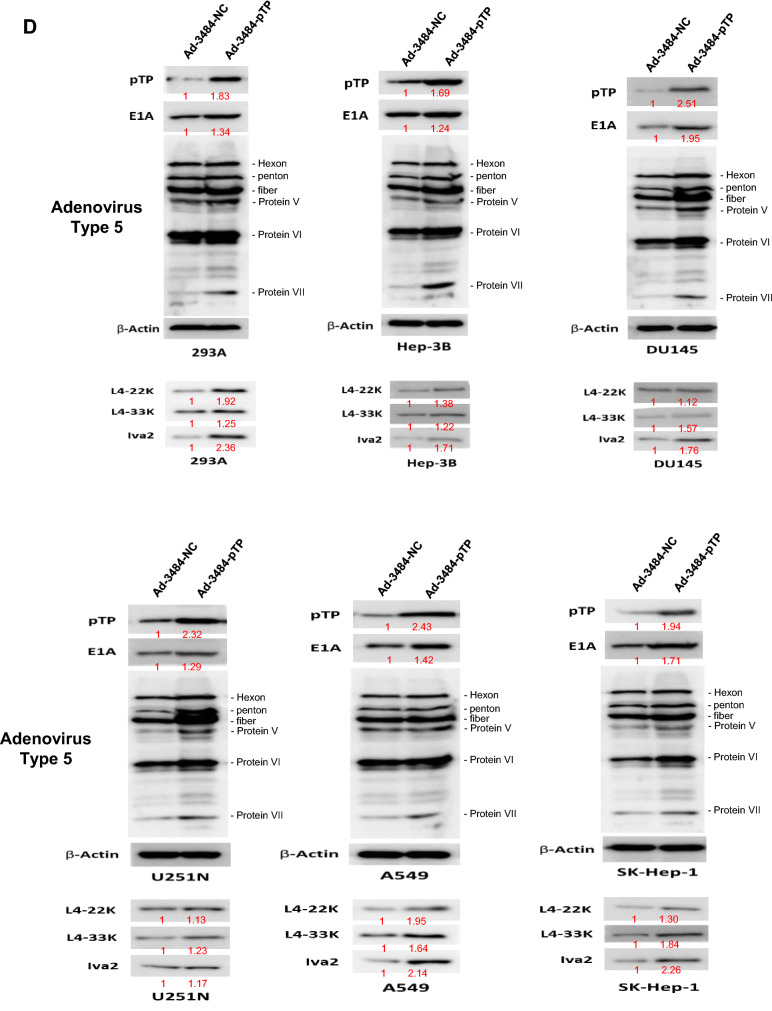
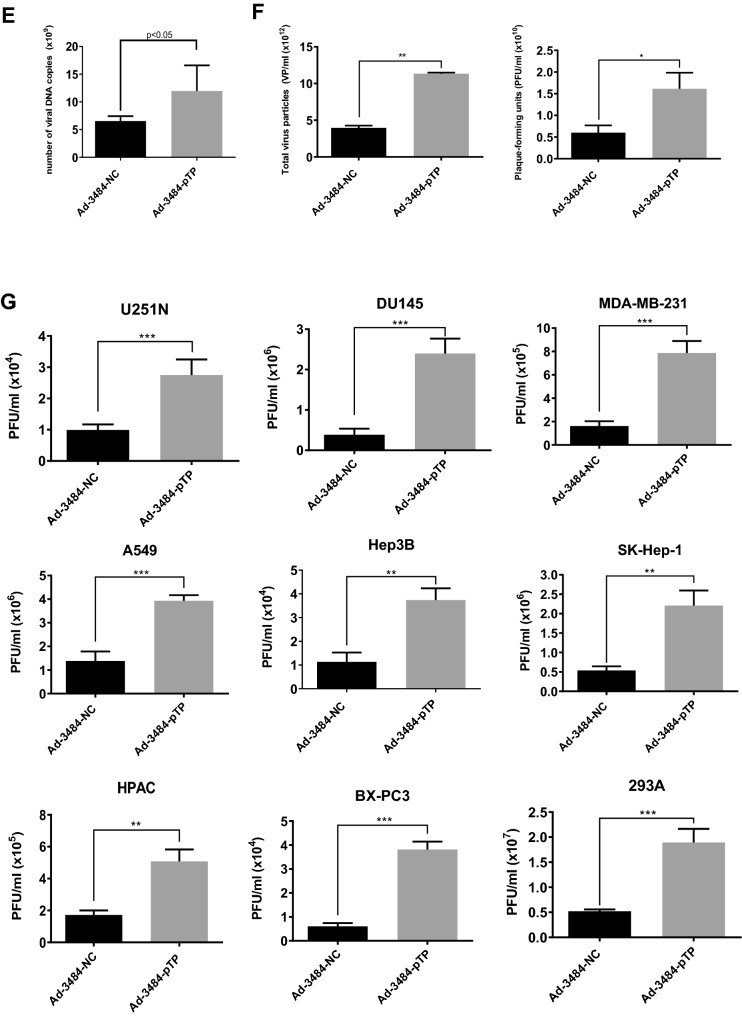
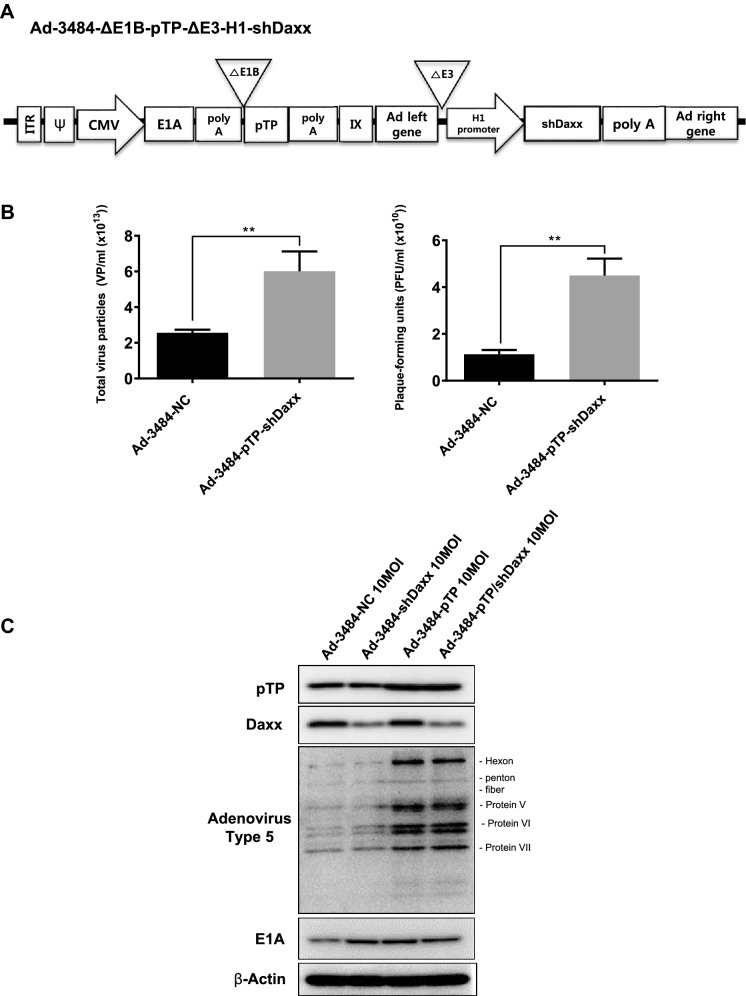
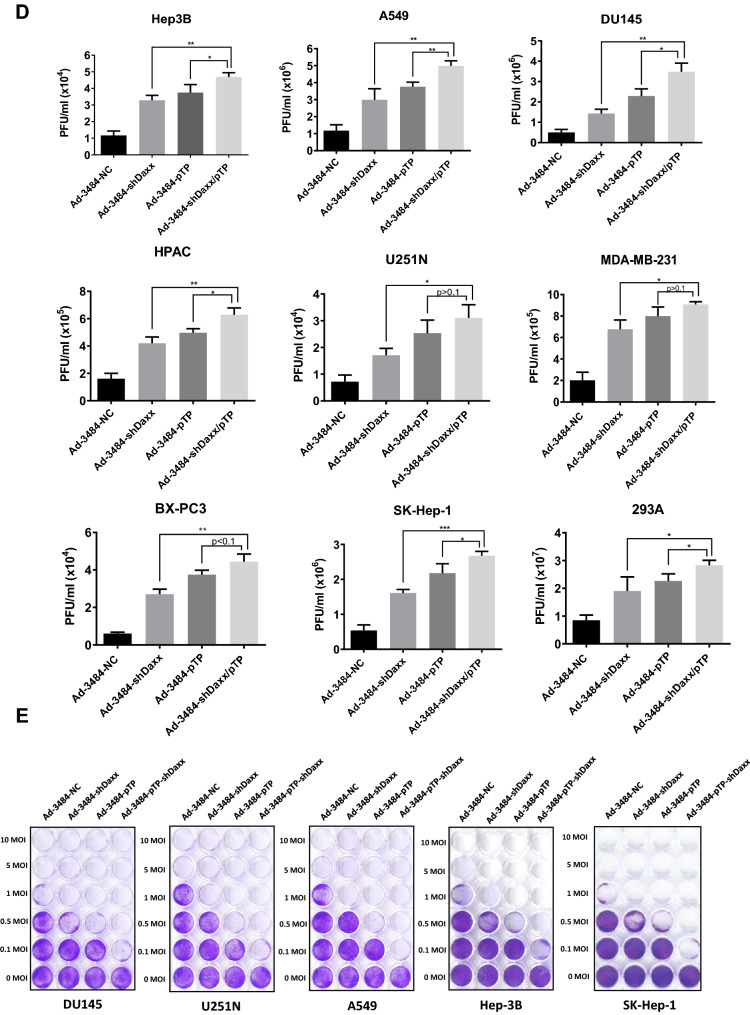
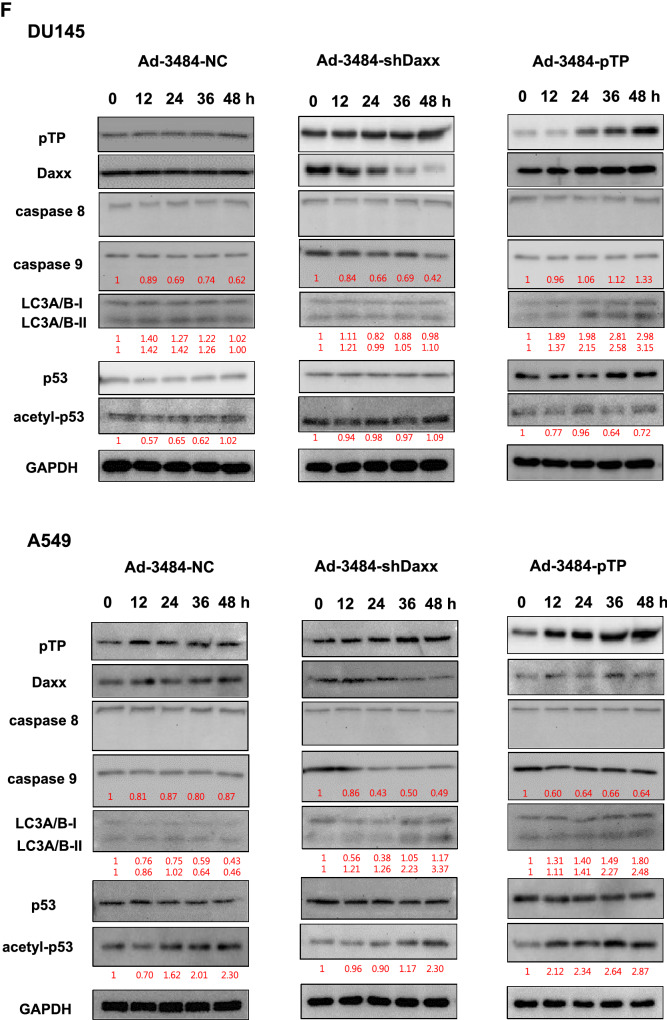
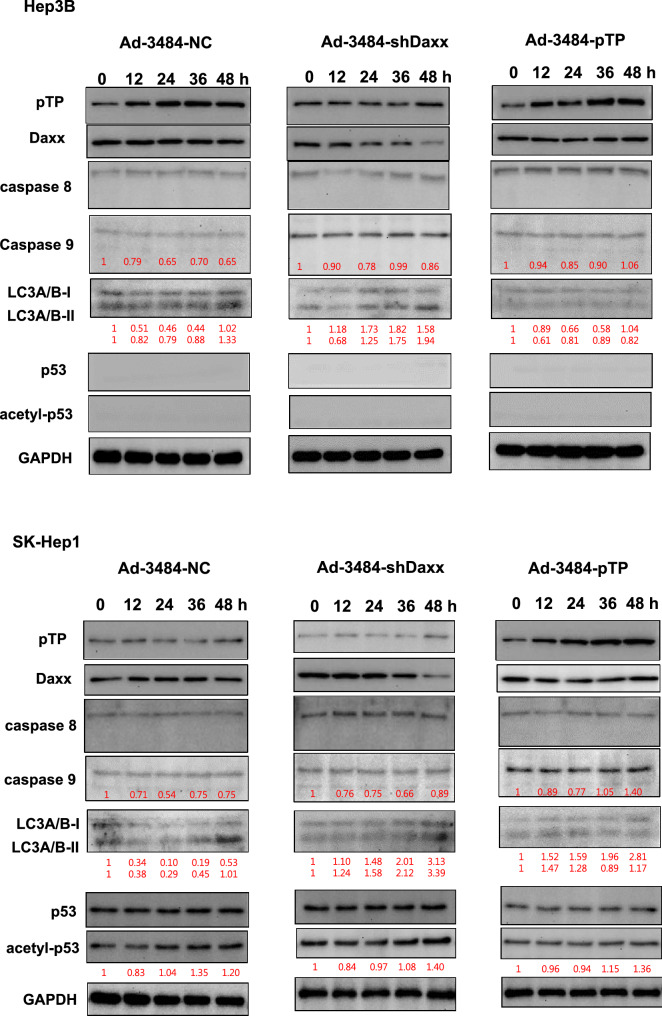
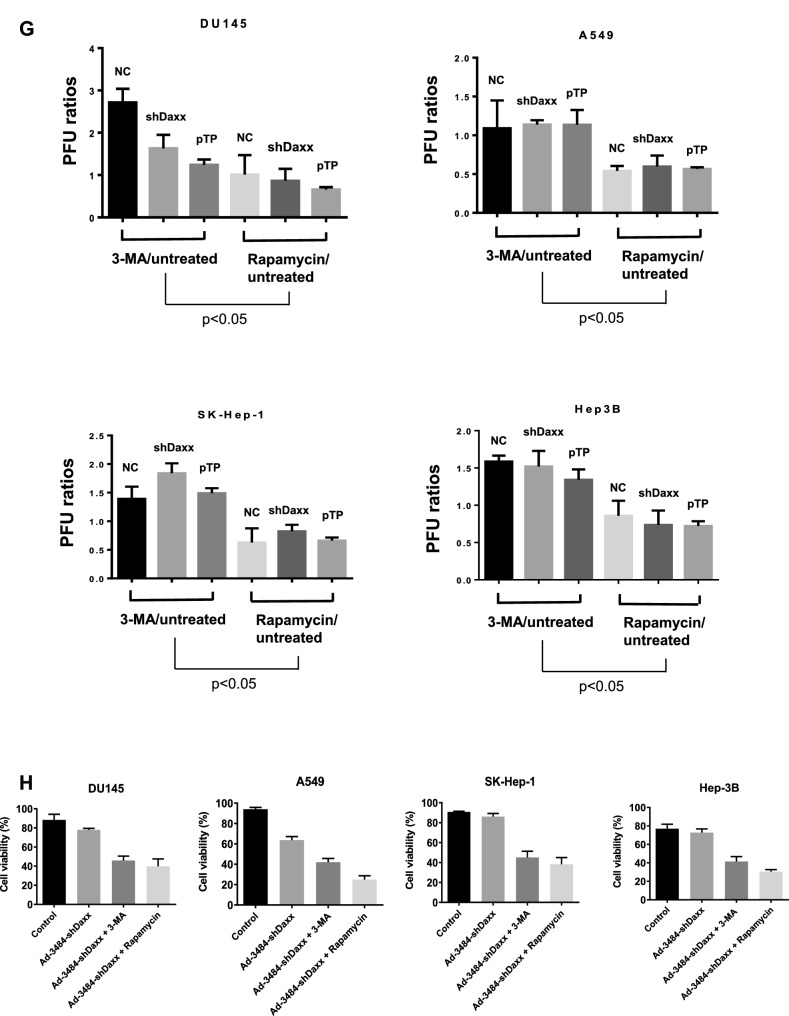
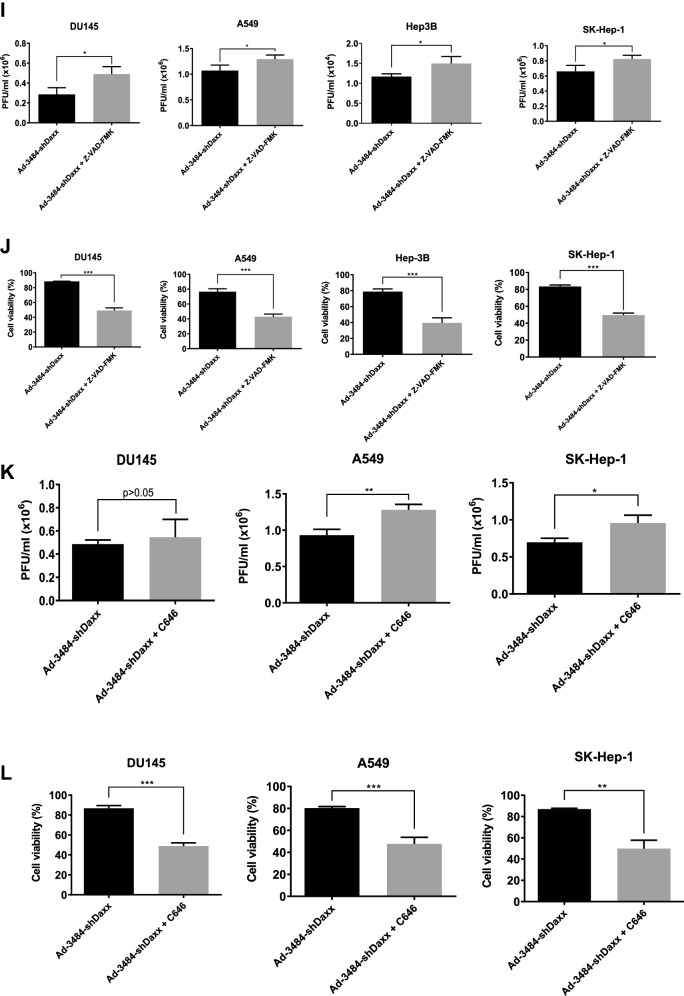
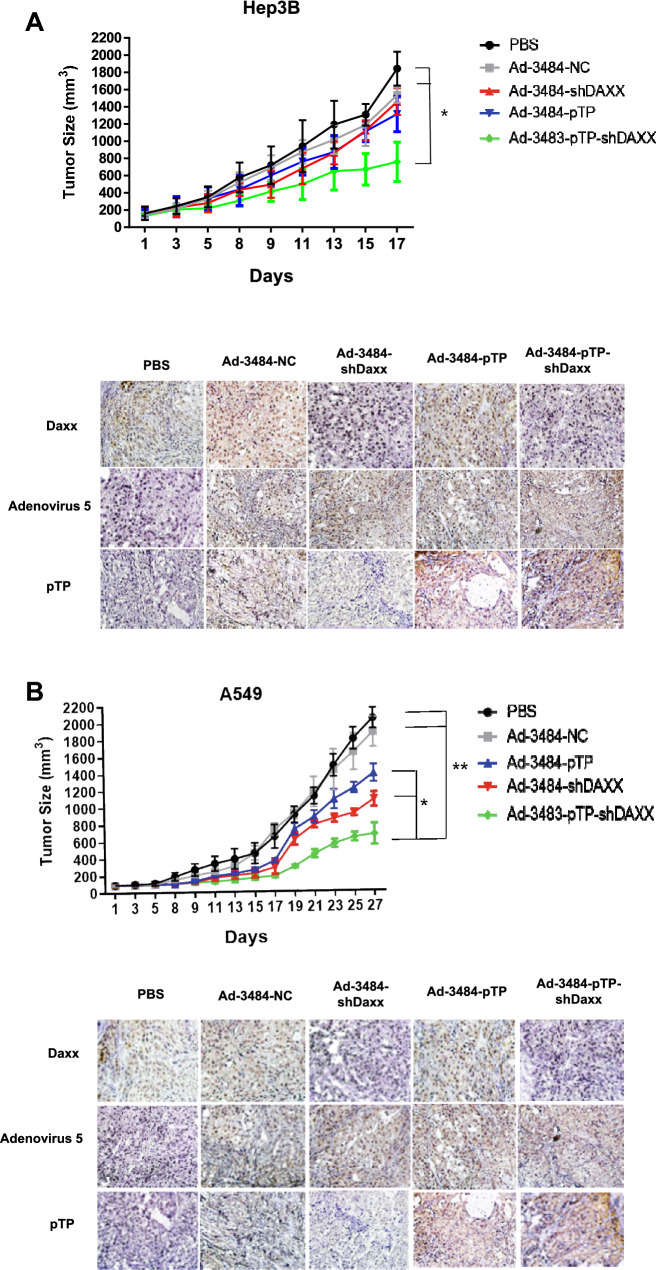
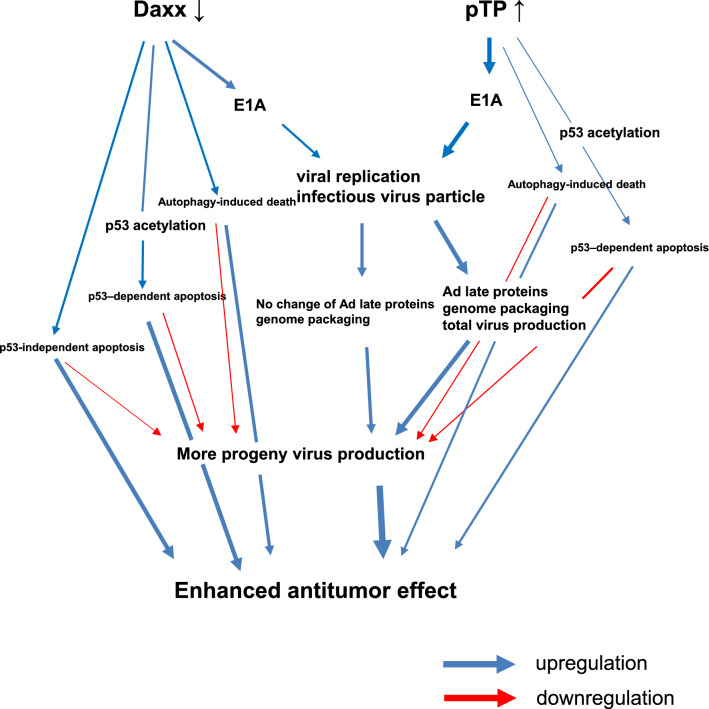
Adequate viral replication in tumor cells is the key to improving the anti-cancer effects of oncolytic adenovirus therapy. In this study, we introduced short hairpin RNAs against death-domain associated protein (Daxx), a repressor of adenoviral replication, and precursor terminal protein (pTP), an initiator of adenoviral genome replication, into adenoviral constructs to determine their contributions to viral replication. Both Daxx downregulation and pTP overexpression increased viral production in variety of human cancer cell lines, and the enhanced production of virus progeny resulted in more cell lysis in vitro, and tumor regression in vivo. We confirmed that increased virus production by Daxx silencing, or pTP overexpression, occurred using different mechanisms by analyzing levels of adenoviral protein expression and virus production. Specifically, Daxx downregulation promoted both virus replication and oncolysis in a consecutive manner by optimizing IVa2-based packaging efficiency, while pTP overexpression by increasing both infectious and total virus particles but their contribution to increased viral production may have been damaged to some extent by their another contribution to apoptosis and autophagy. Therefore, introducing both Daxx shRNA and pTP in virotherapy may be a suitable strategy to increase apoptotic tumor-cell death and to overcome poor viral replication, leading to meaningful reductions in tumor growth in vivo.


Conflict of interest statement

The authors declare no competing interests.

Figures

Figure 1
Figure 1
Enhanced adenovirus production by oncolytic adenovirus armed with Daxx shRNA. (A) Scheme of E1B55K-deleted oncolytic adenovirus armed with scrambled RNA (Ad-3484-NC) or Daxx shRNA (Ad-3484-shDaxx). (B) Expression of Daxx protein after infection with Ad-3484-NC or Ad-3484-shDaxx at the indicated MOIs for 48 h in DU145 cells. (C) Endogenous Daxx protein levels in various human cancer cells. (D) Plaque-forming unit (PFU) titration assays of adenovirus produced by each human cancer cell line following Ad-3484-NC or Ad-3484-shDaxx infection at MOI 50 for 48 h with exchanged media after PBS washing. Error bars represent standard errors from three independent experiments. P values less than 0.05 were considered statistically significant (*P < 0.05; **P < 0.01; ***P < 0.001). (E) Crystal violet oncolytic assay of DU145 (left), U251N (middle), and A549 cells (right) following Ad-NC, Ad-shDaxx, Ad-3484-NC, or Ad-3484-shDaxx infections at MOIs between 0 and 10 for 72 h. All cells remaining on plates were fixed with 4% paraformaldehyde and stained with 0.05% crystal violet.
Figure 1
Figure 1
Enhanced adenovirus production by oncolytic adenovirus armed with Daxx shRNA. (A) Scheme of E1B55K-deleted oncolytic adenovirus armed with scrambled RNA (Ad-3484-NC) or Daxx shRNA (Ad-3484-shDaxx). (B) Expression of Daxx protein after infection with Ad-3484-NC or Ad-3484-shDaxx at the indicated MOIs for 48 h in DU145 cells. (C) Endogenous Daxx protein levels in various human cancer cells. (D) Plaque-forming unit (PFU) titration assays of adenovirus produced by each human cancer cell line following Ad-3484-NC or Ad-3484-shDaxx infection at MOI 50 for 48 h with exchanged media after PBS washing. Error bars represent standard errors from three independent experiments. P values less than 0.05 were considered statistically significant (*P < 0.05; **P < 0.01; ***P < 0.001). (E) Crystal violet oncolytic assay of DU145 (left), U251N (middle), and A549 cells (right) following Ad-NC, Ad-shDaxx, Ad-3484-NC, or Ad-3484-shDaxx infections at MOIs between 0 and 10 for 72 h. All cells remaining on plates were fixed with 4% paraformaldehyde and stained with 0.05% crystal violet.
Figure 2
Figure 2
Increased viral infectivity by Daxx downregulation. (A) Western blot analysis for the detection of viral late gene products was performed in a variety of cancer cells as well as 293A cells infected with Ad-3484-NC or Ad-3484-shDaxx at 50 MOI for 48 h. The numbers indicate the relative band intensity of Ad-3484-shDaxx to control (Ad-3484-NC) after band intensities were measured with a densitometer. (B) Estimation of viral DNA copy number after infection with Ad-3484-shDaxx at 10 MOI for 24 h in 293A cells. After infection for 24 h, cultured cells and media were harvested. Purified DNA (CsCl gradient and Tris-dialysis of virus soup) was measured at OD260 and OD280 for copy-number calculations. Error bars represent standard errors from three independent experiments. P values less than 0.05 were considered statistically significant (*P < 0.05). (C) Virus particle estimation. After CsCl gradient and Tris-dialysis purification of the virus soup from 293A cells following infection with the same amount of each oncolytic adenovirus (Ad-3484-NC and Ad-3484-shDaxx), total virus particles (VP/ml) were calculated by measuring absorbance at OD260 (left) and the amounts of infectious virus particles were successfully calculated by TCID50 titration assays in 293A cells using plaque-forming units (PFU/ml) (right). Error bars represent standard errors from three independent experiments. P values less than 0.05 were considered statistically significant (*P < 0.05). (D) Infectious viral particles were estimated after transfection of pcDNA3.1-IVa2 followed by oncolytic control adenovirus in various HCC. Error bars represent standard errors from three independent experiments. P values less than 0.05 were considered statistically significant (*P < 0.05).
Figure 2
Figure 2
Increased viral infectivity by Daxx downregulation. (A) Western blot analysis for the detection of viral late gene products was performed in a variety of cancer cells as well as 293A cells infected with Ad-3484-NC or Ad-3484-shDaxx at 50 MOI for 48 h. The numbers indicate the relative band intensity of Ad-3484-shDaxx to control (Ad-3484-NC) after band intensities were measured with a densitometer. (B) Estimation of viral DNA copy number after infection with Ad-3484-shDaxx at 10 MOI for 24 h in 293A cells. After infection for 24 h, cultured cells and media were harvested. Purified DNA (CsCl gradient and Tris-dialysis of virus soup) was measured at OD260 and OD280 for copy-number calculations. Error bars represent standard errors from three independent experiments. P values less than 0.05 were considered statistically significant (*P < 0.05). (C) Virus particle estimation. After CsCl gradient and Tris-dialysis purification of the virus soup from 293A cells following infection with the same amount of each oncolytic adenovirus (Ad-3484-NC and Ad-3484-shDaxx), total virus particles (VP/ml) were calculated by measuring absorbance at OD260 (left) and the amounts of infectious virus particles were successfully calculated by TCID50 titration assays in 293A cells using plaque-forming units (PFU/ml) (right). Error bars represent standard errors from three independent experiments. P values less than 0.05 were considered statistically significant (*P < 0.05). (D) Infectious viral particles were estimated after transfection of pcDNA3.1-IVa2 followed by oncolytic control adenovirus in various HCC. Error bars represent standard errors from three independent experiments. P values less than 0.05 were considered statistically significant (*P < 0.05).
Figure 3
Figure 3
Enhanced production of progeny virus by introduction of the precursor terminal protein (pTP) gene. (A) Scheme of pTP-overexpressing E1B55K-deleted oncolytic adenovirus. (B) Expressions of pTP protein in DU145 cells after Ad-3484-pTP infection at indicated MOIs for 48 h. (C) Western blot analysis for detection of protein levels, including Adenovirus type 5, in A549 and Hep3B cells infected using various MOIs of Ad-3484-pTP for 48 h. (D) Western blot analysis for detection of protein levels, including adenovirus type 5, in various cancer cells as well as in 293A cells infected with 10 MOIs of Ad-3484-pTP for 48 h. The numbers indicate the relative band intensity of Ad-3484-pTP to control (Ad-3484-NC) after band intensities were measured with a densitometer. (E) Estimation of viral DNA copy number after pTP overexpression. After infection with Ad-3484-pTP at 10 MOI for 24 h in 293A cells, cells and media were harvested. Purified DNA after CsCl density gradient ultracentrifugation and Tris-dialysis of viral soup was measured at OD260 and OD280 for copy-number calculations. Error bars represent standard errors from three independent experiments. (F) After infections with the same amount of each oncolytic adenovirus (MOI 10 with Ad-3484-NC or Ad-3484-pTP), and purification of virus following CsCl density gradient ultracentrifugation and Tris-dialysis of viral soup from 293A cells, total virus particles (VP/ml) were calculated by measuring absorbance at OD260 and plaque-forming units (PFU/ml), which indicates that the amounts of infectious virus particles were successfully calculated by TCID50 titration assays in 293A cells. Error bars represent standard errors from three independent experiments. P values less than 0.05 were considered statistically significant (*P < 0.05). (G) PFU titration assays of adenovirus produced by each human cancer cell line following Ad-3484-NC or Ad-3484-pTP infections at MOI 50 for 4 h, and incubations for 48 h with media exchanged after PBS washing. Adenovirus packaging cells (293A) were infected at MOI 0.1. Error bars represent standard errors from three independent experiments. P values less than 0.05 were considered statistically significant (**P < 0.01; ***P < 0.001).
Figure 3
Figure 3
Enhanced production of progeny virus by introduction of the precursor terminal protein (pTP) gene. (A) Scheme of pTP-overexpressing E1B55K-deleted oncolytic adenovirus. (B) Expressions of pTP protein in DU145 cells after Ad-3484-pTP infection at indicated MOIs for 48 h. (C) Western blot analysis for detection of protein levels, including Adenovirus type 5, in A549 and Hep3B cells infected using various MOIs of Ad-3484-pTP for 48 h. (D) Western blot analysis for detection of protein levels, including adenovirus type 5, in various cancer cells as well as in 293A cells infected with 10 MOIs of Ad-3484-pTP for 48 h. The numbers indicate the relative band intensity of Ad-3484-pTP to control (Ad-3484-NC) after band intensities were measured with a densitometer. (E) Estimation of viral DNA copy number after pTP overexpression. After infection with Ad-3484-pTP at 10 MOI for 24 h in 293A cells, cells and media were harvested. Purified DNA after CsCl density gradient ultracentrifugation and Tris-dialysis of viral soup was measured at OD260 and OD280 for copy-number calculations. Error bars represent standard errors from three independent experiments. (F) After infections with the same amount of each oncolytic adenovirus (MOI 10 with Ad-3484-NC or Ad-3484-pTP), and purification of virus following CsCl density gradient ultracentrifugation and Tris-dialysis of viral soup from 293A cells, total virus particles (VP/ml) were calculated by measuring absorbance at OD260 and plaque-forming units (PFU/ml), which indicates that the amounts of infectious virus particles were successfully calculated by TCID50 titration assays in 293A cells. Error bars represent standard errors from three independent experiments. P values less than 0.05 were considered statistically significant (*P < 0.05). (G) PFU titration assays of adenovirus produced by each human cancer cell line following Ad-3484-NC or Ad-3484-pTP infections at MOI 50 for 4 h, and incubations for 48 h with media exchanged after PBS washing. Adenovirus packaging cells (293A) were infected at MOI 0.1. Error bars represent standard errors from three independent experiments. P values less than 0.05 were considered statistically significant (**P < 0.01; ***P < 0.001).
Figure 4
Figure 4
Enhanced virus production by both pTP and Daxx shRNA expressing E1B55K-deleted oncolytic adenovirus (Ad-3484-pTP-shDaxx). (A) Scheme of pTP and Daxx shRNA-both expressing E1B55K-deleted oncolytic adenovirus. (B) Virus particle amounts were determined after purification through a CsCl gradient and Tris-dialysis of virus soup from 293A cells. Following infection with the same amount of infectious oncolytic adenovirus (Ad-3484-NC and Ad-3484-pTP-shDaxx), total virus particles (VP/ml) (left) and plaque-forming units (PFU/ml) (right) were calculated. Error bars represent standard errors from three independent experiments. P values less than 0.05 were considered statistically significant (**P < 0.01). (C) Western blot analysis for the detection of protein levels, including adenovirus type 5, from DU145 cells infected with 10 MOI of Ad-3484-NC, Ad-3484-shDaxx, Ad-3484-pTP, or Ad-3484-pTP-shDaxx for 48 h. (D) PFU titration assays of adenovirus produced by each human cancer cell line following Ad-3484-NC, Ad-3484-shDaxx, Ad-3484-pTP, or Ad-3484-pTP-shDaxx infections at MOI 50 for 4 h, and incubation for 48 h with media exchanged after PBS washing. Adenovirus packaging cells (293A) were infected at MOI 0.1. Error bars represent standard errors from three independent experiments. (E) Oncolytic assays of various cancer cells (DU145, U251N, A549, Hep3B, and SK-Hep1) infected with Ad-3484-NC, Ad-3484-shDaxx, Ad-3484-pTP, or Ad-3484-pTP-shDaxx at MOIs between 0 and 10, for 72 h. All cells remaining on the plates were fixed with 4% paraformaldehyde and stained with 0.05% crystal violet. (F) Western blot analysis for detection of caspase 8, 9, LC3A/B-I, II, p53 and acetylated p53 (Lys382) protein levels in various cancer cells infected with 10 MOIs of Ad-3484-NC or Ad-3484-shDaxx or Ad-3484-pTP for each indicated time. The numbers indicate the relative band intensity of infected samples for each indicated time to control (0 h) after band intensities were measured with a densitometer. (G) Plaque-forming unit (PFU) titration assays of adenovirus in various cancer cells treated with autophagy inhibitor (3-MA 10 mM) or autophagy enhancer (rapamycin 50 nM) for 44 h after 4 h of infections with 10 MOIs of Ad-3484-NC, Ad-3484-shDaxx, or Ad-3484-pTP. PFU ratios mean that viral titer of 3-MA or rapamycin-treated cancer cells after infection NC, shDaxx or pTP virus divided by viral titer of untreated cancer cells after infection NC, shDaxx or pTP virus respectively. Error bars represent standard errors from three independent experiments. NC, Ad-3484-NC; shDaxx, Ad-3484-shDaxx; pTP, Ad-3484-pTP (H) Cell viability in various cancer cells treated with autophagy inhibitor (3-MA 10 mM) or autophagy enhancer (rapamycin 50 nM) for 44 h after 4 h of infections with 10 MOIs of Ad-3484-shDaxx. Cell viability was estimated by trypan blue exclusion. Error bars represent standard errors from three independent experiments. (I) Plaque-forming unit (PFU) titration assays of adenovirus in various cancer cells treated with pan caspase inhibitor (Z-VAD-FMK 10 μM) for 44 h after 4 h of infections with 10 MOIs of Ad-3484-shDaxx Error bars represent standard errors from three independent experiments. P values less than 0.05 were considered statistically significant (*P < 0.05). (J) Cell viability in various cancer cells treated with pan caspase inhibitor (Z-VAD-FMK 10 μM) for 44 h after 4 h of infections with 10 MOIs of Ad-3484-shDaxx. Cell viability was estimated by trypan blue exclusion. Error bars represent standard errors from three independent experiments. P values less than 0.05 were considered statistically significant (***P < 0.001). (K) Plaque-forming unit (PFU) titration assays of adenovirus in various cancer cells treated with histone acetyltransferase inhibitor (C646 25 μM) for 44 h after 4 h of infections with 10 MOIs of Ad-3484-shDaxx. Error bars represent standard errors from three independent experiments. P values less than 0.05 were considered statistically significant (*P < 0.05; **P < 0.01). (L) Cell viability in DU145, A549 and SK-Hep1 treated with histone acetyltransferase inhibitor (C646 25 μM) for 44 h after 4 h of infections with 10 MOIs of Ad-3484-shDaxx. Cell viability was estimated by trypan blue exclusion. Error bars represent standard errors from three independent experiments. P values less than 0.05 were considered statistically significant (***P < 0.001).
Figure 4
Figure 4
Enhanced virus production by both pTP and Daxx shRNA expressing E1B55K-deleted oncolytic adenovirus (Ad-3484-pTP-shDaxx). (A) Scheme of pTP and Daxx shRNA-both expressing E1B55K-deleted oncolytic adenovirus. (B) Virus particle amounts were determined after purification through a CsCl gradient and Tris-dialysis of virus soup from 293A cells. Following infection with the same amount of infectious oncolytic adenovirus (Ad-3484-NC and Ad-3484-pTP-shDaxx), total virus particles (VP/ml) (left) and plaque-forming units (PFU/ml) (right) were calculated. Error bars represent standard errors from three independent experiments. P values less than 0.05 were considered statistically significant (**P < 0.01). (C) Western blot analysis for the detection of protein levels, including adenovirus type 5, from DU145 cells infected with 10 MOI of Ad-3484-NC, Ad-3484-shDaxx, Ad-3484-pTP, or Ad-3484-pTP-shDaxx for 48 h. (D) PFU titration assays of adenovirus produced by each human cancer cell line following Ad-3484-NC, Ad-3484-shDaxx, Ad-3484-pTP, or Ad-3484-pTP-shDaxx infections at MOI 50 for 4 h, and incubation for 48 h with media exchanged after PBS washing. Adenovirus packaging cells (293A) were infected at MOI 0.1. Error bars represent standard errors from three independent experiments. (E) Oncolytic assays of various cancer cells (DU145, U251N, A549, Hep3B, and SK-Hep1) infected with Ad-3484-NC, Ad-3484-shDaxx, Ad-3484-pTP, or Ad-3484-pTP-shDaxx at MOIs between 0 and 10, for 72 h. All cells remaining on the plates were fixed with 4% paraformaldehyde and stained with 0.05% crystal violet. (F) Western blot analysis for detection of caspase 8, 9, LC3A/B-I, II, p53 and acetylated p53 (Lys382) protein levels in various cancer cells infected with 10 MOIs of Ad-3484-NC or Ad-3484-shDaxx or Ad-3484-pTP for each indicated time. The numbers indicate the relative band intensity of infected samples for each indicated time to control (0 h) after band intensities were measured with a densitometer. (G) Plaque-forming unit (PFU) titration assays of adenovirus in various cancer cells treated with autophagy inhibitor (3-MA 10 mM) or autophagy enhancer (rapamycin 50 nM) for 44 h after 4 h of infections with 10 MOIs of Ad-3484-NC, Ad-3484-shDaxx, or Ad-3484-pTP. PFU ratios mean that viral titer of 3-MA or rapamycin-treated cancer cells after infection NC, shDaxx or pTP virus divided by viral titer of untreated cancer cells after infection NC, shDaxx or pTP virus respectively. Error bars represent standard errors from three independent experiments. NC, Ad-3484-NC; shDaxx, Ad-3484-shDaxx; pTP, Ad-3484-pTP (H) Cell viability in various cancer cells treated with autophagy inhibitor (3-MA 10 mM) or autophagy enhancer (rapamycin 50 nM) for 44 h after 4 h of infections with 10 MOIs of Ad-3484-shDaxx. Cell viability was estimated by trypan blue exclusion. Error bars represent standard errors from three independent experiments. (I) Plaque-forming unit (PFU) titration assays of adenovirus in various cancer cells treated with pan caspase inhibitor (Z-VAD-FMK 10 μM) for 44 h after 4 h of infections with 10 MOIs of Ad-3484-shDaxx Error bars represent standard errors from three independent experiments. P values less than 0.05 were considered statistically significant (*P < 0.05). (J) Cell viability in various cancer cells treated with pan caspase inhibitor (Z-VAD-FMK 10 μM) for 44 h after 4 h of infections with 10 MOIs of Ad-3484-shDaxx. Cell viability was estimated by trypan blue exclusion. Error bars represent standard errors from three independent experiments. P values less than 0.05 were considered statistically significant (***P < 0.001). (K) Plaque-forming unit (PFU) titration assays of adenovirus in various cancer cells treated with histone acetyltransferase inhibitor (C646 25 μM) for 44 h after 4 h of infections with 10 MOIs of Ad-3484-shDaxx. Error bars represent standard errors from three independent experiments. P values less than 0.05 were considered statistically significant (*P < 0.05; **P < 0.01). (L) Cell viability in DU145, A549 and SK-Hep1 treated with histone acetyltransferase inhibitor (C646 25 μM) for 44 h after 4 h of infections with 10 MOIs of Ad-3484-shDaxx. Cell viability was estimated by trypan blue exclusion. Error bars represent standard errors from three independent experiments. P values less than 0.05 were considered statistically significant (***P < 0.001).
Figure 5
Figure 5
Tumor size measurements and immunohistochemical images of tumors. Hep3B cells (A) or A549 cells (B) in Matrigel were injected subcutaneously in the abdominal region of BALB/c athymic nude mice, and intratumoral injections of PBS, or of each virus indicated, were repeated every other day for a total of three injections. Tumor volume was measured and calculated on the indicated days using the following formula: Volume (mm3) = 0.52 × (Length) × (Width)2 (n = 5 per group) (upper). Error bars represent standard error from five mice in each experimental group. The asterisk indicates a significant difference between each comparative group (*P < 0.05; **P < 0.01). Tumor tissues after euthanasia from each group (n = 2 per group) for immunohistochemistry were harvested 7 days following virus infections. Adenovirus 5, pTP or Daxx primary antibodies were incubated overnight at 4 °C on tissue slides. Images were obtained by light microscopy (200×). (lower).
Figure 6
Figure 6
Schematic diagram of enhanced viral production and anti-tumoral effect by a combination of Daxx downregulation, and pTP upregulation, in E1B55K/19K deleted oncolytic adenovirus. pTP upregulation greatly increased viral production, while Daxx downregulation increased mainly infectivity, but not total virus particles. Additionally, Daxx downregulation induced stronger apoptotic cell death than pTP expression did in tumor cells with wild type p53, resulting in an enhanced anti-tumoral effect. This suggests that the combination of both Daxx downregulation and pTP upregulation in oncolytic adenovirus therapy could be an ideal cooperative pairing.

Similar articles

Cited by

References

    1. Lichty BD, Breitbach CJ, Stojdl DF, Bell JC. Going viral with cancer immunotherapy. Nat. Rev. Cancer. 2014;14:559–567. doi: 10.1038/nrc3770. - DOI - PubMed
    1. Russell SJ, Peng KW, Bell JC. Oncolytic virotherapy. Nat. Biotechnol. 2012;30:658–670. doi: 10.1038/nbt.2287. - DOI - PMC - PubMed
    1. Bischoff JR, et al. An adenovirus mutant that replicates selectively in p53-deficient human tumor cells. Science. 1996;274:373–376. doi: 10.1126/science.274.5286.373. - DOI - PubMed
    1. Cheng PH, Wechman SL, McMasters KM, Zhou HS. Oncolytic replication of E1b-deleted adenoviruses. Viruses. 2015;7:5767–5779. doi: 10.3390/v7112905. - DOI - PMC - PubMed
    1. Royds JA, et al. p53 promotes adenoviral replication and increases late viral gene expression. Oncogene. 2006;25:1509–1520. doi: 10.1038/sj.onc.1209185. - DOI - PubMed

Publication types

MeSH terms

LinkOut - more resources