. 2021 Jan 13;11(1):918.
doi: 10.1038/s41598-020-79741-w.

Measurement of muscle blood flow and O2 uptake via near-infrared spectroscopy using a novel occlusion protocol

Affiliations

Measurement of muscle blood flow and O2 uptake via near-infrared spectroscopy using a novel occlusion protocol

Joshua J Dennis et al. Sci Rep. .

Abstract

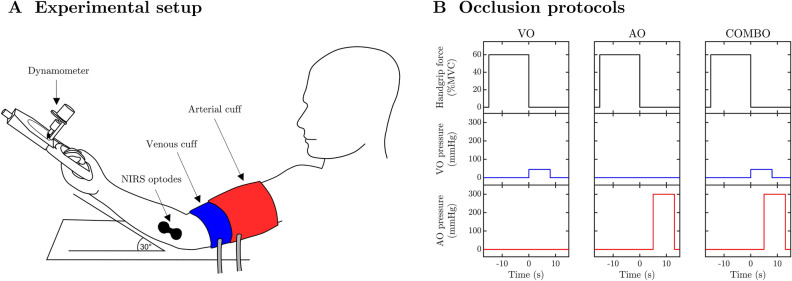
We describe here a novel protocol that sequentially combines venous followed by arterial occlusions to determine muscle blood flow and O2 uptake from a single measurement point using near-infrared spectroscopy (NIRS) during handgrip exercise. NIRS data were obtained from the flexor digitorum superficialis (FDS) muscle on the dominant arm of 15 young, healthy adults (3 women; 26 ± 7 years; 78.6 ± 9.1 kg). Participants completed a series of 15-s static handgrip contractions at 20, 40 and 60% of maximal voluntary contraction (MVC) immediately followed by either a: (i) venous occlusion (VO); (ii); arterial occlusion (AO); or venous then arterial occlusion (COMBO). Each condition was repeated 3 times for each exercise-intensity. The concordance correlation coefficient (CCC) and robust linear mixed effects modeling were used to determine measurement agreement between vascular occlusion conditions. FDS muscle blood flow ([Formula: see text]) and conductance ([Formula: see text]) demonstrated strong absolute agreement between VO and COMBO trials from rest up to 60%MVC, as evidenced by high values for CCC (> 0.82) and a linear relationship between conditions that closely approximated the line-of-identity (perfect agreement). Conversely, although FDS muscle O2 uptake ([Formula: see text]) displayed "substantial" to "near perfect" agreement between methods across exercise intensities (i.e., CCC > 0.80), there was a tendency for COMBO trials to underestimate [Formula: see text] by up to 7%. These findings indicate that the COMBO method provides valid estimates of [Formula: see text] and, to a slightly lesser extent, [Formula: see text] at rest and during static handgrip exercise up to 60%MVC. Practical implications and suggested improvements of the method are discussed.


Conflict of interest statement

The authors declare no competing interests.

Figures

Figure 1
Figure 1
Illustration of the experimental design (A) and the venous, arterial and combined occlusion protocols (B). NIRS: near-infrared spectroscopy; VO: venous occlusion; AO: arterial occlusion; COMBO: combined venous and arterial occlusion; MVC: maximal voluntary contraction. The illustration in Panel A was created using InkScape (v0.92, Inkscape Project, https://inkscape.org).
Figure 2
Figure 2
An example of the near-infrared waveform response to the combined venous and arterial occlusion following a 15-s isometric handgrip contraction. VO: venous occlusion; AO: arterial occlusion; MVC: maximal voluntary contraction; THb: total hemoglobin; cHbDiff: corrected hemoglobin difference; FDS: flexor digitorum superficialis; Q˙: muscle blood flow; V˙O2: muscle O2 uptake. The solid lines in (A) and (B) denote the relative timing of venous and arterial occlusions during the combined protocol (COMBO). The solid lines in (CE) represent the continuous waveform response to the COMBO occlusion protocol immediately following an isometric handgrip contraction at 40%MVC. The thickened red lines in (D) and (E) denote the periods of data used to compute Q˙ and V˙O2, respectively, of the FDS muscle. The solid dots in (F) and (H) represent the ensemble of [THb] and [cHbDiff] waveforms obtained during COMBO occlusions following 40%MVC handgrip exercise in this particular individual. The numerals I, II and III in (F) and (H) illustrate from which of the 3 repeated trials waveform data were obtained. The solid red lines in (F) and (H) depict the best-fit nonlinear spline after the processes of iterative reweighting was complete. Note that the iterative reweighting approach has deemphasized the observations belonging to the aberrant waveform in each dataset. The solid red lines in (G) and (I) are the first-order derivatives obtained from the best-fit splines in (F) and (H). The vertical solid lines in (FI) indicate the first 1-s of the COMBO occlusion over which the Q˙ and V˙O2 waveforms were averaged.
Figure 3
Figure 3
Average responses in hemodynamic and metabolic variables during incremental handgrip exercise. Bars represent means ± SEM. HR: heart rate; MAP: mean arterial pressure; FDS: flexor digitorum superficialis muscle; Q˙: muscle blood flow; C: vascular conductance; V˙O2: muscle O2 uptake; MVC: maximal voluntary contraction. VO: venous occlusion; AO: arterial occlusion; COMBO: combined venous and arterial occlusion; a.u.; arbitrary units.
Figure 4
Figure 4
Measurement agreement between venous and combined occlusion trials for muscle blood flow (A,C) and vascular conductance (B,D) of the flexor digitorum muscle (FDS) during isometric handgrip exercise. Solid points represent individual data points from all participants at rest, and immediately following isometric handgrip exercise at 20, 40 and 60% of maximal voluntary contraction. The dotted lines denote the line-of-identity (i.e., perfect agreement). The solid lines represent the predicted group-level response obtained via robust linear mixed effects modeling. The solid red lines represent simultaneous 95% confidence intervals of the predicted group-level response. VO: venous occlusion; COMBO: combined venous and arterial occlusion; ΔQ˙ and ΔC: differences in muscle blood flow and vascular conductance between VO and COMBO trials, respectively (i.e., COMBO–VO).
Figure 5
Figure 5
Measurement agreement between arterial and combined occlusion trials for muscle O2 uptake (A,B) of the flexor digitorum muscle (FDS) during isometric handgrip exercise. Solid points represent individual data points from all participants at rest, and immediately following isometric handgrip exercise at 20, 40 and 60% of maximal voluntary contraction. The dotted lines denote the line-of-identity (i.e., perfect agreement). The solid lines represent the predicted group-level response obtained via robust linear mixed effects modeling. The solid red lines represent simultaneous 95% confidence intervals of the predicted group-level response. AO: arterial occlusion; COMBO: combined venous and arterial occlusion; ΔV˙O2: differences in muscle O2 uptake AO and COMBO trials, respectively (i.e., COMBO–AO).

References

    1. van Beekvelt MC, Borghuis MS, van Engelen BG, Wevers RA, Colier WN. Adipose tissue thickness affects in vivo quantitative near-IR spectroscopy in human skeletal muscle. Clin. Sci. 2001;101:21–28. doi: 10.1042/cs1010021. - DOI - PubMed
    1. De Blasi RA, et al. Noninvasive measurement of forearm blood flow and oxygen consumption by near-infrared spectroscopy. J. Appl. Physiol. 1994;76:1388–1393. doi: 10.1152/jappl.1994.76.3.1388. - DOI - PubMed
    1. Van Beekvelt MCP, Colier WNJM, Wevers RA, Van Engelen BGM. Performance of near-infrared spectroscopy in measuring local O2 consumption and blood flow in skeletal muscle. J. Appl. Physiol. 2001;90:511–519. doi: 10.1152/jappl.2001.90.2.511. - DOI - PubMed
    1. De Blasi RA, Ferrari M, Almenrader N, Aurisicchio P. Comparison of two methods of measuring forearm oxygen consumption (VO2) by near infrared spectroscopy. BIOMEDO. 1997;2:171–175. doi: 10.1117/12.269893. - DOI - PubMed
    1. Homma S, Eda H, Ogasawara S, Kagaya A. Near-infrared estimation of O2 supply and consumption in forearm muscles working at varying intensity. J. Appl. Physiol. 1996;80:1279–1284. doi: 10.1152/jappl.1996.80.4.1279. - DOI - PubMed

Publication types

LinkOut - more resources