

Radiation-induced cell cycle perturbations: a computational tool validated with flow-cytometry data
- PMID: 33441727
- PMCID: PMC7806866
- DOI: 10.1038/s41598-020-79934-3
Radiation-induced cell cycle perturbations: a computational tool validated with flow-cytometry data
Abstract
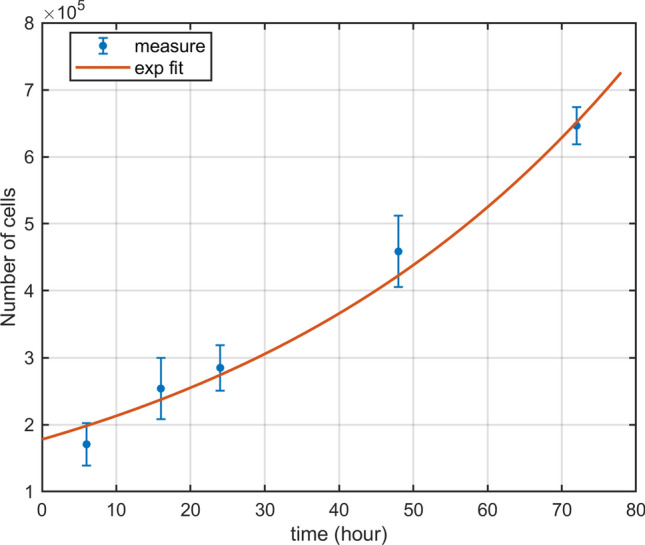
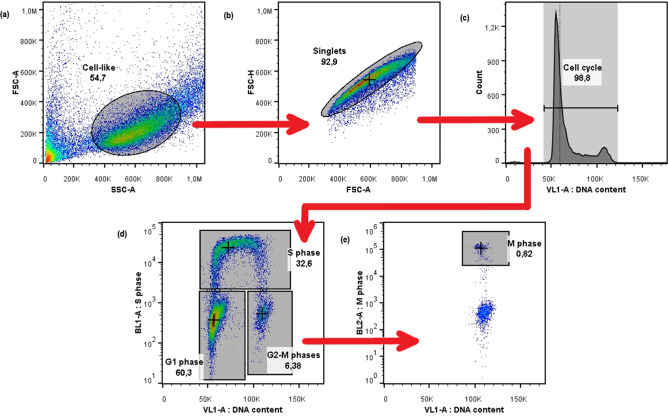
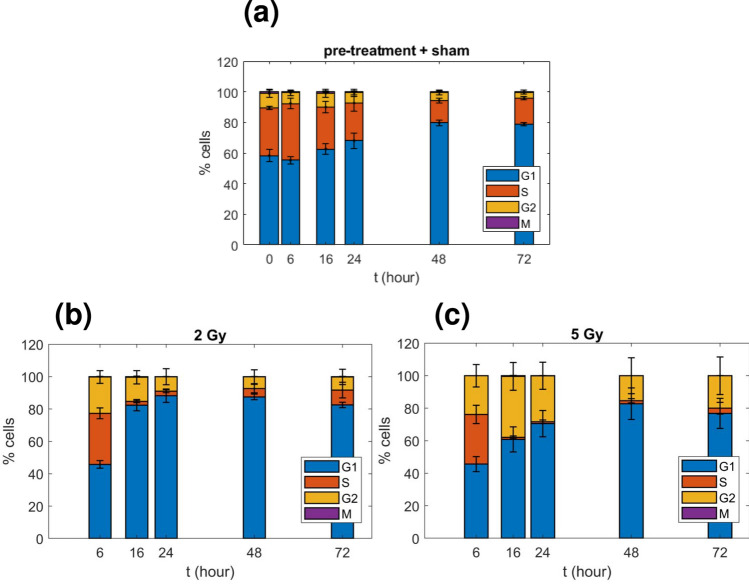
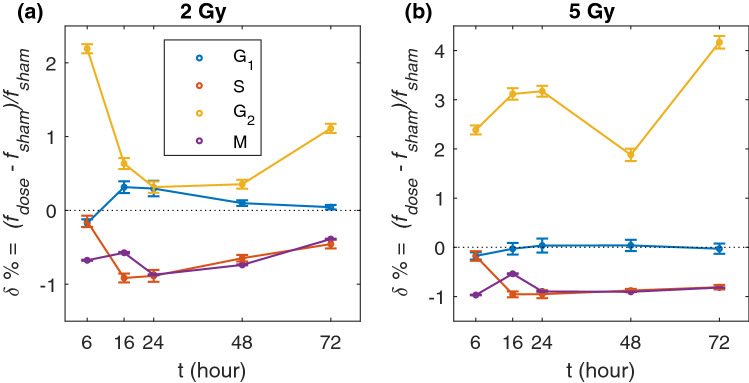
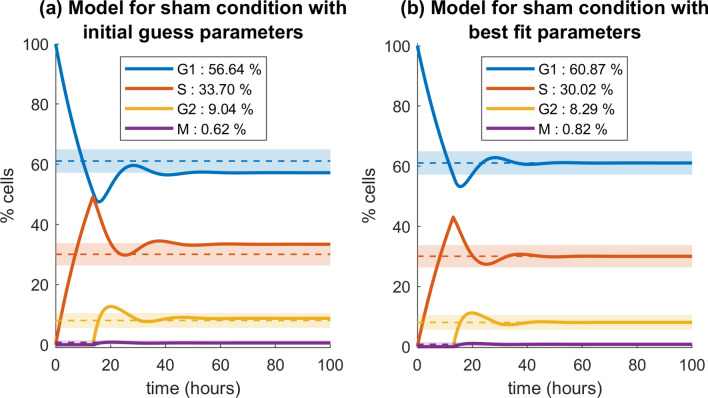
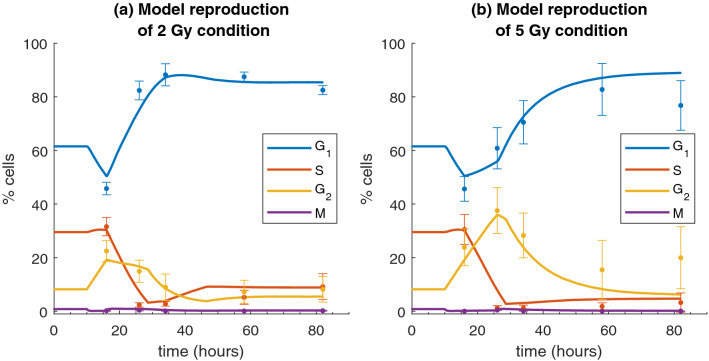
Cell cycle progression can be studied with computational models that allow to describe and predict its perturbation by agents as ionizing radiation or drugs. Such models can then be integrated in tools for pre-clinical/clinical use, e.g. to optimize kinetically-based administration protocols of radiation therapy and chemotherapy. We present a deterministic compartmental model, specifically reproducing how cells that survive radiation exposure are distributed in the cell cycle as a function of dose and time after exposure. Model compartments represent the four cell-cycle phases, as a function of DNA content and time. A system of differential equations, whose parameters represent transition rates, division rate and DNA synthesis rate, describes the temporal evolution. Initial model inputs are data from unexposed cells in exponential growth. Perturbation is implemented as an alteration of model parameters that allows to best reproduce cell-cycle profiles post-irradiation. The model is validated with dedicated in vitro measurements on human lung fibroblasts (IMR90). Cells were irradiated with 2 and 5 Gy with a Varian 6 MV Clinac at IRCCS Maugeri. Flow cytometry analysis was performed at the RadBioPhys Laboratory (University of Pavia), obtaining cell percentages in each of the four phases in all studied conditions up to 72 h post-irradiation. Cells show early [Formula: see text]-phase block (increasing in duration as dose increases) and later [Formula: see text]-phase accumulation. For each condition, we identified the best sets of model parameters that lead to a good agreement between model and experimental data, varying transition rates from [Formula: see text]- to S- and from [Formula: see text]- to M-phase. This work offers a proof-of-concept validation of the new computational tool, opening to its future development and, in perspective, to its integration in a wider framework for clinical use.
Conflict of interest statement
The authors declare no competing interests.
Figures
Similar articles
-
Validation of a virtual source model of medical linac for Monte Carlo dose calculation using multi-threaded Geant4.Phys Med Biol. 2018 Apr 13;63(8):085008. doi: 10.1088/1361-6560/aab7a1. Phys Med Biol. 2018. PMID: 29553478
-
Early changes in cell cycle kinetics after ionizing irradiation below 1 GY.Int J Radiat Biol. 1998 Feb;73(2):187-95. doi: 10.1080/095530098142572. Int J Radiat Biol. 1998. PMID: 9489566
-
Secondary radiation measurements for particle therapy applications: charged particles produced by 4He and 12C ion beams in a PMMA target at large angle.Phys Med Biol. 2018 Mar 7;63(5):055018. doi: 10.1088/1361-6560/aaa36a. Phys Med Biol. 2018. PMID: 29265011
-
Cytotoxicity and cell-cycle effects of paclitaxel when used as a single agent and in combination with ionizing radiation.Int J Radiat Oncol Biol Phys. 1997 Mar 1;37(4):885-95. doi: 10.1016/s0360-3016(96)00535-4. Int J Radiat Oncol Biol Phys. 1997. PMID: 9128966
-
A comprehensive review of computational cell cycle models in guiding cancer treatment strategies.NPJ Syst Biol Appl. 2024 Jul 5;10(1):71. doi: 10.1038/s41540-024-00397-7. NPJ Syst Biol Appl. 2024. PMID: 38969664 Free PMC article. Review.
Cited by
-
Proteomic Analysis of the Inflorescence Stem Mechanical Strength Difference in Herbaceous Peonies (Paeonia lactiflora Pall.).ACS Omega. 2022 Sep 26;7(39):34801-34809. doi: 10.1021/acsomega.2c02749. eCollection 2022 Oct 4. ACS Omega. 2022. PMID: 36211058 Free PMC article.
-
Analysis of nuclear maturation, DNA damage and repair gene expression of bovine oocyte and cumulus cells submitted to ionizing radiation.Anim Reprod. 2023 May 29;20(2):e20230021. doi: 10.1590/1984-3143-AR2023-0021. eCollection 2023. Anim Reprod. 2023. PMID: 37293252 Free PMC article.
-
The Metabolic Footprint of Systemic Effects in the Blood Caused by Radiotherapy and Inflammatory Conditions: A Systematic Review.Metabolites. 2023 Sep 9;13(9):1000. doi: 10.3390/metabo13091000. Metabolites. 2023. PMID: 37755280 Free PMC article. Review.
-
Characterising the Behaviour of a Structured PDE Model of the Cell Cycle in Contrast to a Corresponding ODE System.Bull Math Biol. 2025 Jun 8;87(7):93. doi: 10.1007/s11538-025-01472-8. Bull Math Biol. 2025. PMID: 40484899 Free PMC article.
-
Long-term, non-invasive FTIR detection of low-dose ionizing radiation exposure.Sci Rep. 2024 Mar 13;14(1):6119. doi: 10.1038/s41598-024-56491-7. Sci Rep. 2024. PMID: 38480827 Free PMC article.
References
-
- Hall EJ, Giaccia AJ. Radiobiology for the Radiologist. 7. Philadelphia: Wolters Kluwer Health/Lippincott Williams & Wilkins; 2012.
-
- Sherr CJ, Bartek J. Cell cycle-targeted cancer therapies. Annu. Rev. Cancer Biol. 2017;1:41–57. doi: 10.1146/annurev-cancerbio-040716-075628. - DOI
-
- Dawson A, Hillen T. Derivation of the tumour control probability (TCP) from a cell cycle model. Comput. Math. Methods Med. 2006;7:121–141. doi: 10.1080/10273660600968937. - DOI
MeSH terms
LinkOut - more resources
Full Text Sources
Other Literature Sources
