. 2021 Jan 13;11(1):1099.
doi: 10.1038/s41598-020-79763-4.

Enhanced hippocampal type II theta activity AND altered theta architecture in mice lacking the Cav3.2 T-type voltage-gated calcium channel

Affiliations

Enhanced hippocampal type II theta activity AND altered theta architecture in mice lacking the Cav3.2 T-type voltage-gated calcium channel

Muhammad Imran Arshaad et al. Sci Rep. .

Abstract

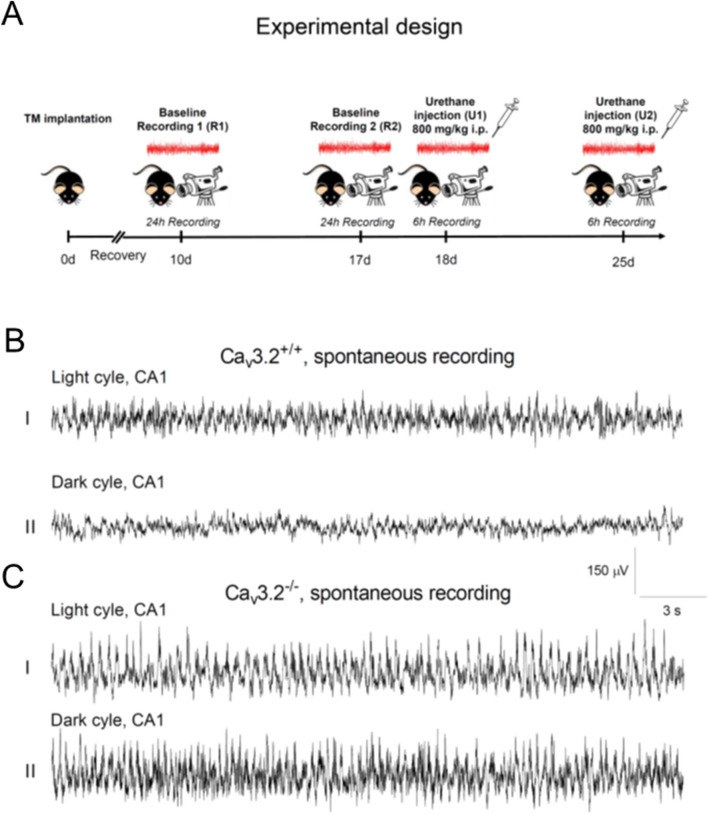
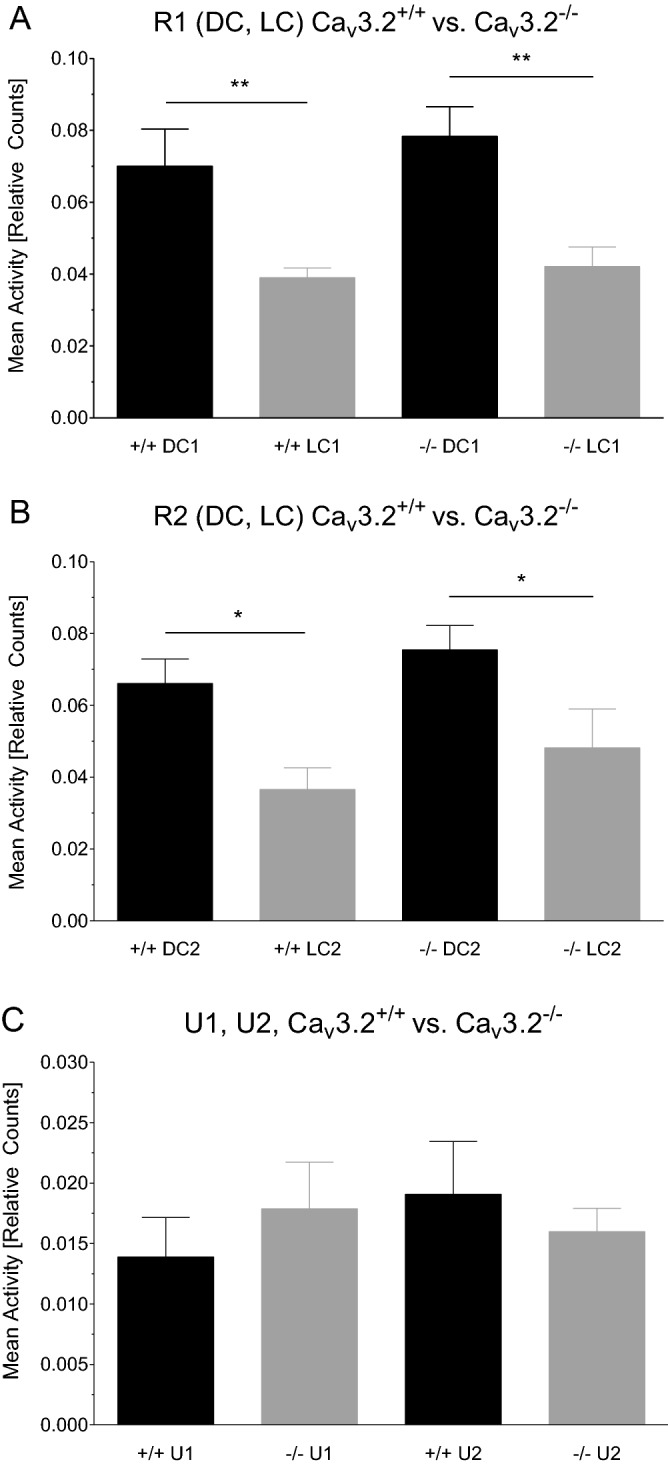
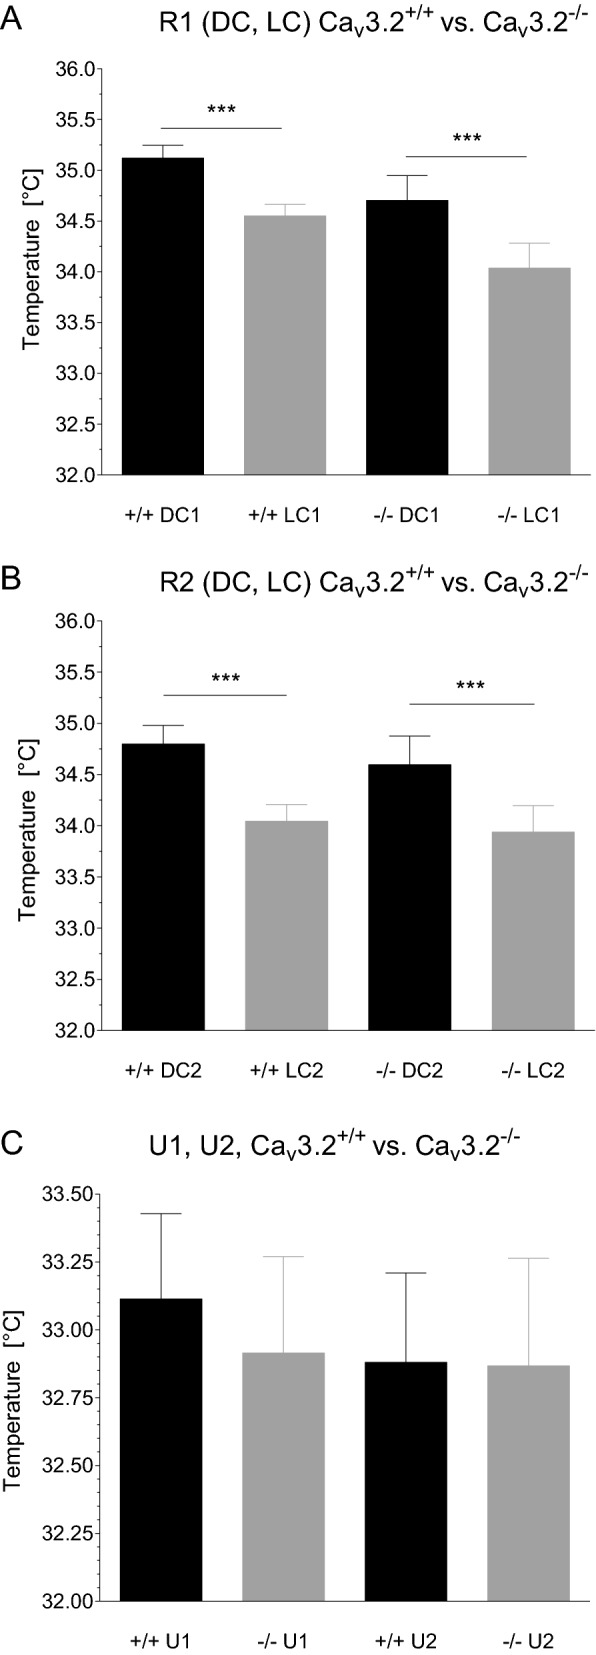
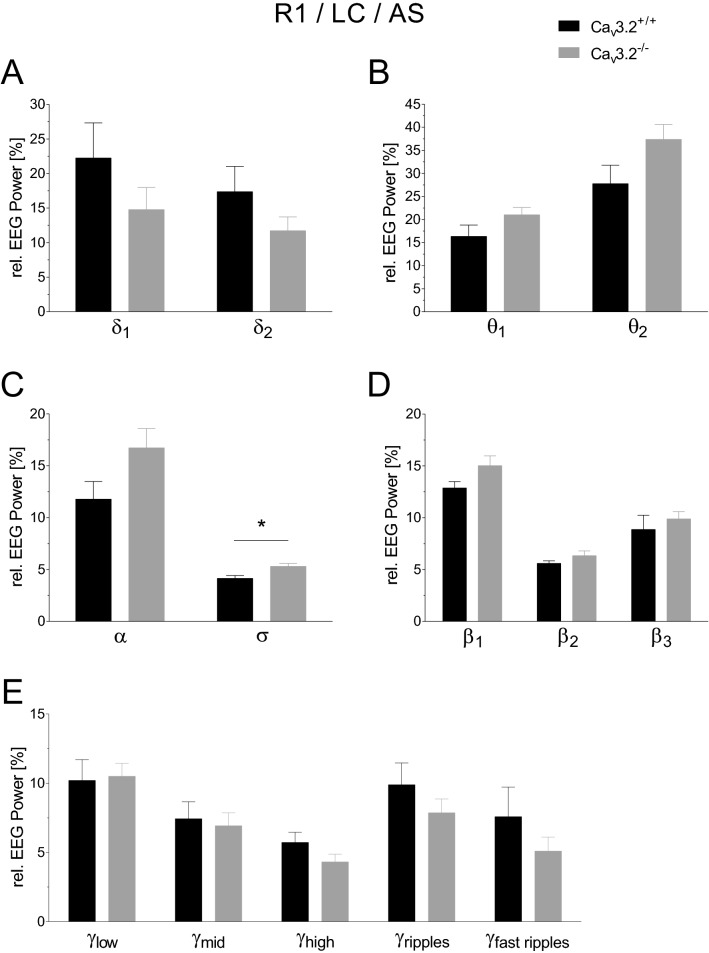
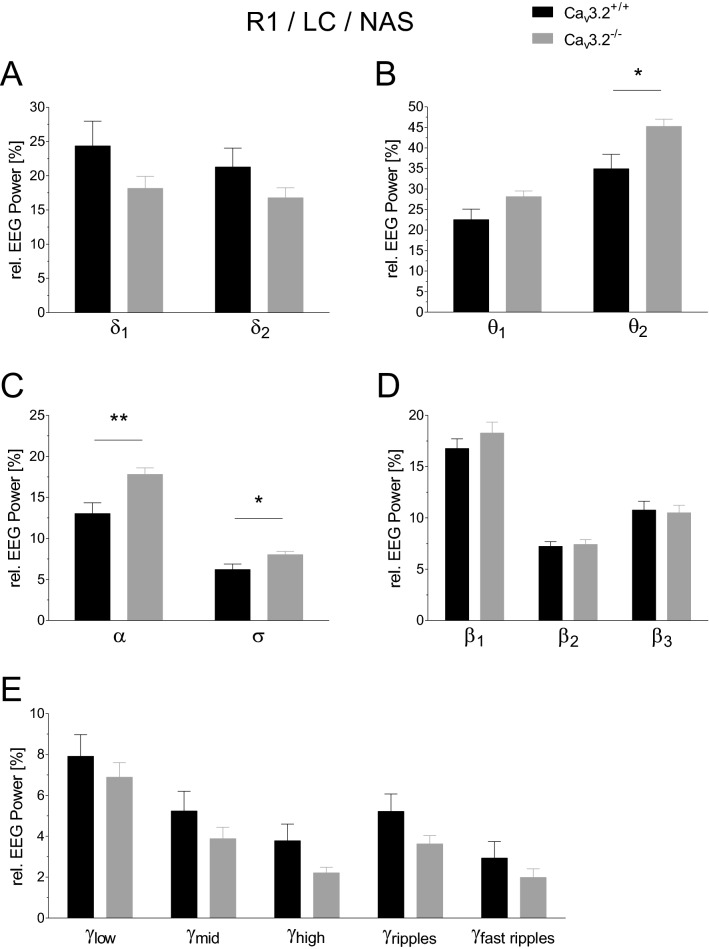
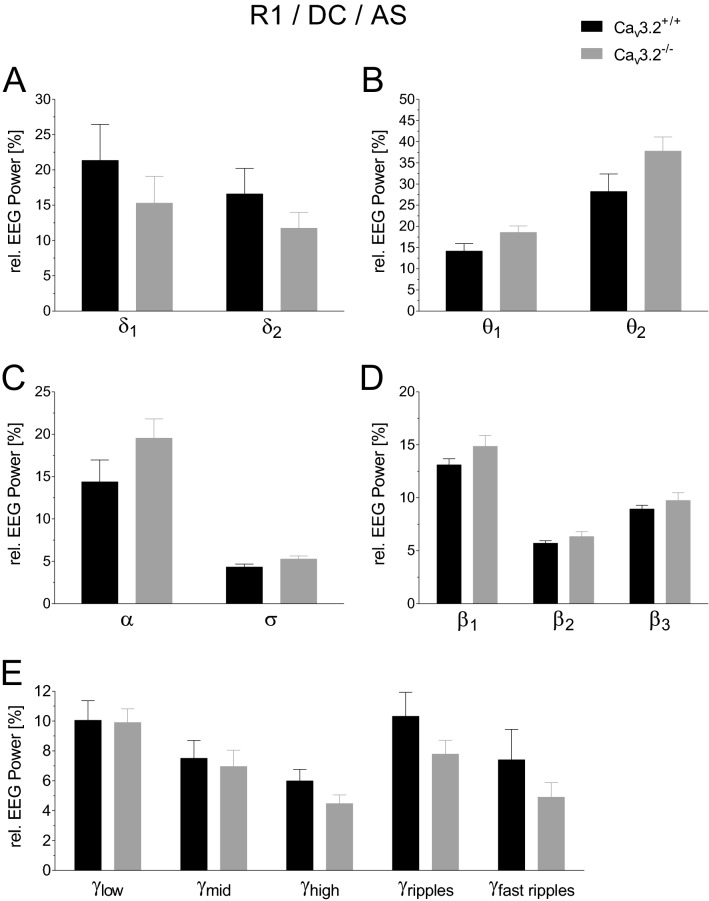
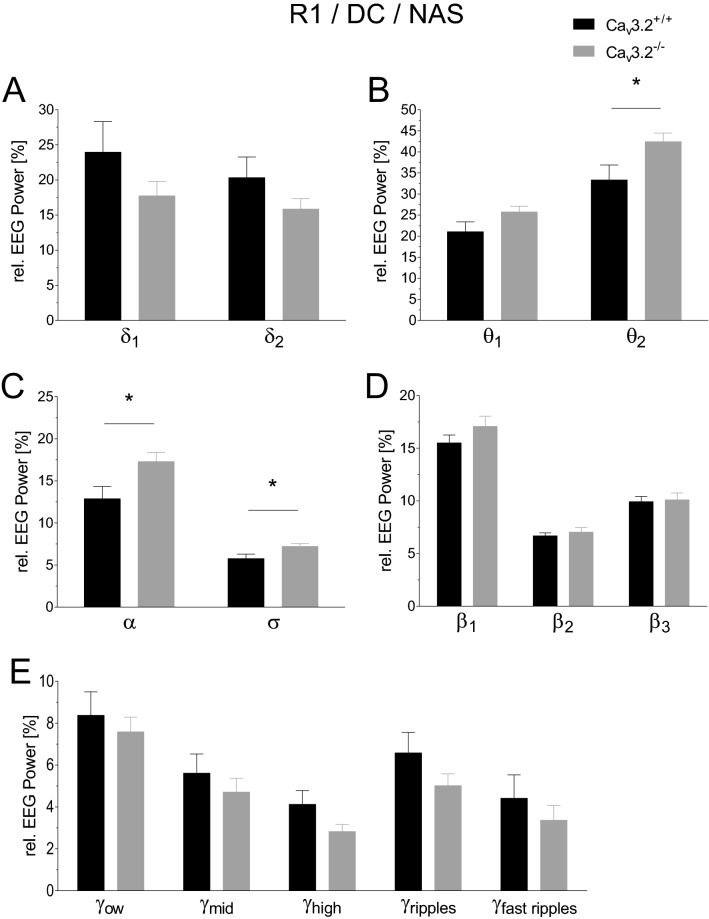
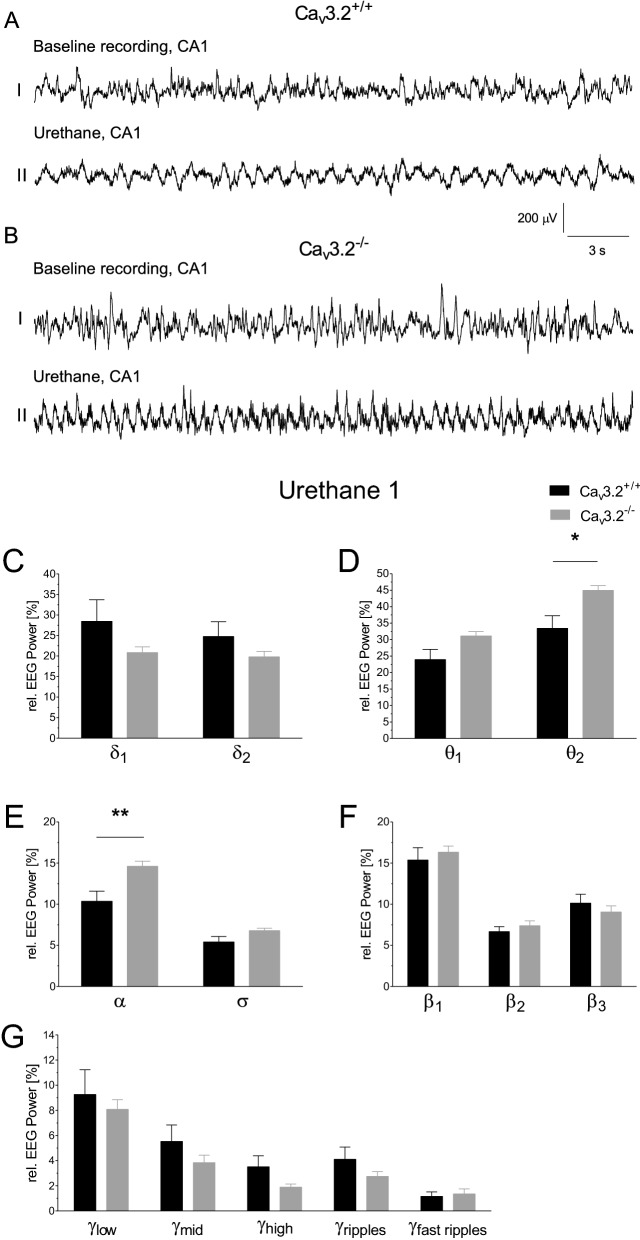
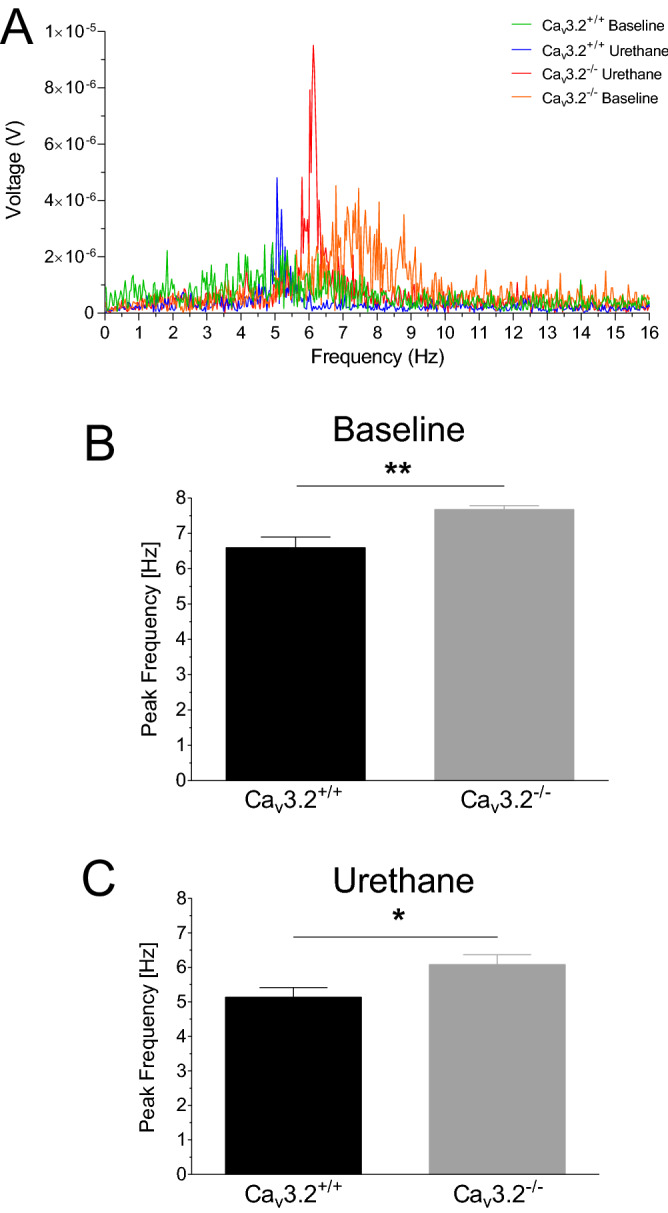
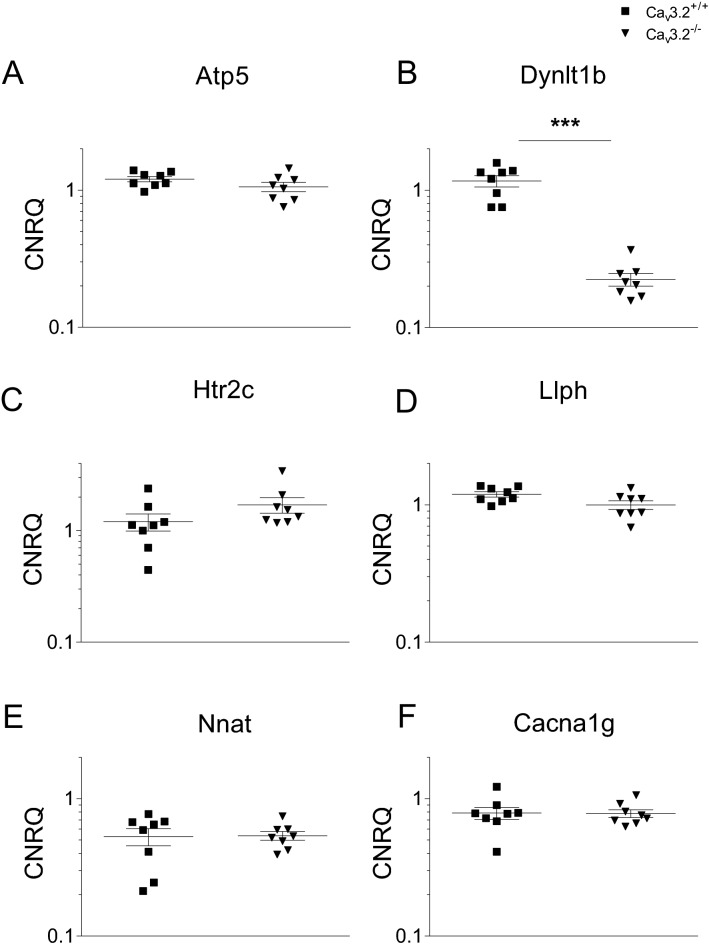
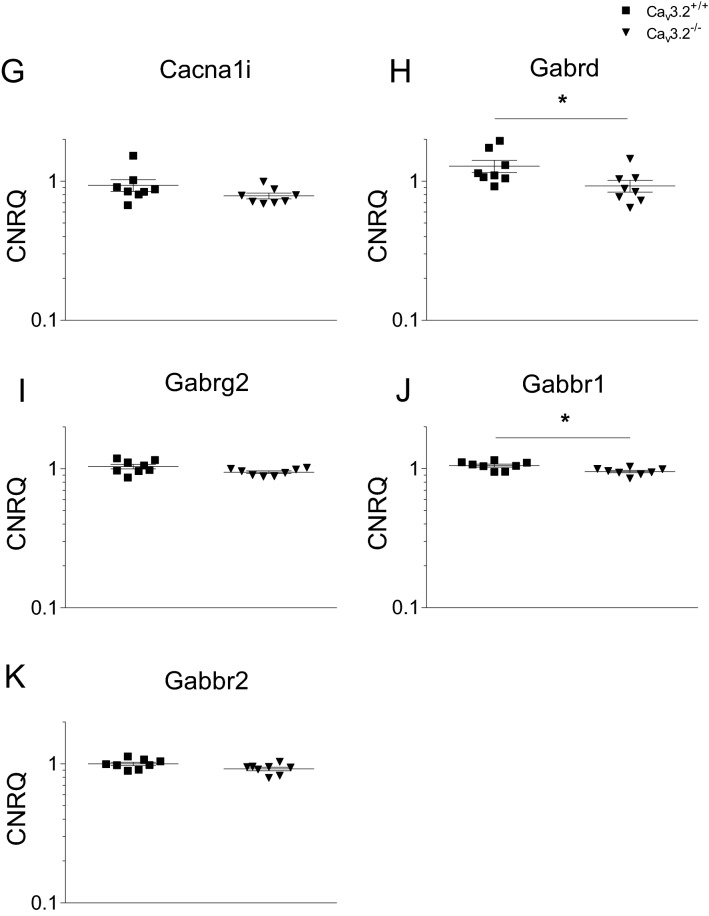
T-type Ca2+ channels are assumed to contribute to hippocampal theta oscillations. We used implantable video-EEG radiotelemetry and qPCR to unravel the role of Cav3.2 Ca2+ channels in hippocampal theta genesis. Frequency analysis of spontaneous long-term recordings in controls and Cav3.2-/- mice revealed robust increase in relative power in the theta (4-8 Hz) and theta-alpha (4-12 Hz) ranges, which was most prominent during the inactive stages of the dark cycles. Urethane injection experiments also showed enhanced type II theta activity and altered theta architecture following Cav3.2 ablation. Next, gene candidates from hippocampal transcriptome analysis of control and Cav3.2-/- mice were evaluated using qPCR. Dynein light chain Tctex-Type 1 (Dynlt1b) was significantly reduced in Cav3.2-/- mice. Furthermore, a significant reduction of GABA A receptor δ subunits and GABA B1 receptor subunits was observed in the septohippocampal GABAergic system. Our results demonstrate that ablation of Cav3.2 significantly alters type II theta activity and theta architecture. Transcriptional changes in synaptic transporter proteins and GABA receptors might be functionally linked to the electrophysiological phenotype.


Conflict of interest statement

The authors declare no competing interests.

Figures

Figure 1
Figure 1
Experimental design and hippocampal EEG recordings from Cav3.2+/+ and Cav3.2−/− mice. (A) Experimental design including EEG radiofrequency transmitter (TM) implantation (day 0), a 10 days recovery period, two 24 h EEG long-term recordings (R1 at day 10, R2 at day 17) and two 6 h EEG recordings following urethane injection (800 mg/kg i.p., U1 at day 18, U2 at day 25). (B,C) Representative 30 s EEG traces from the CA1 region for the light (BI,CI) and dark cycle (BII,CII) R1 long-term recording from Cav3.2+/+ (B) and Cav3.2 deficient mice (C). Note that Cav3.2−/− mice display prominent theta/alpha activity compared to Cav3.2+/+ animals, particularly during the inactive state (see “Results” section). Scale: y-axis, 150 μV; x-axis, 3 s.
Figure 2
Figure 2
Activity profile in Cav3.2+/+ and Cav3.2−/− mice. Activity profile of Cav3.2+/+ and Cav3.2−/− mice during the light cycle (LC1) and dark cycle (DC1) for the first (R1, A) and second (LC2, DC2, R2, B) 24 h long-term recording. Both genotypes exhibit significantly increased motor activity during the DC compared to the LC in both long-term recordings (R1, R2) resembling the nocturnal behavioral characteristics of mice. No differences were observed between both genotypes, neither in R1 nor in R2. (C) Activity values following both urethane injections (U1, U2, 800 mg/kg i.p. each) exhibiting no significant differences within and between the genotypes. Compared to (A) and (B), mean activity values are reduced as the multi-target drug urethane does not only induce hippocampal type II theta activity but also acts as a sedative due to its antagonistic effects at glutamate receptors. Note that mean activity data represent averaged relative counts from 2 s epochs.
Figure 3
Figure 3
Temperature profile of Cav3.2+/+ and Cav3.2−/− mice during the light cycle (LC) and dark cycle (DC) for the first (R1, A) and second (R2, B) 24 h long-term recording. Significantly increased motor activity during the DC (Fig. 2A,B) correlates with the circadian pattern of temperature profile in both genotypes during R1 and R2 recordings exhibiting significant differences as well. Note that the TA10ETA-F20 radiofrequency transmitters are placed subcutaneously and that averaged subcutaneous temperature values do not reflect body core temperature. However, under controlled environmental conditions, subcutaneous temperature profiles reliably parallel body core values. (C) Temperature values following both urethane injections (U1, U2, 800 mg/kg i.p. each) exhibited no significant differences within and between both genotypes. Compared to (A) and (B), mean temperature values are reduced due to hypolocomotion following urethane injection.
Figure 4
Figure 4
EEG power analysis during the active light cycle state (24 h long-term recording R1) in Cav3.2+/+ and Cav3.2−/− mice. Relative EEG power (%) for both genotypes is displayed for the individual frequency ranges (A–E). A significant change was observed for σ.
Figure 5
Figure 5
EEG power analysis during the non-active light cycle state (24 h long-term recording R1) in Cav3.2+/+ and Cav3.2−/− mice. Relative EEG power (%) for both genotypes is displayed for the individual frequency ranges (A–E). Significant alterations were observed for the θ2, α and σ frequency ranges (B,C). Changes in relative theta/theta-alpha power in Cav3.2−/− mice during the NAS point to functional alterations in type II theta activity.
Figure 6
Figure 6
EEG power analysis during the active dark cycle state (24 h long-term recording R1) in Cav3.2+/+ and Cav3.2−/− mice. Relative EEG power (%) for the Cav3.2+/+ and Cav3.2−/− is displayed for the individual frequency ranges (AE). No significant alterations were detected.
Figure 7
Figure 7
EEG power analysis during the non-active dark cycle state (24 h long-term recording R1) in Cav3.2+/+ and Cav3.2−/− mice. Relative EEG power (%) for Cav3.2+/+ and Cav3.2−/− animals is displayed for the individual frequency ranges (AE). In Cav3.2−/− mice, significant increases were observed in θ2, α and σ relative power (B,C). These alterations point to a functional involvement of Cav3.2 in type II theta activity.
Figure 8
Figure 8
Frequency analysis in Cav3.2+/+ and Cav3.2−/− mice following urethane (800 mg/kg i.p.) injection (U1). (A) CA1 EEG traces (30 s) from Cav3.2+/+ and Cav3.2−/− mice. Prior to urethane injection, baseline recordings (AI,BI) display characteristic large irregular activity (LIA). Following urethane administration (AII,BII), the EEG exhibits prominent theta oscillations in Cav3.2−/− mice (BII). Scale: y-axis, 200 μV; x-axis, 3 s. (C–G) Relative EEG power (%) for Cav3.2+/+ and Cav3.2−/− mice is displayed for the individual frequency ranges (A–E). Urethane which is used to induce atropine sensitive type II theta oscillations, caused a significant increase in θ2 and α relative EEG power (D,E).
Figure 9
Figure 9
Altered theta architecture in Cav3.2−/− mice. (A) Power spectrum density (PSD) plots obtained from representative 30 s EEG traces from baseline and post urethane states from both genotypes. (B,C) PSD plots from the baseline (B) and post urethane state (C) were analyzed for peak frequencies in the range of 0–16 Hz. Under both baseline and post urethane conditions, Cav3.2−/− mice exhibited a significant increase in theta peak frequencies.
Figure 10
Figure 10
qPCR analysis of candidate genes obtained from hippocampal transcriptome data in Cav3.2+/+ and Cav3.2−/− mice. Hippocampal transcriptome experiments were carried out previously. The following gene candidates potentially relevant for hippocampal theta oscillations were analyzed using qPCR: (A) ATP synthase, H+ transporting, mitochondrial F0 complex, subunit G (Atp5), (B) dynein light chain Tctex-Type 1 (Dynlt1b), (C) 5-hydroxytryptamine receptor 2C (Htr2c), (D) LLP homolog, long-term synaptic facilitation (Aplysia) (Llph), (E) Neuronatin (Nnat), (F) Cav3.1 (Cacna1g), (G) Cav3.3 (Cacna1i), (H) GABA A receptor delta subunit (Gabrd), (I) GABA A receptor gamma subunit (Gabrg2), (J) GABA B1 receptor subunit (Gabbr1), (K) GABA B2 receptor subunit (Gabbr2). A significant decrease in transcript levels was observed for Dynlt1b, Gabrd and Gabbr1 in Cav3.2−/− mice (B,H,J).
Figure 10
Figure 10
qPCR analysis of candidate genes obtained from hippocampal transcriptome data in Cav3.2+/+ and Cav3.2−/− mice. Hippocampal transcriptome experiments were carried out previously. The following gene candidates potentially relevant for hippocampal theta oscillations were analyzed using qPCR: (A) ATP synthase, H+ transporting, mitochondrial F0 complex, subunit G (Atp5), (B) dynein light chain Tctex-Type 1 (Dynlt1b), (C) 5-hydroxytryptamine receptor 2C (Htr2c), (D) LLP homolog, long-term synaptic facilitation (Aplysia) (Llph), (E) Neuronatin (Nnat), (F) Cav3.1 (Cacna1g), (G) Cav3.3 (Cacna1i), (H) GABA A receptor delta subunit (Gabrd), (I) GABA A receptor gamma subunit (Gabrg2), (J) GABA B1 receptor subunit (Gabbr1), (K) GABA B2 receptor subunit (Gabbr2). A significant decrease in transcript levels was observed for Dynlt1b, Gabrd and Gabbr1 in Cav3.2−/− mice (B,H,J).

Similar articles

Cited by

References

    1. Kraus BJ, et al. During running in place, grid cells integrate elapsed time and distance run. Neuron. 2015;88:578–589. doi: 10.1016/j.neuron.2015.09.031. - DOI - PMC - PubMed
    1. Jacobs J, et al. Direct electrical stimulation of the human entorhinal region and hippocampus impairs memory. Neuron. 2016;92:983–990. doi: 10.1016/j.neuron.2016.10.062. - DOI - PubMed
    1. MacDonald CJ, Carrow S, Place R, Eichenbaum H. Distinct hippocampal time cell sequences represent odor memories in immobilized rats. J. Neurosci. 2013;33:14607–14616. doi: 10.1523/JNEUROSCI.1537-13.2013. - DOI - PMC - PubMed
    1. Kahana MJ, Seelig D, Madsen JR. Theta returns. Curr. Opin. Neurobiol. 2001;11:739–744. doi: 10.1016/s0959-4388(01)00278-1. - DOI - PubMed
    1. Vertes RP. Hippocampal theta rhythm: A tag for short-term memory. Hippocampus. 2005;15:923–935. doi: 10.1002/hipo.20118. - DOI - PubMed

Publication types

Substances

LinkOut - more resources