

HSP60 knockdown exerts differential response in endothelial cells and monocyte derived macrophages during atherogenic transformation
- PMID: 33441791
- PMCID: PMC7807046
- DOI: 10.1038/s41598-020-79927-2
HSP60 knockdown exerts differential response in endothelial cells and monocyte derived macrophages during atherogenic transformation
Abstract
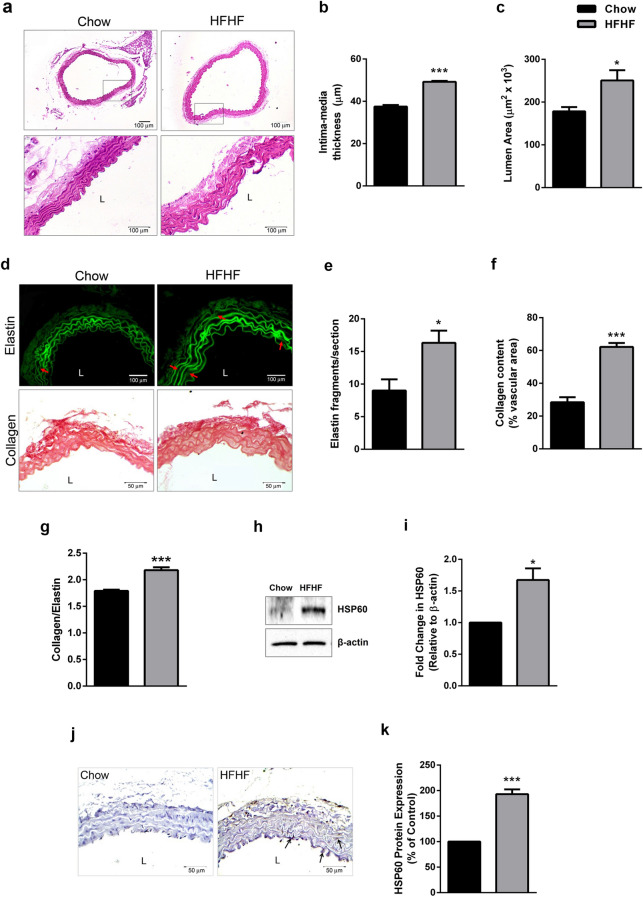
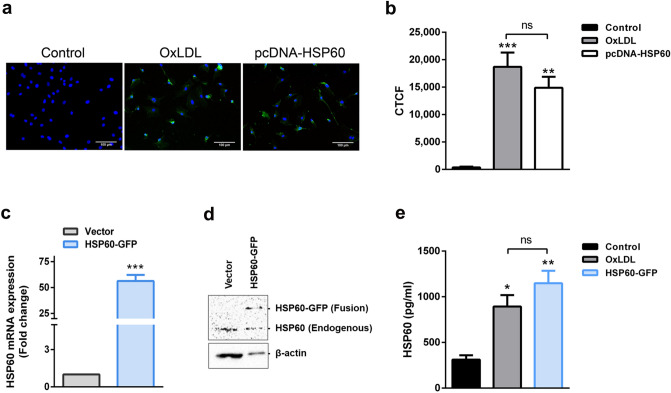
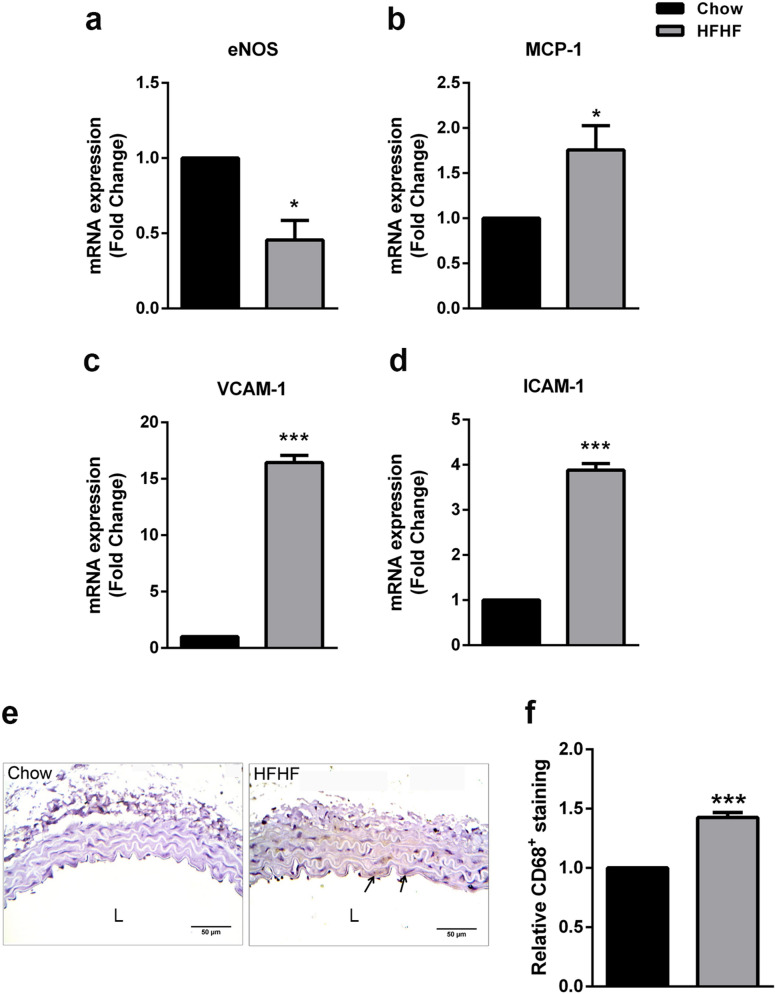
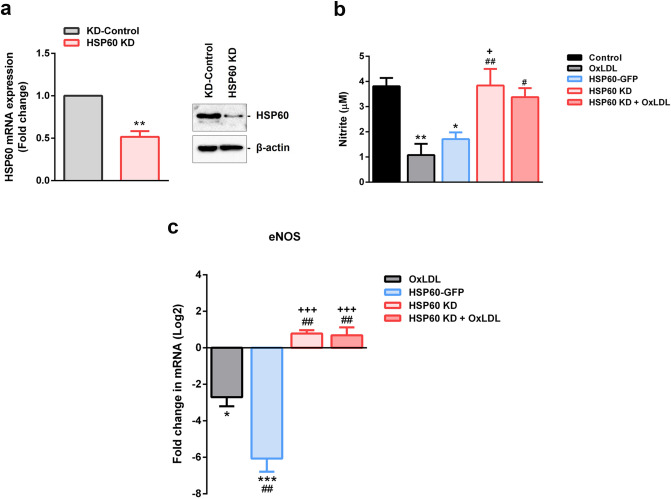
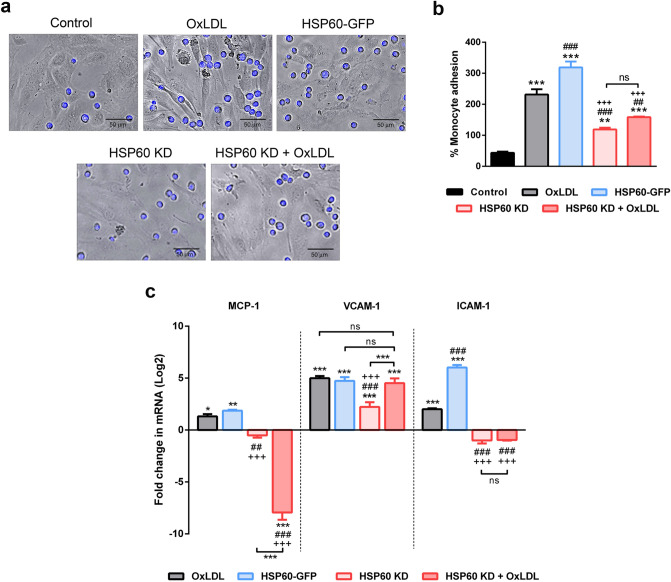
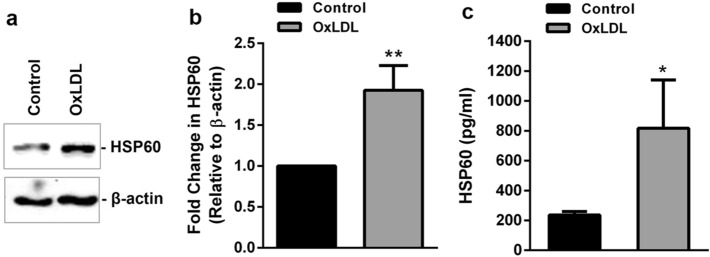
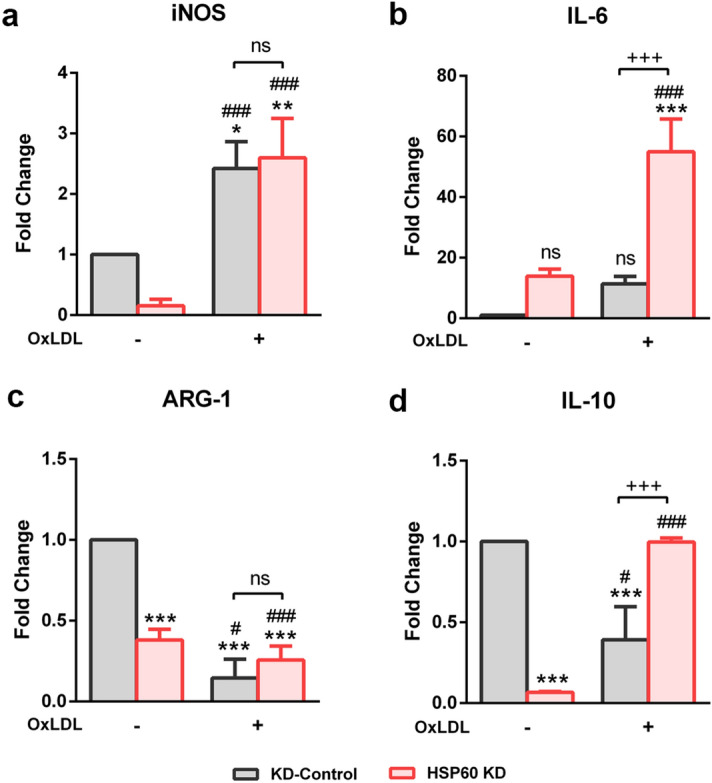
Ectopic expression of HSP60 in vascular cells is known to activate auto-immune response that is critical to atherogenic initiation. However, the pathogenic relevance of the aberrant HSP60 upregulation in intracellular signaling pathways associated with atherogenic consequences in vascular cells remains unclear. The aim of the present study was to determine the role of endogenous HSP60 in atherogenic transformation of endothelial cells and macrophages. After generating primary evidence of oxidized low density lipoprotein (OxLDL) induced HSP60 upregulation in human umbilical vein endothelial cells (HUVEC), its physiological relevance in high fat high fructose (HFHF) induced early atherogenic remodelling was investigated in C57BL/6J mice. Prominent HSP60 expression was recorded in tunica intima and media of thoracic aorta that showed hypertrophy, lumen dilation, elastin fragmentation and collagen deposition. Further, HSP60 overexpression was found to be prerequisite for its surface localization and secretion in HUVEC. eNOS downregulation and MCP-1, VCAM-1 and ICAM-1 upregulation with subsequent macrophage accumulation provided compelling evidences on HFHF induced endothelial dysfunction and activation that were also observed in OxLDL treated- and HSP60 overexpressing-HUVEC. OxLDL induced concomitant reduction in NO production and monocyte adhesion were prevented by HSP60 knockdown, implying towards HSP60 mediated possible regulation of the said genes. OxLDL induced HSP60 upregulation and secretion was also recorded in THP-1 derived macrophages (TDMs). HSP60 knockdown in TDMs accounted for higher OxLDL accumulation that correlated with altered scavenger receptors (SR-A1, CD36 and SR-B1) expression further culminating in M1 polarization. Collectively, the results highlight HSP60 upregulation as a critical vascular alteration that exerts differential regulatory role in atherogenic transformation of endothelial cells and macrophages.
Conflict of interest statement
The authors declare no competing interests.
Figures


Similar articles
-
Co-expression of ICAM-1, VCAM-1, ELAM-1 and Hsp60 in human arterial and venous endothelial cells in response to cytokines and oxidized low-density lipoproteins.Cell Stress Chaperones. 1997 Jun;2(2):94-103. doi: 10.1379/1466-1268(1997)002<0094:ceoive>2.3.co;2. Cell Stress Chaperones. 1997. PMID: 9250400 Free PMC article.
-
Pathogenic Autoimmunity in Atherosclerosis Evolves from HSP60-Reactive CD4 + T Cells.J Cardiovasc Transl Res. 2024 Oct;17(5):1172-1180. doi: 10.1007/s12265-024-10516-8. Epub 2024 May 20. J Cardiovasc Transl Res. 2024. PMID: 38767798
-
Postprandial lipoproteins and the molecular regulation of vascular homeostasis.Prog Lipid Res. 2013 Oct;52(4):446-64. doi: 10.1016/j.plipres.2013.06.001. Epub 2013 Jun 15. Prog Lipid Res. 2013. PMID: 23774609 Review.
-
Ablation of Galectin-12 Inhibits Atherosclerosis through Enhancement of M2 Macrophage Polarization.Int J Mol Sci. 2020 Jul 31;21(15):5511. doi: 10.3390/ijms21155511. Int J Mol Sci. 2020. PMID: 32752134 Free PMC article.
-
LOX-1, OxLDL, and atherosclerosis.Mediators Inflamm. 2013;2013:152786. doi: 10.1155/2013/152786. Epub 2013 Jul 10. Mediators Inflamm. 2013. PMID: 23935243 Free PMC article. Review.
Cited by
-
The Role of Alarmins in the Pathogenesis of Atherosclerosis and Myocardial Infarction.Curr Issues Mol Biol. 2024 Aug 17;46(8):8995-9015. doi: 10.3390/cimb46080532. Curr Issues Mol Biol. 2024. PMID: 39194749 Free PMC article. Review.
-
The role and mechanism of tetramethylpyrazine for atherosclerosis in animal models: A systematic review and meta-analysis.PLoS One. 2022 May 2;17(5):e0267968. doi: 10.1371/journal.pone.0267968. eCollection 2022. PLoS One. 2022. PMID: 35500001 Free PMC article.
-
Anti-Inflammatory Activity of CIGB-258 against Acute Toxicity of Carboxymethyllysine in Paralyzed Zebrafish via Enhancement of High-Density Lipoproteins Stability and Functionality.Int J Mol Sci. 2022 Sep 4;23(17):10130. doi: 10.3390/ijms231710130. Int J Mol Sci. 2022. PMID: 36077532 Free PMC article.
-
Extracellular vesicles in atherosclerosis cardiovascular disease: emerging roles and mechanisms.Front Cardiovasc Med. 2025 Jun 24;12:1611557. doi: 10.3389/fcvm.2025.1611557. eCollection 2025. Front Cardiovasc Med. 2025. PMID: 40630905 Free PMC article. Review.
-
Systemic deficiency of vitronectin is associated with aortic inflammation and plaque progression in ApoE-Knockout mice.FASEB Bioadv. 2021 Nov 19;4(2):121-137. doi: 10.1096/fba.2021-00108. eCollection 2022 Feb. FASEB Bioadv. 2021. PMID: 35141476 Free PMC article.
References
Publication types
MeSH terms
Substances
LinkOut - more resources
Full Text Sources
Other Literature Sources
Medical
Research Materials
Miscellaneous
