. 2021 Jan 13;11(1):1115.
doi: 10.1038/s41598-020-80739-7.

Silicon alleviates salinity stress in licorice (Glycyrrhiza uralensis) by regulating carbon and nitrogen metabolism

Affiliations

Silicon alleviates salinity stress in licorice (Glycyrrhiza uralensis) by regulating carbon and nitrogen metabolism

Jiajia Cui et al. Sci Rep. .

Abstract

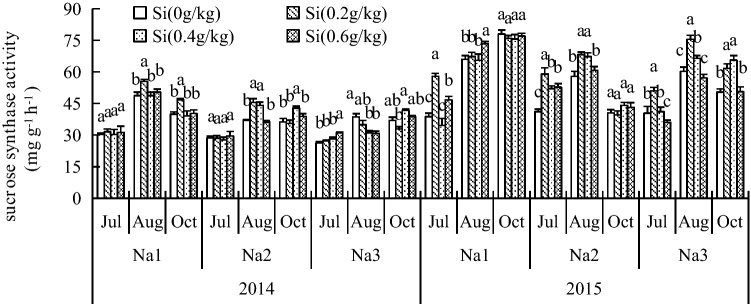
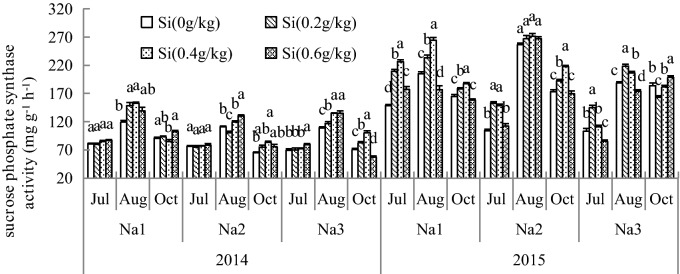
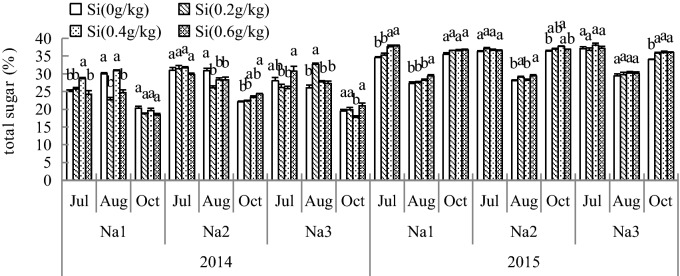
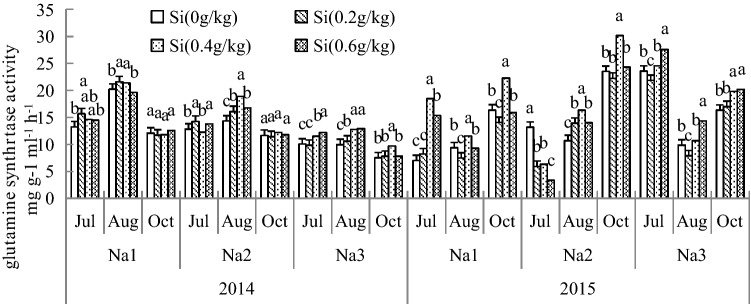
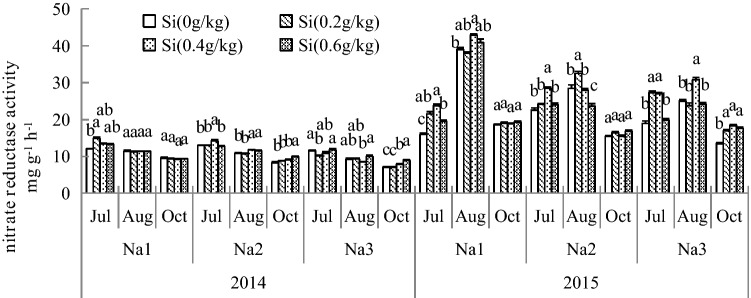
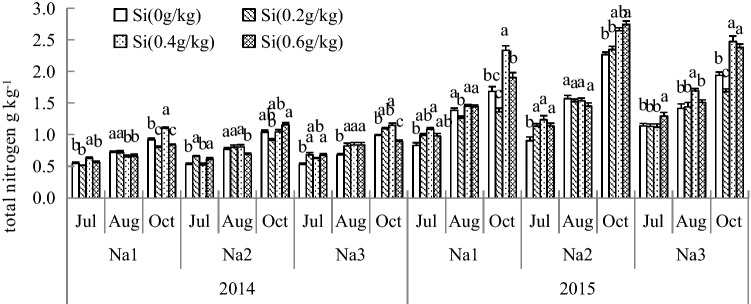
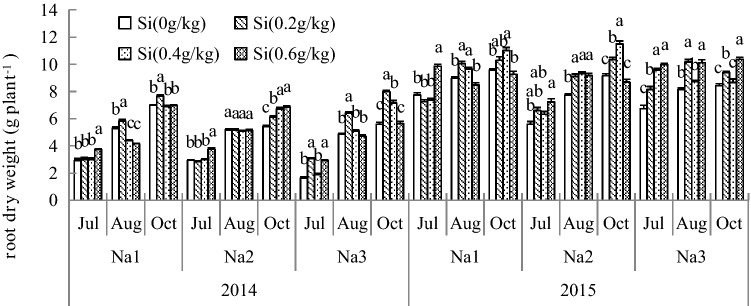
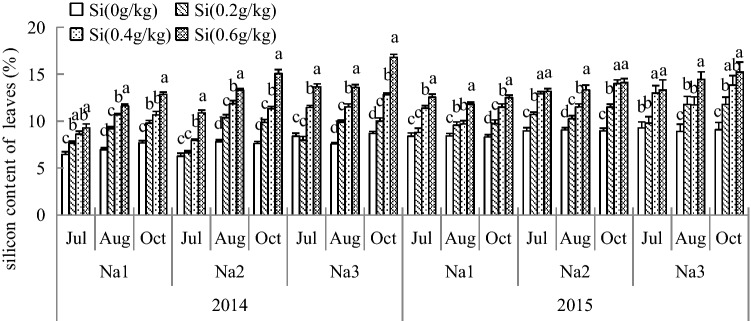
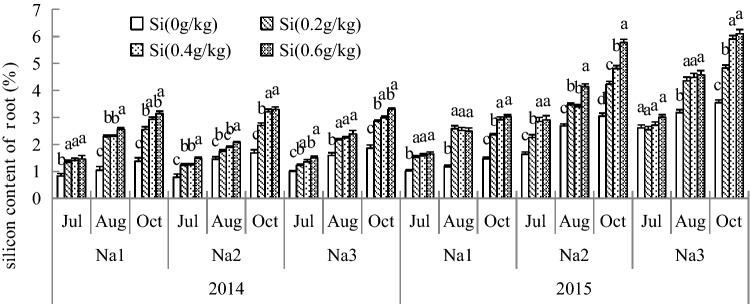
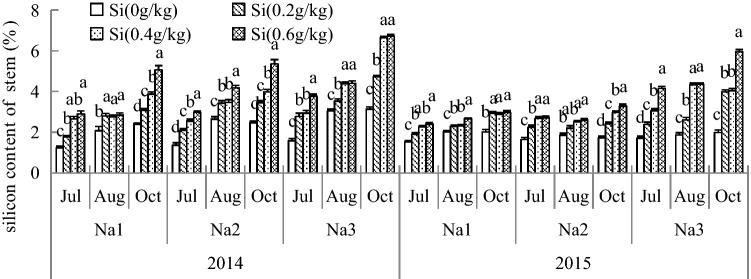
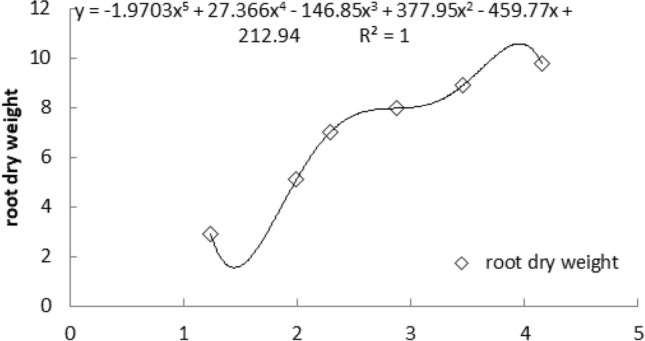
Salt stress is one of the key factors that limits the cultivation of Glycyrrhiza uralensis Fisch. (G. uralensis) in the northern part of China. In this study, three salt treatments (including 21, 42 and 63 ds/m NaCl/kg dry soil) and four Si (silicon) concentrations (including 0, 1.4, 2.8 and 4.2 ds/m SiO2/kg K2SiO3 in dry soil) were tested using G. uralensis as the plant material in a pot experiment with three replications. The results showed that the application of various concentrations of Si increased sucrose synthetase (SS), sucrose phosphate synthetase (SPS) and glutamine synthetase (GS), as well as nitrate reductase (NR) activities, and promoted carbon and nitrogen metabolism. Si application also increased the root dry weight of G. uralensis. Multilevel comparative analysis showed that the application of 2.8 ds/m SiO2 was the optimum rate for improved growth and yield of G. uralensis under different salt levels. This study provides important information that can form the basis for the cultivation of high-yielding and high-quality G. uralensis in saline soils.


Conflict of interest statement

The authors declare no competing interests.

Figures

Figure 1
Figure 1
Effect of silicon addition on the SS activity of G. uralensis under NaCl stress. The different letters within the different treatments indicate the significant difference at P ≤ 0.05 (Si source using K2SiO3 as a treatment factor, with amounts of 0, 0.2, 0.4, 0.6 g SiO2/kg dry soil). The salt treatments are denoted as Na1, Na2 and Na3, while the Si concentrations are denoted as Si0, Si1, Si2 and Si3).
Figure 2
Figure 2
Effect of silicon addition on the SPS activity of G. uralensis under NaCl stress.The different letters within the different treatments indicate the significant difference at P ≤ 0.05 (Si source using K2SiO3 as a treatment factor, with amounts of 0, 0.2, 0.4, 0.6 g SiO2/kg dry soil). The salt treatments are denoted as Na1, Na2 and Na3, while the Si concentrations are denoted as Si0, Si1, Si2 and Si3).
Figure 3
Figure 3
Effect of silicon addition on the carbon metabolites total sugar of G. uralensis under NaCl stress.The different letters within the different treatments indicate the significant difference at P ≤ 0.05 (Si source using K2SiO3 as a treatment factor, with amounts of 0, 0.2, 0.4, 0.6 g SiO2/kg dry soil). The salt treatments are denoted as Na1, Na2 and Na3, while the Si concentrations are denoted as Si0, Si1, Si2 and Si3).
Figure 4
Figure 4
Effect of silicon addition on the GS activity of G. uralensis under NaCl stress.The different letters within the different treatments indicate the significant difference at P ≤ 0.05 (Si source using K2SiO3 as a treatment factor, with amounts of 0, 0.2, 0.4, 0.6 g SiO2/kg dry soil). The salt treatments are denoted as Na1, Na2 and Na3, while the Si concentrations are denoted as Si0, Si1, Si2 and Si3).
Figure 5
Figure 5
Effect of silicon addition on the NR activity of G. uralensis under NaCl stress.The different letters within the different treatments indicate the significant difference at P ≤ 0.05 (Si source using K2SiO3 as a treatment factor, with amounts of 0, 0.2, 0.4, 0.6 g SiO2/kg dry soil). The salt treatments are denoted as Na1, Na2 and Na3, while the Si concentrations are denoted as Si0, Si1, Si2 and Si3).
Figure 6
Figure 6
Effect of silicon addition on the nitrogen metabolites total nitrogen of G. uralensis under NaCl stress. The different letters within the different treatments indicate the significant difference at P ≤ 0.05 (Si source using K2SiO3 as a treatment factor, with amounts of 0, 0.2, 0.4, 0.6 g SiO2/kg dry soil). The salt treatments are denoted as Na1, Na2 and Na3, while the Si concentrations are denoted as Si0, Si1, Si2 and Si3).
Figure 7
Figure 7
Effect of silicon addition on root dry weight of G. uralensis under NaCl stress.The different letters within the different treatments indicate the significant difference at P ≤ 0.05 (Si source using K2SiO3 as a treatment factor, with amounts of 0, 0.2, 0.4, 0.6 g SiO2/kg dry soil). The salt treatments are denoted as Na1, Na2 and Na3, while the Si concentrations are denoted as Si0, Si1, Si2 and Si3).
Figure 8
Figure 8
The silicon content of G. uralensis under NaCl stress in leaves. The different letters within the different treatments indicate the significant difference at P ≤ 0.05 (Si source using K2SiO3 as a treatment factor, with amounts of 0, 0.2, 0.4, 0.6 g SiO2/kg dry soil). The salt treatments are denoted as Na1, Na2 and Na3, while the Si concentrations are denoted as Si0, Si1, Si2 and Si3).
Figure 9
Figure 9
The silicon content of G. uralensis under NaCl stress on root. The different letters within the different treatments indicate the significant difference at P ≤  0.05 (Si source using K2SiO3 as a treatment factor, with amounts of 0, 0.2, 0.4, 0.6 g SiO2/kg dry soil). The salt treatments are denoted as Na1, Na2 and Na3, while the Si concentrations are denoted as Si0, Si1, Si2 and Si3).
Figure 10
Figure 10
The silicon content of G. uralensis under NaCl stress in stem. The different letters within the different treatments indicate the significant difference at P ≤  0.05 (Si source using K2SiO3 as a treatment factor, with amounts of 0, 0.2, 0.4, 0.6 g SiO2/kg dry soil). The salt treatments are denoted as Na1, Na2 and Na3, while the Si concentrations are denoted as Si0, Si1, Si2 and Si3).
Figure 11
Figure 11
The multiple linear regression about silicon content and root dry matter mass of G. uralensis under NaCl stress.

References

    1. Aslam M, Ahmad K, Arslan AM, Amir MM. Salinity stress in crop plants: Effects of stress, tolerance mechanisms and breeding strategies for improvement. J. Agric. Basic Sci. 2017;2(1):2518–4210.
    1. Kirsten B, Abbey FW, Thomas D, Amitava C, Jason H. Soil salinity: A threat to global food security. Agron. J. 2016;108(6):2189–2200. doi: 10.2134/agronj2016.06.0368. - DOI
    1. Shakeel AA, et al. Drought induced changes in growth, osmolyte accumulation and antioxidant metabolism of three maize hybrids. Front. Plant Sci. 2017;8(69):1–12. - PMC - PubMed
    1. Abd-ElBaki GK, et al. Nitrate reductase in Zea mays L. under salinity. Plant Cell Environ. 2000;23:515–521. doi: 10.1046/j.1365-3040.2000.00568.x. - DOI
    1. Flores P, Botella MÁ, Martínez V, Cerdá AC. Ionic and osmotic effects of nitrate reductase activity in tomato seedlings. J. Plant Physiol. 2000;156:552–557. doi: 10.1016/S0176-1617(00)80172-8. - DOI

Publication types

LinkOut - more resources