. 2021 Jun;26(6):2334-2349.
doi: 10.1038/s41380-020-00994-y. Epub 2021 Jan 13.

Serotonin receptor 4 in the hippocampus modulates mood and anxiety

Affiliations

Serotonin receptor 4 in the hippocampus modulates mood and anxiety

Remzi Karayol et al. Mol Psychiatry. 2021 Jun.

Abstract

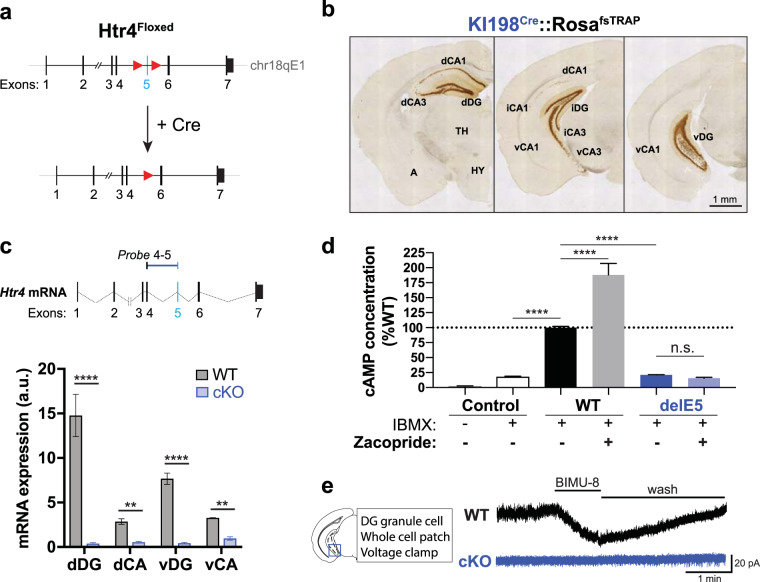
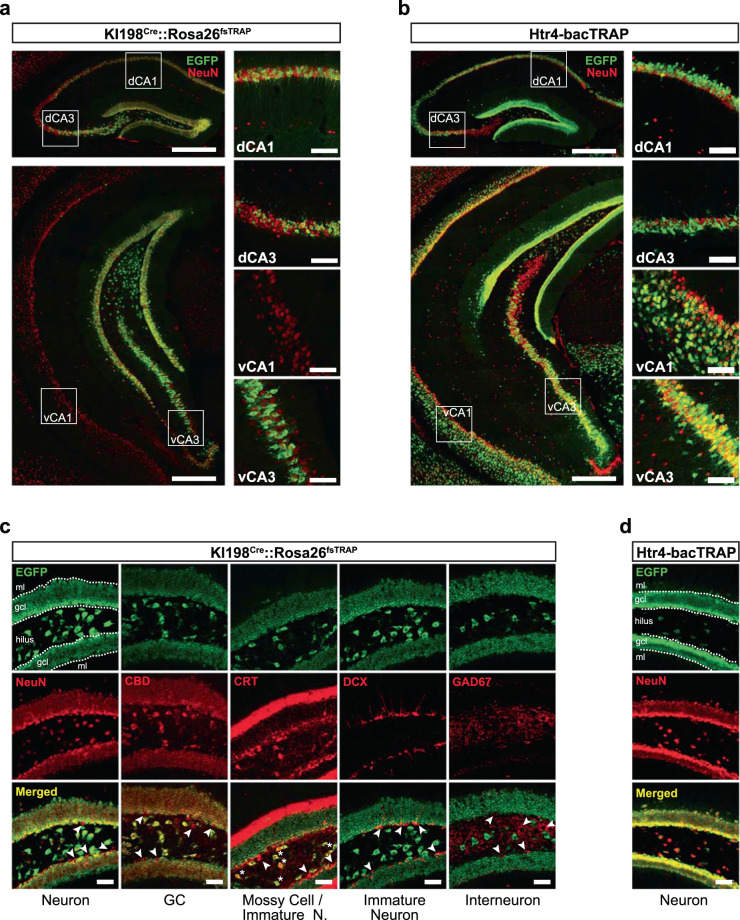
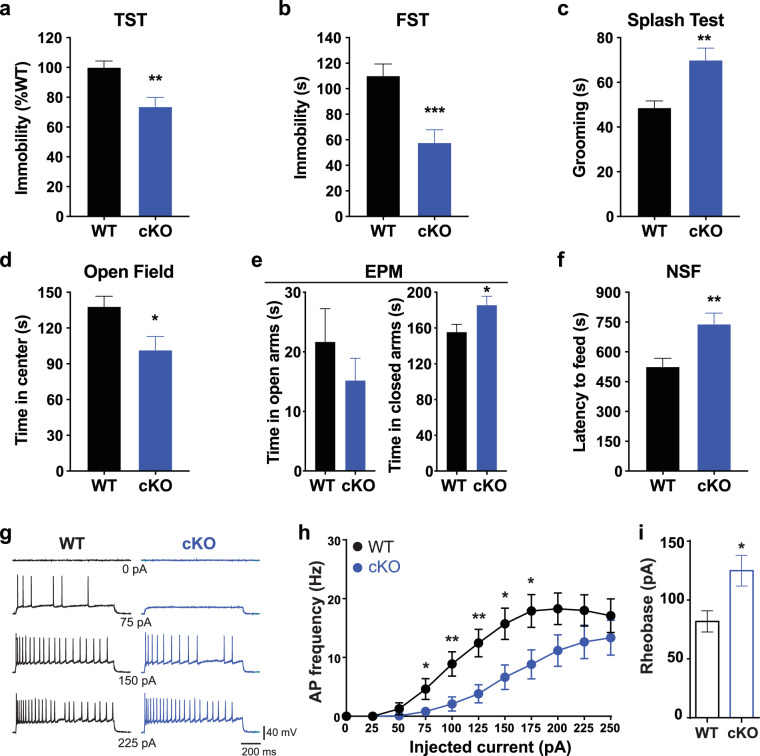
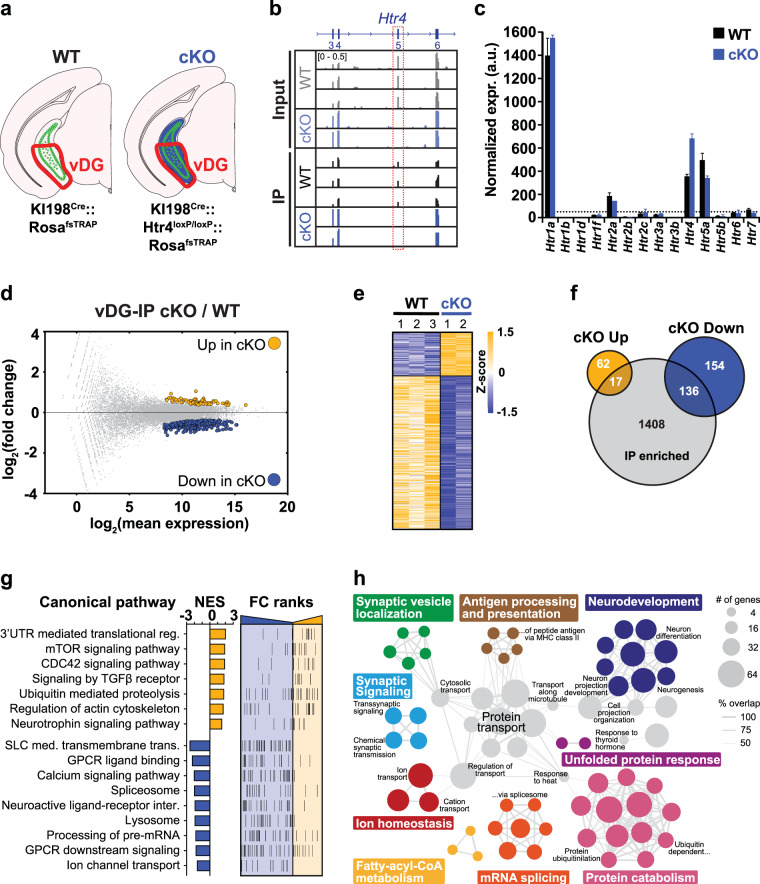
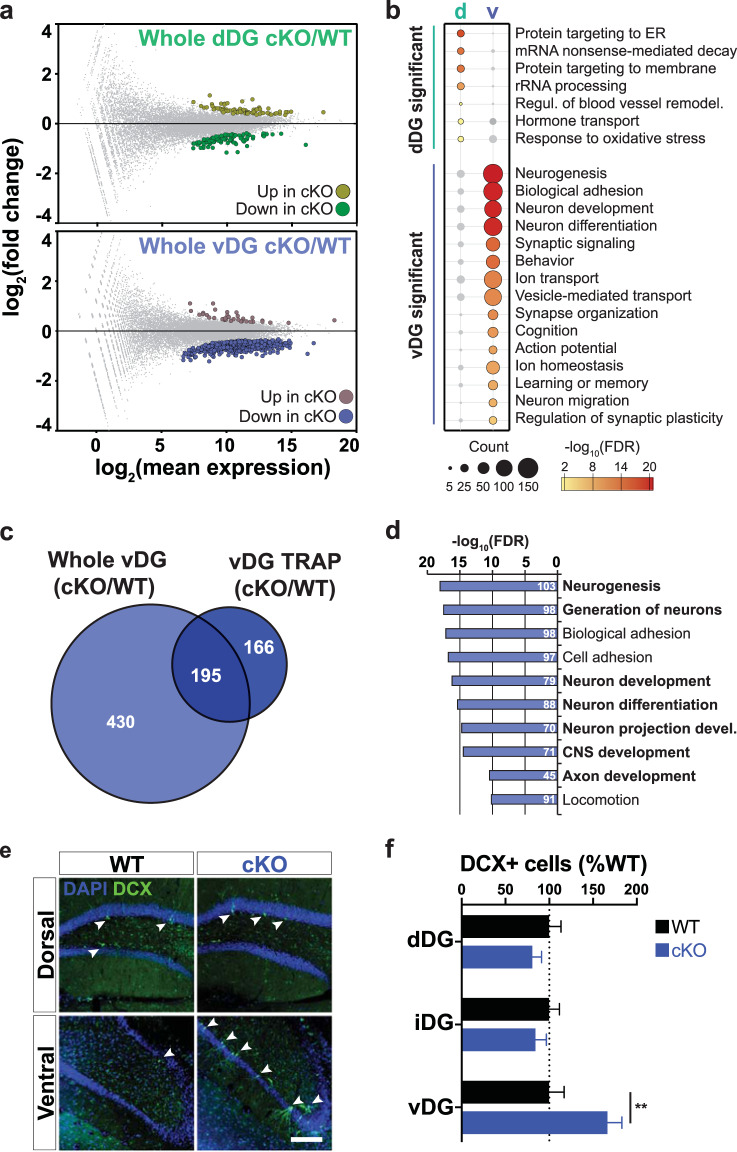
Serotonin receptor 4 (5-HT4R) plays an important role in regulating mood, anxiety, and cognition, and drugs that activate this receptor have fast-acting antidepressant (AD)-like effects in preclinical models. However, 5-HT4R is widely expressed throughout the central nervous system (CNS) and periphery, making it difficult to pinpoint the cell types and circuits underlying its effects. Therefore, we generated a Cre-dependent 5-HT4R knockout mouse line to dissect the function of 5-HT4R in specific brain regions and cell types. We show that the loss of functional 5-HT4R specifically from excitatory neurons of hippocampus led to robust AD-like behavioral responses and an elevation in baseline anxiety. 5-HT4R was necessary to maintain the proper excitability of dentate gyrus (DG) granule cells and cell type-specific molecular profiling revealed a dysregulation of genes necessary for normal neural function and plasticity in cells lacking 5-HT4R. These adaptations were accompanied by an increase in the number of immature neurons in ventral, but not dorsal, dentate gyrus, indicating a broad impact of 5-HT4R loss on the local cellular environment. This study is the first to use conditional genetic targeting to demonstrate a direct role for hippocampal 5-HT4R signaling in modulating mood and anxiety. Our findings also underscore the need for cell type-based approaches to elucidate the complex action of neuromodulatory systems on distinct neural circuits.


Conflict of interest statement

The authors declare that they have no conflict of interest.

Figures

Fig. 1
Fig. 1. Generation and validation of an Htr4Floxed mouse line.
a Schematic of Htr4Floxed allele. LoxP sites (red triangles) were inserted to flank Htr4 exon 5 (light blue bar) for Cre-mediated excision. b Low magnification anti-EGFP immunohistology of coronal brain sections from a KI198Cre::Rosa26fsTRAP mouse showing Cre expression in the hippocampus. dCA, iCA, vCA1/3: dorsal, intermediate, ventral CA1/3 fields, respectively; A: amygdala; TH: thalamus; HY: hypothalamus. c Schematic of the TaqMan probe spanning Htr4 exons 4 and 5 (Probe 4–5) is shown at top. Below, qRT-PCR (mean ± SEM) quantification showing diminished expression of Htr4 transcripts containing exon 5 along the dorsoventral axis of the hippocampus in Cre-negative (WT, gray) and cKO (blue) mice. Two-way ANOVA: genotype factor: F(1,24) = 439.0, p < 0.0001 followed by post hoc Fisher’s LSD test. n = 2–6 per group. d Quantification (mean ± SEM) of cAMP induction in HEK293T cells expressing EGFP (Control), intact 5-HT4R (WT), or Htr4delE5 (del5) in the presence or absence of the 5‑HT4R agonist, zacopride. One-way ANOVA followed by post hoc Fisher’s LSD test, n = 4 per group. e Representative traces of whole-cell voltage clamp recordings from DG GC in WT and cKO mice with bath administration of 10 mM BIMU-8. Scale bar: 1 min, 20 pA. Fisher’s LSD test, ****p < 0.0001, ***p < 0.001, **p < 0.01, n.s. p > 0.05.
Fig. 2
Fig. 2. KI198Cre expression is restricted to mature excitatory neurons in the hippocampus.
a Anti-EGFP (green) and anti-NeuN (red) immunofluorescent confocal images of coronal hippocampal sections at the level of dorsal (top left) and ventral (bottom left) hippocampus from a KI198Cre::RosafsTRAP mouse. Dorsal and ventral CA1 and CA3 fields (white boxes) are shown at higher magnification on the right. Scale bars: 500 µm (left panels) or 100 µm (right panels). b Anti-EGFP (green) and anti-NeuN (red) immunofluorescent confocal images of coronal sections at the level of dorsal (top left) and ventral (bottom left) hippocampus from an Htr4-bacTRAP mouse. Dorsal and ventral CA1 and CA3 fields (white boxes) are shown at higher magnification on the right. Scale bars: 500 µm (left panels) or 100 µm (right panels). c Immunofluorescent confocal images showing neuronal-type specific marker (red) and EGFP (green) expression in coronal sections through the DG of KI198Cre::RosafsTRAP mice. Cells labeled with a neuron-type marker but not EGFP (arrowheads) and cells double-labeled with hilar mossy cell marker CRT and EGFP (asterisks) are indicated. ml: molecular layer, gcl: granule cell layer. Scale bars, 50 µm. d Immunofluorescent confocal images of coronal sections through the DG of Htr4-bacTRAP mice labeled with anti-NeuN (red) and anti-EGFP (green). ml: molecular layer, gcl: granule cell layer. Scale bars, 50 µm.
Fig. 3
Fig. 3. cKO mice exhibit altered affective behaviors and reduced firing in vDG granule cells.
a Quantification of the time spent immobile in the tail suspension test (TST) in cKO mice (cKO, blue) and Cre-negative littermates (WT, black). **p = 0.0012, nWT = 19, ncKO = 16. b Quantification of the time spent immobile in the forced swim test (FST) for each genotype. ***p = 0.0005, nWT = 19, ncKO = 16. c Quantification of grooming time in the splash test for each genotype. **p = 0.001, nWT = 19, ncKO = 16. d Mean time spent in the center in the open field (OF) for each genotype. *p = 0.0139, nWT = 19, ncKO = 17. e Quantification of the time spent in the open (left) and closed (right) arms in the elevated plus maze (EPM). *p = 0.0239, nWT = 18, ncKO = 16. f Mean latency to feed in the novelty suppressed feeding (NSF) paradigm for each genotype. **p = 0.0033, nWT = 20, ncKO = 16. g Sample traces from whole-cell current-clamp recordings of GCs in hippocampal slices from WT and cKO mice showing spiking in response to different steps of injected current. h Quantification of the AP frequency of GCs in WT and cKO mice across current steps. i Histogram of rheobase measurements of GCs from WT and cKO mice. All data are represented as mean ± SEM and two-tailed unpaired t-tests were performed for all panels. *p < 0.05, **p < 0.01, ***p < 0.001.
Fig. 4
Fig. 4. TRAP profiling of vDG neurons in the absence of 5-HT4R.
a Schematic depicting the cell types targeted for TRAP. Green represents EGFPL10a expressing cells and blue indicates conditional 5-HT4R deletion. The area dissected is outlined in red. b Browser view of mapped reads showing the lack of expression of Htr4 exon 5 in IP and input samples in the cKO. c Bar graph of normalized expression values (mean ± SEM) of all 5-HT receptors (Htrs) in IP samples. Dashed line is drawn at normalized expr. = 50. Only Htr4 has FDR < 0.1. d MA-plot highlighting differentially expressed (DE) genes (FDR < 0.1) between the cKO and WT TRAP mRNA. Complete list of IP DE genes can be found in Table S1. e Heatmap visualization of DE genes between genotypes. f Venn diagram showing the overlap of up- and down-regulated DE genes from e with genes enriched in the KI198Cre -expressing cells (IP enriched, Table S2). g Summary of gene set enrichment analysis (GSEA) performed on the fold change (FC)-ranked gene list (p < 0.05) between cKO and WT IP data sets. The normalized enrichment score (NES) shows the direction of enrichment in the cKO and FC-ranks are arranged from down-regulated (blue) at left to up-regulated (yellow) at right. Complete list of pathways can be found in Table S3. h Summary of gene ontology (GO) analysis of DE from e. All categories shown have FDR < 0.01, full analysis is provided in Table S4.
Fig. 5
Fig. 5. Loss of 5-HT4R led to changes in neurogenesis-related genes and increased number of immature neurons in the vDG.
a MA-plots indicating differentially expressed (DE) genes (FDR < 0.05) between cKO and WT mRNA from whole dDG (top) and vDG (bottom). Complete lists can be found in Tables S5 and S6. b Comparison of significantly enriched gene ontology (GO) terms among whole dDG and vDG DE genes from a. c Venn diagram comparing DE transcripts shared and unique to vDG TRAP (dark blue) and whole vDG tissue (light blue) samples. d Top ten GO terms enriched in the whole vDG-specific gene list from c. Terms related to neurogenic tone are in bold. Complete lists can be found in Tables S7 and S8. e Representative images of anti-DCX immunofluorescence in coronal sections through dDG and vDG from cKO and WT mice. Arrowheads indicate DCX+ cells. DAPI is shown in blue. Scale bar, 150 µm. f Quantification (mean ± SEM) of DCX+ cells per granule cell layer area in the dorsal (dDG), intermediate (iDG), and ventral (vDG) DG. Two-way ANOVA: genotype × region interaction, F(2,24) = 6.328, p = 0.0062 followed by post hoc Fisher’s LSD test, **p = 0.002. n = 5 per genotype.

Similar articles

Cited by

References

    1. Price JL, Drevets WC. Neural circuits underlying the pathophysiology of mood disorders. Trends Cogn Sci. 2012;16:61–71. doi: 10.1016/j.tics.2011.12.011. - DOI - PubMed
    1. Ressler KJ, Mayberg HS. Targeting abnormal neural circuits in mood and anxiety disorders: from the laboratory to the clinic. Nat Neurosci. 2007;10:1116–24. doi: 10.1038/nn1944. - DOI - PMC - PubMed
    1. Krishnan V, Nestler EJ. The molecular neurobiology of depression. Nature. 2008;455:894–902. doi: 10.1038/nature07455. - DOI - PMC - PubMed
    1. Ferguson JM. SSRI antidepressant medications: adverse effects and tolerability. Prim Care Companion J Clin Psychiatry. 2001;3:22–7. doi: 10.4088/PCC.v03n0105. - DOI - PMC - PubMed
    1. Schmidt EF, Warner-Schmidt JL, Otopalik BG, Pickett SB, Greengard P, Heintz N. Identification of the cortical neurons that mediate antidepressant responses. Cell. 2012;149:1152–63. doi: 10.1016/j.cell.2012.03.038. - DOI - PMC - PubMed

Publication types

Substances