Clinical Trial
. 2021 Jan;27(1):165-173.
doi: 10.1038/s41591-020-01193-6. Epub 2021 Jan 13.

Cabozantinib for neurofibromatosis type 1-related plexiform neurofibromas: a phase 2 trial

Collaborators, Affiliations
Clinical Trial

Cabozantinib for neurofibromatosis type 1-related plexiform neurofibromas: a phase 2 trial

Michael J Fisher et al. Nat Med. 2021 Jan.

Abstract

Neurofibromatosis type 1 (NF1) plexiform neurofibromas (PNs) are progressive, multicellular neoplasms that cause morbidity and may transform to sarcoma. Treatment of Nf1fl/fl;Postn-Cre mice with cabozantinib, an inhibitor of multiple tyrosine kinases, caused a reduction in PN size and number and differential modulation of kinases in cell lineages that drive PN growth. Based on these findings, the Neurofibromatosis Clinical Trials Consortium conducted a phase II, open-label, nonrandomized Simon two-stage study to assess the safety, efficacy and biologic activity of cabozantinib in patients ≥16 years of age with NF1 and progressive or symptomatic, inoperable PN ( NCT02101736 ). The trial met its primary outcome, defined as ≥25% of patients achieving a partial response (PR, defined as ≥20% reduction in target lesion volume as assessed by magnetic resonance imaging (MRI)) after 12 cycles of therapy. Secondary outcomes included adverse events (AEs), patient-reported outcomes (PROs) assessing pain and quality of life (QOL), pharmacokinetics (PK) and the levels of circulating endothelial cells and cytokines. Eight of 19 evaluable (42%) trial participants achieved a PR. The median change in tumor volume was 15.2% (range, +2.2% to -36.9%), and no patients had disease progression while on treatment. Nine patients required dose reduction or discontinuation of therapy due to AEs; common AEs included gastrointestinal toxicity, hypothyroidism, fatigue and palmar plantar erythrodysesthesia. A total of 11 grade 3 AEs occurred in eight patients. Patients with PR had a significant reduction in tumor pain intensity and pain interference in daily life but no change in global QOL scores. These data indicate that cabozantinib is active in NF1-associated PN, resulting in tumor volume reduction and pain improvement.


Conflict of interest statement

COMPETING INTERESTS

The authors declare the following competing interests:

C-S.S. is currently employed at Merck Research Laboratories (MRL) within Merck and Co. in Late Stage Oncology Clinical Development, and is a consultant for the Selumetinib NF program at MRL. P.L.W. has holdings in Bristol-Myers Squibb under the amount allowable by the NIH. The remaining authors have no competing interests to declare.

Figures
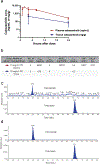
Extended Data Fig. 1
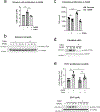
Extended Data Fig. 1. Pharmacokinetics of cabozantinib in Nf1flox/flox;PostnCre mice.
(a) Concentration-time profiles of cabozantinib in plasma and nerve tissue samples from n=3 mice at each time. Plasma samples were measured at 1, 2, 4, 8, and 24 hours, while tissue samples were measured at 4 and 24 hours after a single 15mg/kg oral gavage dose of cabozantinib. The error bars indicate standard deviations. (b) Pharmacokinetic outcomes of cabozantinib in n=3 mice administered a single 15mg/kg oral gavage dose. All values are presented as the arithmetic mean. (c) Chromatography of cabozantinib (top) at the lowest limit of quantification, 3ng/mL, and the internal standard, temazepam (bottom). (d) Chromatography of cabozantinib (top) and the internal standard, temazepam (bottom). The filled peaks are the analyte of interest.
Extended Data Fig. 2
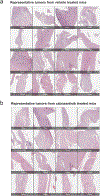
Extended Data Fig. 2. Representative tumors from vehicle and cabozantinib treated Nf1flox/flox;PostnCre mice.
H&E stained photomicrographs of plexiform neurofibroma tumors in the vehicle (a) and cabozantinib (b) treated cohorts. Magnification are as denoted by the scale bars. The experiment was repeated three times independently with similar results.
Extended Data Fig. 3
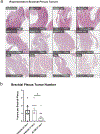
Extended Data Fig. 3. Representative plexiform neurofibroma and nerve tissues within the brachial plexus of Nf1flox/flox;PostnCre mice before after treatment with vehicle vs cabozantinib.
(a) H&E stained photomicrographs of plexiform neurofibromas and nerve tissues within the brachial plexus of mice of 4 month old Nf1flox/flox;PostnCre mice prior to treatment (top) and after 12 weeks treatment (7 month old) with either vehicle (middle) or cabozantinib (bottom). (b) The number of tumors in the brachial plexus was quantified as shown in the bar blot. Bars represent the standard error of the mean. The number of independent mice evaluated in each group were as follows Nf1flox/flox;PostnCre prior to treatment (4 months, n=5), vehicle treated (7 months, n =13), cabozantinib treated (7 mo, n=16). *Adjusted P-value = 0.0254, vehicle vs cabozantinib at 7 months (one-way ANOVA with Tukey’s multiple comparisons test).
Extended Data Fig. 4
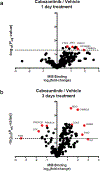
Extended Data Fig. 4. Kinome analysis of murine plexiform neurofibromas after treatment with 1 day and 3 days of cabozantinib.
Volcano plot showing log2- fold change MIB binding (LFQ intensity) after (a) 1 day (n=3) and (b) 3 days (n=5) of cabozantinib vs vehicle (n=4) control treated sciatic nerve tumor tissue plotted against the -log10 Benjamini-Hochberg adjusted P value of unpaired, two-tailed Student’s t-tests. The dotted line denotes FDR = 0.05. Increased MIB binding was observed of a number of kinases known to modulate an array of cellular processes including proliferation and survival (RPS6KB1), migration and adhesion (PTK2), interferon signaling (JAK1 and TYK2), NF-kappa B signaling (IKBKB), cell cycle and DNA damage response (CDK5 and NEK1), and longterm potentiation and neurotransmitter release (CAMK2A). Kinases with decreased MIB binding after 3 days of cabozantinib treatment including those modulating B lymphocyte development, differentiation and signaling (BTK), cAMP-dependent signaling (PRKACA and PRKACB), and regulation of immune cell chemotaxis and mast cell degranulation (FGR). None of these kinases were cognate targets of cabozantinib and their 4 suppression was transient, likely reflective of an early cellular stress response invoked by cabozantinib.
Extended Data Fig. 5
Extended Data Fig. 5. Top 20 decreased kinases in MIB competition proteomics assays with cabozantinib.
Stacked bar plot for the top 20 decreased kinases representing the summed log2 fold change in MIB binding for two biological replicates incubated in vitro at varying concentrations of cabozantinib vs DMSO.
Extended Data Fig. 6
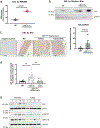
Extended Data Fig. 6. Evaluation of AXL as a cabozantinib target in plexiform neurofibromas of Nf1 mutant mice
(a) MIB binding (LFQ intensity) for AXL in tumor bearing sciatic nerve tissue of Nf1 mutant mice as compared to the WT control. P-value (unpaired, two-tailed Students t-test) <0.0001 as shown. Nerve tissues from n= 3 mice (WT) and n=4 mice (Nf1flox/flox;PostnCre) were analyzed in one experiment. Data are presented as mean ± SEM. (b) AXL was detected by western blot in sciatic nerve tissue lysates from plexiform neurofibroma bearing Nf1flox/flox;PostnCre mice and WT control. GAPDH is shown as the loading control. AXL levels normalized to GAPDH were significantly increased in tumor bearing tissue relative to the WT control, P=0.05 by two-tailed, Mann-Whitney test. Nerve tissue lysates from n=3 mice (WT) and n=4 mice (Nf1flox/flox;PostnCre) were analyzed in two independent experiments. (c) AXL expression was detected by immunohistochemistry in WT (PostnCre negative) and Nf1flox/flox;PostnCre tumor bearing tissues following 12 weeks of treatment with either vehicle or cabozantinib. The negative control is shown at the inset. Original magnification x20. The experiment was conducted two times independently with similar results. (d) The percentage of AXL high positive pixels normalized to the tissue area was quantified using ImageJ software and the IHC Profiler plugin. The number of independent mice evaluated per treatment condition were as follows, WT (n=3), vehicle Nf1flox/flox;PostnCre (n=6), and cabozantinib Nf1flox/flox;PostnCre (n=6). Three independent tissue regions were scored from each mouse. The experiment was conducted once. ***Adjusted P-value = 0.0003 vehicle vs cabozantinib, Nf1flox/flox;PostnCre. **Adjusted P-value = 0.0059 WT vs vehicle Nf1flox/flox;PostnCre (one-way ANOVA with Tukey’s multiple comparisons test). Data are presented as mean ± SEM. (e) AXL, GSK3β, pAKT, and pMEK1/2 and GAPDH were detected by western blot in tumor bearing sciatic nerve tissues from Nf1flox/flox;PostnCre mice treated with either cabozantinib or the vehicle control. The experiment was conducted two times independently with similar results.
Extended Data Fig. 7
Extended Data Fig. 7. Cabozantinib modulates multiple cellular constituents of plexiform neurofibroma by abrogating AXL signaling.
(a) Primary Nf1−/− Schwann cells were stimulated with GAS6 (200 ng/mL) in the presence or absence of cabozantinib (100 nM). Proliferation was assessed by manual cell counting after 48 hours (n=3 replicates per condition). **Adjusted P-value = 0.0091 unstimulated vs GAS6, **Adjusted P-value =0.0053 GAS6 vs GAS6 + cabozantinib (one-way ANOVA with Sidak’s multiple comparisons test). Data are presented as mean ± SEM. (b) pAXL was detected by western blot following stimulation with GAS6 (250 ng/mL) in the presence or absence of cabozantinib (2500 nM). GAPDH is shown as a loading control. The experiment was conducted two times independently with similar results. (c) Murine embryonic fibroblasts were stimulated with GAS6 (200 ng/mL) in the presence or absence of cabozantinib (2000 nM). Proliferation was assessed by manual cell counting after 48 hours (n=6 replicates per condition). **Adjusted P-value = 0.0032 unstimulated vs cabozantinib only, ****Adjusted P-value <0.0001 unstimulated vs GAS6 only, ****Adjusted P-value <0.0001 GAS6 vs GAS6 + cabozantinib (one-way ANOVA with Sidak’s multiple comparisons test). Data are presented as mean ± SEM. (d) pAXL was detected by western blot in primary murine embryonic fibroblasts following stimulation with GAS6 (250 ng/mL) from 0 to 30 minutes in the presence or absence of cabozantinib (2000 nM). GAPDH is shown as a loading control. The experiment was conducted two times independently with similar results. (e) Human umbilical cord blood derived endothelial colony forming cells (ECFCs) were plated and stimulated with GAS6 (200 ng/mL) in the presence or absence of cabozantinib (100 nM). Proliferation was assessed by manual cell counting after 48 hours (n=6 replicates per condition). ***Adjusted P-value = 0.0003 unstimulated vs GAS6, *Adjusted P-value = 0.0321 GAS6 vs GAS6 + cabozantinb, ns = not statistically significant, adjusted P-value = 0.0714 (one-way ANOVA with Sidak’s multiple comparisons test). Data are presented as mean ± SEM. pAXL was detected by western blot in ECFCs following stimulation with GAS6 (200 ng/mL) from 0 to 30 minutes in the presences or absence of cabozantinib (1000 nM). GAPDH is shown as a loading control.
Extended Data Fig. 8
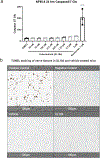
Extended Data Fig. 8. Cabozantinib does not induce apoptosis in Schwann cells or plexiform neurofibroma tumor tissues in vivo.
(a) Cabozantinib does not induce apoptosis by caspase 3/7 glo assay in human NF1−/− SC across of range of doses from 39 nM to 5 μM. By contrast, a robust increase in caspase 3/7 activity was observed in NF1−/− Schwann cells treated with Navitoclax (1 μM) as a positive control shown at the right. n=3 independent cell culture wells were analyzed per condition over two independent experiments. ****Adjusted P-value < 0.0001 Navitoclax vs all other conditions (one-way ANOVA with Tukey’s multiple comparisons test). Data are presented as mean ± SD. (b) Representative nerve tissues in cabozantinib (XL184) and vehicle treated mice are negative for TUNEL staining indicating that cabozantinb does not induce apoptosis. Positive and negative controls are shown at the top of the panel. The experiment was conducted two times independently with similar results.
Extended Data Fig. 9
Extended Data Fig. 9. Increases in sAXL following cabozantinib treatment in Nf1flox/flox;PostnCre mice.
(a) Cartoon schematic depicting release of soluble AXL following binding of Gas6 and proteolytic cleavage. (b) Soluble AXL was measured by ELISA in the plasma of WT (PostnCre negative) (n=8) and Nf1flox/flox;PostnCre mice following 12 weeks of treatment with either vehicle (n=13) or cabozantinib (n=16). *Adjusted P-value = 0.0167 WT vs cabozantinib Nf1flox/flox;PostnCre, *Adjusted P-value = 0.0179 vehicle vs cabozantinib Nf1flox/flox;PostnCre (one-way ANOVA with Tukey’s multiple comparisons test).
Extended Data Fig. 10
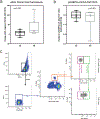
Extended Data Fig. 10. sAXL levels and proangiogenic CHSPCs vs clinical response to cabozantinib in trial participants.
(a) A panel of 45 cytokines including soluble AXL (sAXL) were analyzed in the serum of clinical trial participants (n=6 with SD, n=8 with PR). The barplot depicts the change in the mean level of sAXL (ng/mL) between baseline/early (C0/C15) and later cycles (C2/C4) by clinical response of study participants (SD vs PR; P=0.08 by two-tailed, Mann-Whitney test). Grubb’s test with an alpha value of 0.05 did not identify any statistical outliers within the dataset. Whiskers extend from the minima to maxima. The center line represents the median. The box spans the 25th to 75th percentiles. (b) The frequency of proangiogenic CHSPCs was analyzed in the peripheral blood in n=13 participants (n=6 with SD, and n=7 with PR) collected at 4 time points: prior to cycle 1/baseline (C0), cycle 1 day 15 (C1D13) end of cycle 2 (C2), and end of cycle 4 (C4). The change in the mean frequency of proangiogenic CHSPCs from early (C0/C1D15) to later (C2/C4) treatment cycles was plotted in participants with SD vs PR (p=0.6282 by two-tailed, Mann Whitney test). Whiskers extend from the minima to maxima. The center line represents the median. The box spans the 25th to 75th percentiles. (c) Gating strategy for identification of proangiogenic CHSPCs by flow cytometry.
Figure 1.
Figure 1.. Cabozantinib reduces plexiform neurofibroma tumor burden in Nf1 mutant mice.
(a) Representative photomicrographs of H&E (low mag, left and high mag, middle) and trichrome (high mag, right) stained sections of vehicle (top) and cabozantinib (bottom) treated nerve tissue demonstrating normalization of nerve microarchitecture and reduced collagen with cabozantinib treatment. The experiment was repeated three times independently with similar results. (b) The number of plexiform neurofibroma tumors in the nerve tree were scored per mouse in vehicle (n=13) and cabozantinib (n= 16) treated animals. *** P-value = 0.0004 (unpaired, two-tailed Student’s t-test). Data are presented as mean values ± SEM. (c) Mean proximal nerve root volume (mm3) in vehicle and cabozantinib treated animals. N=56 nerve roots from n=14 mice were evaluated in the vehicle group and n=64 nerve roots from n=16 mice were evaluated in the cabozantinib treated group. ** P-value = 0.0011 (unpaired, two-tailed Student’s t-test). Data are presented as mean values ± SEM. (d) Left, mast cells per high power field were scored on toluidine blue stained sections of vehicle (n= 4 mice) and cabozantinib (n= 4 mice) treated nerve tissue. 15 randomly selected 40x fields were scored per slide. Right, representative images of toluidine blue staining in vehicle (Veh) and cabozantinib (Cabo) treated mice. Arrowheads indicate mast cells. ns, no statistically significant difference, P = 0.1013 (unpaired, two-tailed Students t-test). Data are presented as mean values ± SEM. (e) Left, blood vessels per high power field were scored on CD31 stained sections of nerve tissue from vehicle (n= 4 mice) and cabozantinib (n=4 mice) treated mice. 20 randomly selected 40x fields we scored per slide. Right, represenative images of CD31 staining in vehicle and cabozanitinib treated mice. Arrowheads indicate blood vessels. Inset, secondary antibody only control. **** P-value < 0.0001 (unpaired, two-tailed Student’s t-test). Data are presented as mean values ± SEM.
Figure 2.
Figure 2.. MIB/MS profiling reveals cabozantinib target-kinases in plexiform neurofibroma tumors of Nf1 mutant mice.
(a) Volcano plot showing the log2-fold change MIB binding (LFQ intensity) in sciatic nerve tumor tissue lysate after 7 days of cabozantinib (n= 3 mice) vs vehicle control (n= 4 mice) treatment, plotted against the −log10 Benjamini-Hochberg adjusted P-value of unpaired, two-tailed Student’s t-tests (the dotted line represents FDR = 0.05). Red points highlight known cabozantinib target kinases with the most significant log2 fold changes in MIB binding. (b) The log2 fold change in MIB binding in sciatic nerve tumor tissue lysate at the indicated cabozanitinib concentrations compared to DMSO is plotted for two replicates. Lysate was incubated in vitro with DMSO or the indicated concentrations of cabozantanib for 1 hour prior to MIB/MS kinome profiling.
Figure 3.
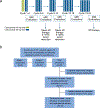
Figure 3.. Clinical trial schema and CONSORT diagram.
(a) Enrolled participants were started on 40 mg of cabozantinib daily for the first 2 cycles, then escalated to 60 mg daily for the remaining cycles if no dose-limiting toxicities (DLT) occurred. Each cycle was 28 days in duration. MRI evaluations occurred after cycles 4, 8, 12 and then after cycles 18 and 24 for those who stayed on treatment. Evaluable participants were those who completed at least 2 cycles of therapy and had at least one follow-up MRI. Participants who did not show ≥15% volumetric reduction of the target plexiform neurofibroma by cycle 8 were taken off study; those who had ≥20% volumetric reduction of the target plexiform neurofibroma by cycle 12 continued therapy for up to another 12 cycles. (b) CONSORT diagram showing disposition of the study participants. Nine patients were initially enrolled on study. Per the 2-stage study design, once one of the participants achieved a partial response, an additional 14 patients were enrolled. In total, 23 patients were enrolled on study but only 21 participants received at least 1 dose of cabozantinib, and of these 21 participants, only 19 were evaluable for therapy response.
Figure 4.
Figure 4.. Participant responses to cabozantinib.
(a) Waterfall plot per participant of best response to cabozantinib as determined by the percent change from baseline in target plexiform neurofibroma tumor volume. Eight of nineteen participants (42.1%) demonstrated a partial response (PR) with greater than 20% reduction of target plexiform neurofibroma tumor volume from baseline. (b) Duration of therapy for participants with stable disease (SD), indicated by green bars, and those with PR, indicated by blue bars. The length of the bar shows time from first dose administration until drug discontinuation. Red open stars indicate the first dose reduction and red closed stars indicate the second dose reduction. For responders, yellow triangles show the time of initial PR and yellow circles show the time of maximum response. Two patients achieved first and maximum responses after 2 dose reductions.

Similar articles

Cited by

References

    1. America, P.R.a.M.o. 2005 – 2015: A Decade of Innovation In Rare Diseases. (2015).
    1. Friedman JM Epidemiology of neurofibromatosis type 1. Am J Med Genet 89, 1–6 (1999). - PubMed
    1. Wallace MR, et al. Type 1 neurofibromatosis gene: identification of a large transcript disrupted in three NF1 patients. Science 249, 181–186 (1990). - PubMed
    1. Viskochil D, et al. Deletions and a translocation interrupt a cloned gene at the neurofibromatosis type 1 locus. Cell 62, 187–192 (1990). - PubMed
    1. Ballester R, et al. The NF1 locus encodes a protein functionally related to mammalian GAP and yeast IRA proteins. Cell 63, 851–859 (1990). - PubMed

Publication types

MeSH terms

Associated data