. 2021 Jan;589(7841):246-250.
doi: 10.1038/s41586-020-03078-7. Epub 2021 Jan 13.

Patterns of de novo tandem repeat mutations and their role in autism

Affiliations

Patterns of de novo tandem repeat mutations and their role in autism

Ileena Mitra et al. Nature. 2021 Jan.

Abstract

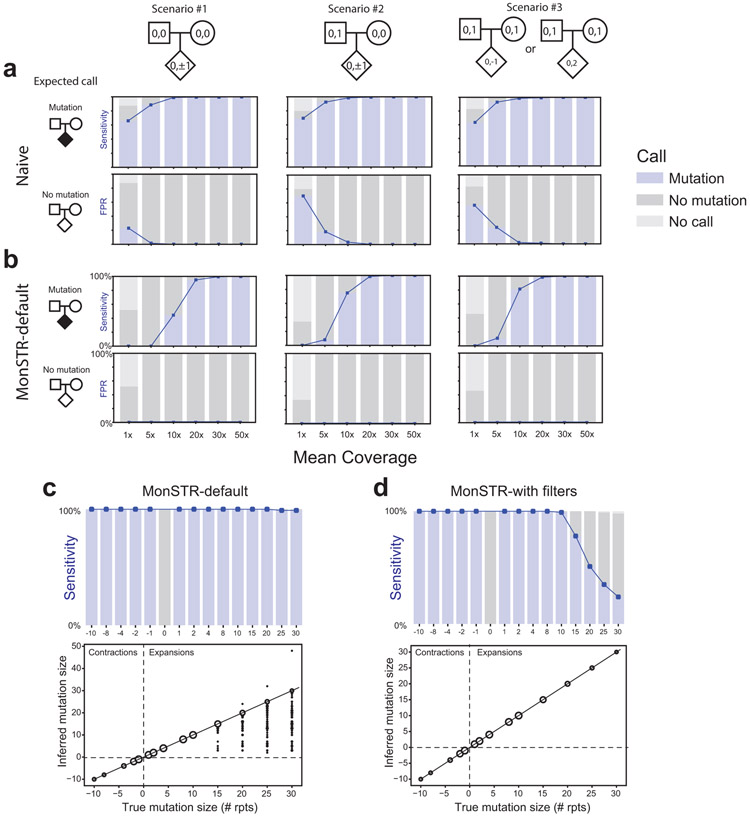
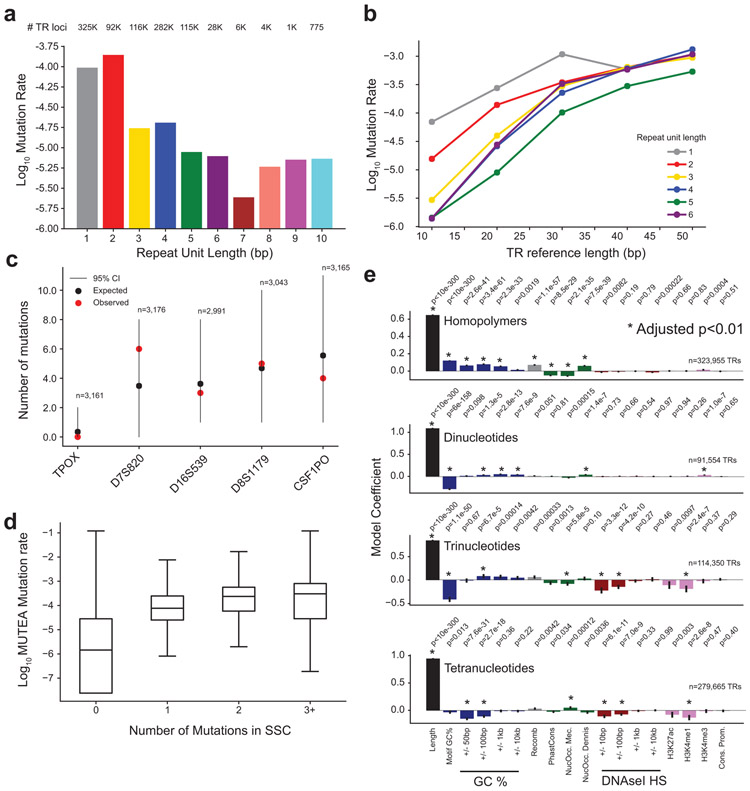
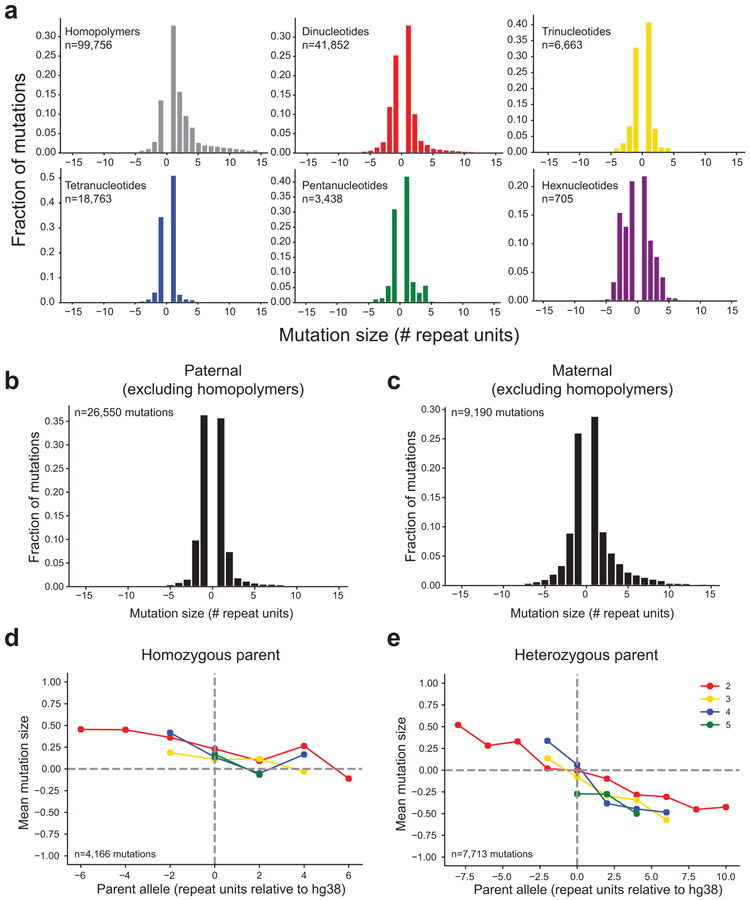
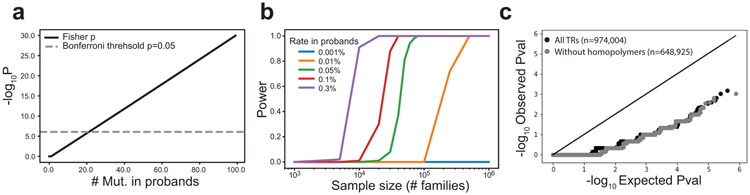
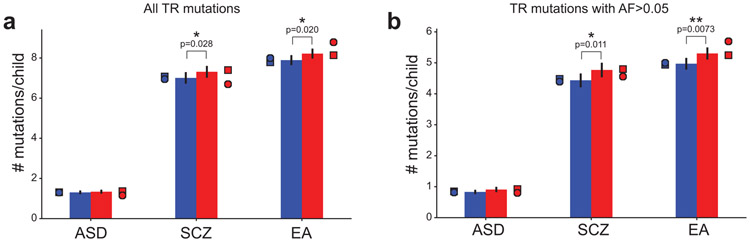
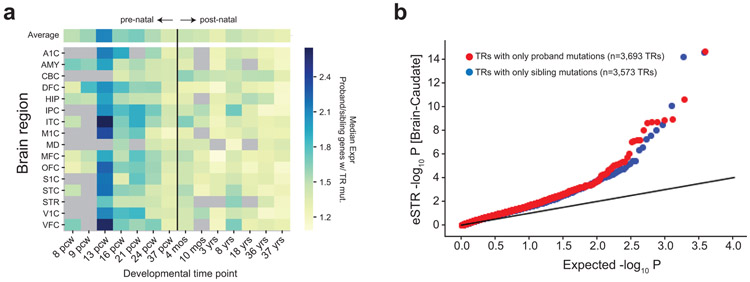
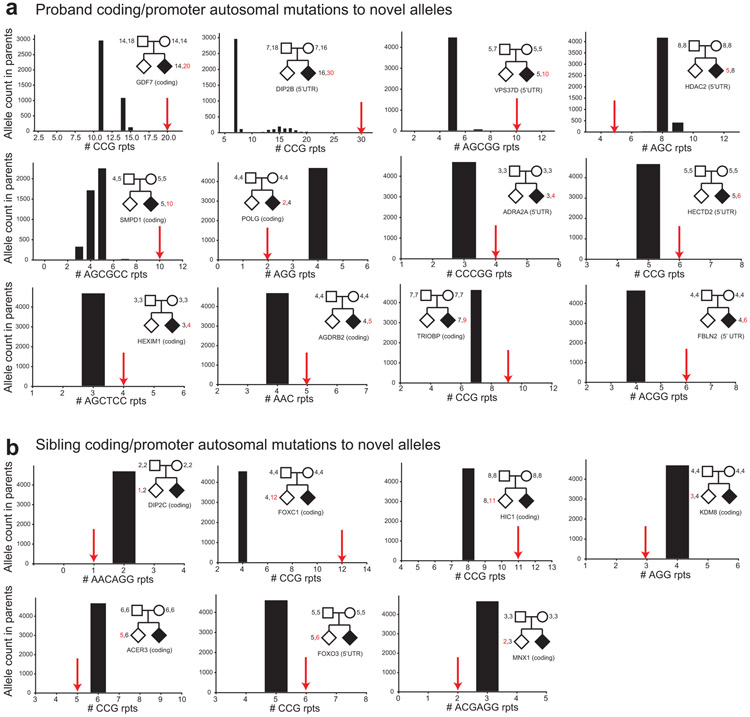
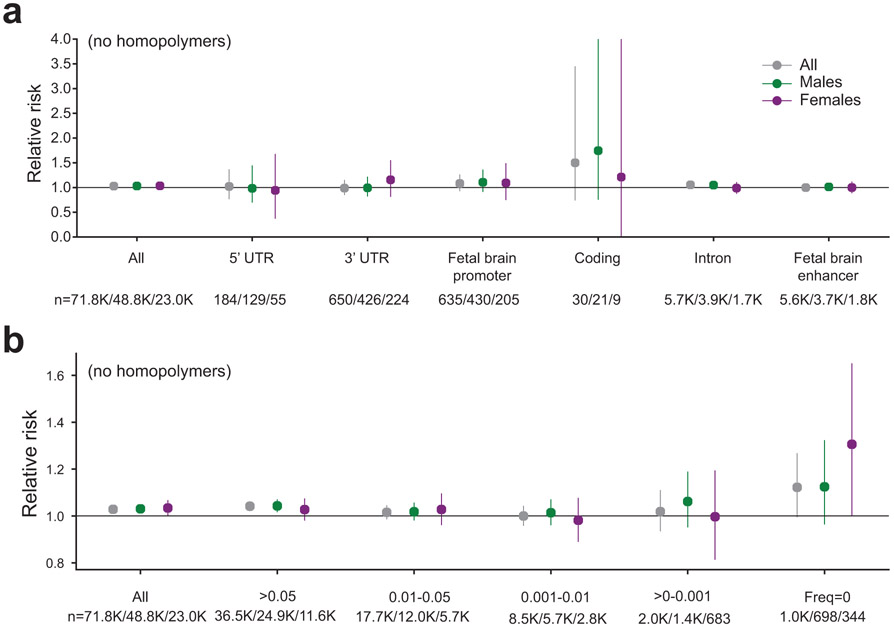
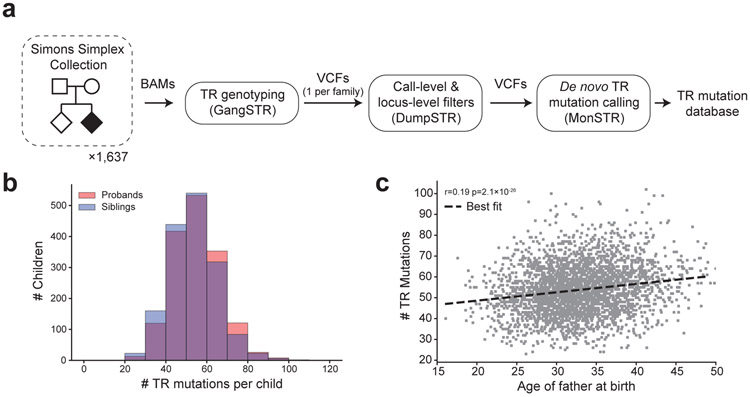
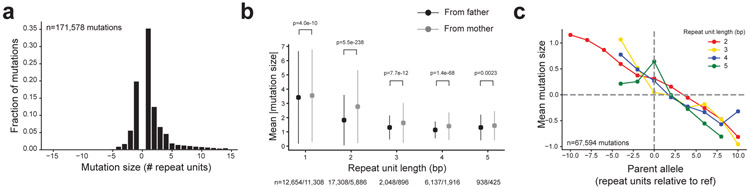
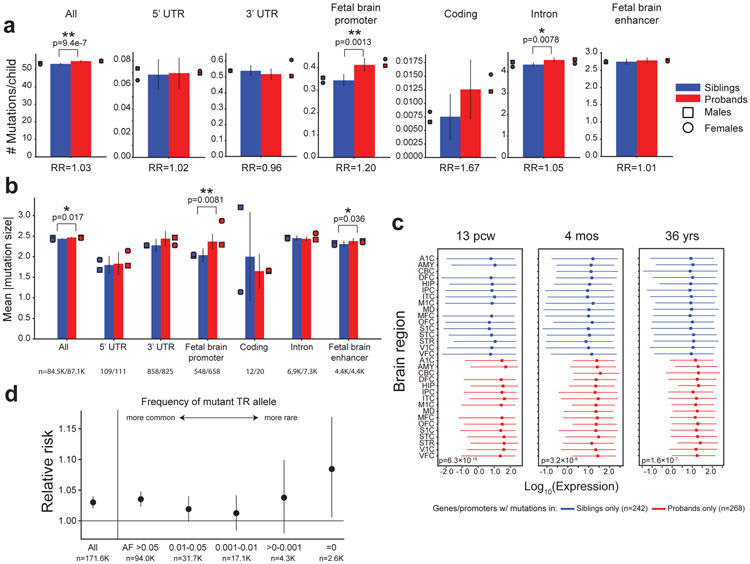
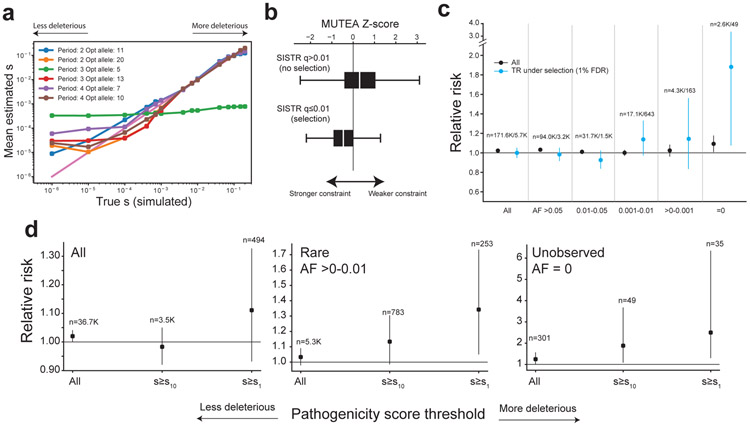
Autism spectrum disorder (ASD) is an early-onset developmental disorder characterized by deficits in communication and social interaction and restrictive or repetitive behaviours1,2. Family studies demonstrate that ASD has a substantial genetic basis with contributions both from inherited and de novo variants3,4. It has been estimated that de novo mutations may contribute to 30% of all simplex cases, in which only a single child is affected per family5. Tandem repeats (TRs), defined here as sequences of 1 to 20 base pairs in size repeated consecutively, comprise one of the major sources of de novo mutations in humans6. TR expansions are implicated in dozens of neurological and psychiatric disorders7. Yet, de novo TR mutations have not been characterized on a genome-wide scale, and their contribution to ASD remains unexplored. Here we develop new bioinformatics methods for identifying and prioritizing de novo TR mutations from sequencing data and perform a genome-wide characterization of de novo TR mutations in ASD-affected probands and unaffected siblings. We infer specific mutation events and their precise changes in repeat number, and primarily focus on more prevalent stepwise copy number changes rather than large expansions. Our results demonstrate a significant genome-wide excess of TR mutations in ASD probands. Mutations in probands tend to be larger, enriched in fetal brain regulatory regions, and are predicted to be more evolutionarily deleterious. Overall, our results highlight the importance of considering repeat variants in future studies of de novo mutations.


Figures

Extended Data Figure 1:
Extended Data Figure 1:. Evaluation of MonSTR using simulated data.
a. Evaluation of a naïve TR mutation calling method. WGS was simulated for probands with mutations and controls with no mutation under three different scenarios for a range of mean sequencing coverages (Methods). Top plots show the sensitivity (blue line). Bottom plots show the false positive rate (FPR). Shaded bars show the percent of transmissions called as mutation (blue), no mutation (dark gray), or no call (light ray). b. Evaluation of MonSTR’s default model-based method. Plots are the same as in a. but based on MonSTR’s default model (Supplementary Methods). Note FPR lines are not visible because all are at 0%. c. Evaluation of TR mutation calling using default model-based MonSTR settings as a function of mutation size. The top plot is the same as in a-b, and shows the sensitivity to detect mutations as a function of their size. The bottom plot compares the estimated called mutation size (y-axis) compared to the true simulated mutation size (x-axis). Bubble sizes show the number of mutation calls represented at each point. d. Evaluation of TR mutation calling as a function of mutation size after quality filtering. Plots are same as in c, but using the stringent quality filters in MonSTR applied to analyze the SSC cohort. Compared to default settings, sensitivity is decreased especially for larger expansions but inferred mutation sizes are unbiased. All plots are based on simulation of 100 randomly chosen TR loci (Methods). c-d show results for scenario #1.
Extended Data Figure 2:
Extended Data Figure 2:. Genome-wide de novo TR mutation rate patterns.
a. Distribution of average TR mutation rates by period. For each repeat unit length (x-axis), bars give the genome-wide estimated TR mutation rate (y-axis, log10 scale). Average mutation rates were computed as the total number of mutations divided by the total number of children analyzed. The numbers of TRs considered (rounded to the nearest 1,000) in each category are annotated. b. TR mutation rate vs. length. The x-axis shows the TR reference length (hg38) and the y-axis shows the log10 mutation rate estimated across all TRs with each reference length. Colors denote different repeat unit lengths. c. Number of TR mutations observed for CODIS markers. Red dots show observed mutation counts. Black dots show expected mutation counts and lines give 95% confidence intervals based on mutation rates reported by NIST (Methods). Each x-axis category denotes a separate CODIS marker. The total number of children analyzed is annotated above each marker d. Observed TR mutation counts concordant with MUTEA. Boxes show the distribution of log10 mutation rates estimated by MUTEA (y-axis) at each TR with a given number of mutations observed in SSC children (x-axis). Black middle lines give medians and boxes span from the 25th percentile (Q1) to the 75th percentile (Q3). Whiskers extend to Q1-1.5*IQR (minima) and Q3+1.5*IQR (maxima), where IQR gives the interquartile range (Q3-Q1). Data is shown for n=548,724 TRs for which MUTEA estimates were available. e. Determinants of TR mutation rates. The Poisson regression coefficient is shown for each feature in models trained separately for each repeat unit length (Methods). Features marked with an asterisk denote significant effects (two-sided p<0.01 after Bonferroni correction for the number of features tested across all models). Nominal P-values are annotated above each plot. Error bars give 95% confidence intervals.
Extended Data Figure 3:
Extended Data Figure 3:. Biases in TR mutation sizes.
a. Mutation size distributions by repeat unit length. Histograms show the distribution (y-axis, fraction of total) of de novo TR mutation sizes for each repeat unit length (x-axis, number of repeat units). Mutations <0 denote contractions and >0 denote expansions. Colors denote different repeat unit lengths (gray=homopolymers; red=dinucleotides; gold=trinucleotides; blue=tetranucleotides; green=pentanucleotides; purple=hexanucleotides). b-c. Mutation size distributions by parental origin. Histograms show the distribution of de novo TR mutation sizes for mutations arising in the paternal (b) and maternal (c) germlines (homopolymers excluded). d-e. Mutation directionality bias in homozygous vs. heterozygous parents. In each plot, the x-axis gives the size of the parent allele relative to the reference genome (hg38). The y-axis gives the mean mutation size in terms of number of repeat units across all mutations with a given parent allele length. A separate colored line is shown for each repeat unit length (red=dinucleotides; gold=trinucleotides; blue=tetranucleotides; green=pentanucleotides). Plots are restricted to mutations that were successfully phased to either the mother or the father for which the parent of origin was homozygous (b) or heterozygous (c). To restrict to highest confidence mutations, these plots are based only on mutations with step size of ±1 and for which the child had more than 10 enclosing reads supporting the de novo allele.
Extended Data Figure 4:
Extended Data Figure 4:. Power to detect per-locus TR mutation enrichments.
a. Number of recurrent mutations required to reach genome-wide significance. We performed a Fisher’s exact test to test for an excess of mutations in probands (n=1,593) vs. non-ASD siblings (n=1,593), for a different number of hypothetical mutation counts in probands (x-axis) and assuming 0 mutations observed in non-ASD siblings. The black line shows the two-sided P-value (log10 scale) obtained for each test. The gray dashed line denotes the P-value required to meet a genome-wide significance of p<0.05 with Bonferroni multiple testing correction. b. Sample sizes required to identify genome-wide significant TRs. The x-axis shows sample size (log10 scale) in terms of the number of quad families analyzed. Each line represents a different rate of mutation at a particular TR in probands, assuming 0 mutations at that TR in siblings (blue=0.001%; orange=0.01%; green=0.05%; red=0.1%; purple=0.3%). The y-axis shows the power to detect a specific TR at genome-wide significance for each rate. c. Quantile-Quantile plots for per-locus TR mutation burden testing. For each TR we performed a Fisher’s exact test to test for an excess of mutations in probands vs. siblings. The x-axis gives expected -log10 P-values under a null (uniform) distribution. The y-axis gives observed -log10 P-values from burden tests. Each dot represents a single TR. Black=all TRs. Gray=homopolymers excluded.
Extended Data Figure 5:
Extended Data Figure 5:. TR mutation burden near SNPs associated with ASD and related traits.
Bars show mean TR mutation counts in probands (red) vs. non-ASD siblings (blue) for TRs within 50kb of published GWAS associated SNPs (ASD=autism spectrum disorder; SCZ=schizophrenia; EA=educational attainment) considering (a) all TR mutations (ASD n=4,213; SCZ n=22,811; SCZ n=25,668 TR mutations) or (b) mutant allele frequency is >5% in controls (SSC parents) (ASD n=2,774; SCZ n=14,661; SCZ n=16,364 TR mutations). Error bars give 95% confidence intervals around the mean. Single asterisks denote nominally significant increases (Mann-Whitney one-sided p<0.05). Double asterisks denote trends that are significant after Bonferroni correction for the six categories tested. Circles and squares show counts for females and males, respectively.
Extended Data Figure 6:
Extended Data Figure 6:. Proband de novo TR mutations enriched in brain-expressed genes.
a. Ratio of median expression in proband-only genes to control-only genes across time points. The heatmap shows the ratio of the median expression of genes with only proband mutations (n=268 genes) to that of genes with only mutations in non-ASD siblings (n=242 genes). Each row shows a different brain structure from the BrainSpan dataset. Each column shows a different developmental timepoint. The black vertical line separates pre-natal from post-natal time points. Gray boxes indicate no data was available for that time point. Brain structure acronyms are defined in Methods. b. Proband TR mutations enriched for brain expression STRs. The quantile-quantile plot shows the distribution of expression STR (eSTR) unadjusted P-values based on associating TR length with gene expression in Brain-Caudate samples in the GTEx cohort. eSTR association P-values are two-sided and are based on t-statistics computed using linear regression analyses performed previously. Each point represents a TR by gene association test using a linear regression model. The x-axis gives expected -log10 P-values and the y-axis gives observed -log10 P-values. Red points show TRs with at least one de novo mutation in probands and 0 in controls. Blue points show TRs with at least one de novo mutation in controls and 0 in probands. We found no significant difference in either Brain-Cerebellum or the other 15 non-brain tissues analyzed in that study, which we expected should not be relevant to ASD (not shown).
Extended Data Figure 7:
Extended Data Figure 7:. All coding and 5’UTR mutations to novel alleles.
a. Mutations in probands at coding or 5’UTR TRs to unobserved alleles. Each panel shows a de novo TR mutation observed in ASD probands to an allele (x-axis, repeat copy number) not observed in SSC parents. Black histograms give the allele counts in parents. Red arrows denote the allele resulting from each specified de novo TR mutation. Pedigrees show genotypes of parents and the child with the mutation (probands=black diamonds; non-ASD siblings=white diamonds). The text below pedigrees gives the gene and region in which the mutation occurred. b. Mutations in non-ASD siblings at coding or 5’UTR TRs to unobserved alleles. Plots are the same as in a. except show mutations in non-ASD siblings.
Extended Data Figure 8:
Extended Data Figure 8:. TR mutation burden in ASD excluding homopolymers.
a. Mutation burden by gene annotation. b. Mutation burden by frequency of the allele arising by de novo mutation. The x-axis stratifies mutations based on non-overlapping bins of the frequency of the de novo allele in healthy controls (SSC parents). “All” includes all mutations. For other allele frequency bins, only TRs for which precise copy numbers could be inferred in at least 80% of SSC parents are included (Methods). AF=allele frequency. In both plots, the y-axis gives RR in probands vs. non-ASD siblings. Dots show estimated relative risk and lines give 95% confidence intervals. Gray=all samples; green=males only; purple=females only. Both plots show only TRs with repeat unit length >1bp.
Extended Data Figure 9:
Extended Data Figure 9:. A method to estimate selection coefficients for short TRs (STRs).
a. STR mutation model. Mutation is modeled by a stochastic mutation matrix with length-dependent mutation rates and mutation sizes following a geometric distribution with a directional bias toward the central allele. Unless otherwise indicated, alleles are specified in terms of the number of repeat units away from the central, or modal, allele at each STR. b. STR selection model. Negative selection is modeled by a diploid selection surface constructed as a function of the fitness of the individual alleles. The fitness of each allele is calculated as a function of a selection coefficient s, where the central allele has optimal fitness (w=1), and the fitness of other alleles is a function of the number of repeat units away from the optimal allele. c. Example output of forward simulations of allele frequencies. The simulation starts with one ancestral (“optimal”) allele. As s increases, variability in the resulting allele frequency distributions decreases as the less fit alleles are removed by natural selection. d. Overview of per-STR selection inference using Approximate Bayesian Computation. For each STR, the method takes a prior on s, mutation model, and demographic parameters, and the observed allele frequency distribution as input. It outputs a posterior distribution of s and a P-value from a likelihood ratio test of whether a model with selection fits better than a model without selection (s=0).
Extended Data Figure 10:
Extended Data Figure 10:. Evaluation of SISTR.
a. Comparison of true vs. inferred per-locus selection coefficients. The x-axis shows the true simulated value of s, and the y-axis shows the mean s value inferred by SISTR across 200 simulation replicates. b. Power to detect negative selection as a function of s. The x-axis shows the true simulated value of s, and the y-axis gives the power to reject the null hypothesis that s=0. Left, middle, and right panels show results using models for dinucleotide, trinucleotide, and tetranucleotide TRs, respectively. c. Inferred genome-wide distribution of s is robust to prior choice and demographic models. We applied SISTR genome-wide using 2 different demographic models (Supplementary Methods) and 3 different prior distributions (left panels) on s. Right panels show the inferred genome-wide distribution of s using different combinations of priors and demographic models. Only loci inferred to be under selection (adjusted SISTR p<1%) are included in the histograms. Red, yellow, and blue denote dinucleotides (n=29,874), trinucleotides (n=39,250), and tetranucleotides (n=13,099), respectively. d. Genes containing coding STRs under strong selection are more missense-constrained. The x-axis gives the missense constraint Z-score reported by Gnomad. The y-axis gives the frequency of genes with each missense Z-score. e. Genes containing coding STRs under strong selection are more loss-of-function intolerant. The x-axis gives the pLI score measuring loss of function intolerance of each gene reported by Gnomad. For d and e, black bars show the distribution for all genes containing an STR not inferred to be under selection (n=177; adjusted SISTR p≥1%) and red bars show the distribution for all genes containing an STR inferred to be under selection (n=21; adjusted SISTR p<1%). Vertical lines show medians of each distribution. For c-e, SISTR P-values are one-sided and based on the likelihood ratio test described in the Supplementary Methods.
Figure 1:
Figure 1:. Identifying de novo TR mutations in the SSC cohort.
a. Study design. We analyzed de novo TR mutations from WGS data for quad families from the Simons Simplex Collection. b. Distribution of the number of autosomal de novo TR mutations. TR mutation counts are shown for non-ASD siblings (blue) and probands (red). c. Correlation of mutation rate with paternal age per child. The scatter plot shows the father’s age at birth (x-axis) vs. the number of autosomal de novo TR mutations identified (y-axis). Each point represents one child (n=3,186). The dashed black line gives the best fit line.
Figure 2:
Figure 2:. Patterns of TR mutations.
a. Mutation size distribution. Sizes are in terms of repeat units, where >0 represents expansions and <0 represents contractions. b. Mean absolute mutation size by parental origin. Dots show the mean absolute mutation size for mutations phased to the paternal (black) and the maternal (gray) germlines. The x-axis denotes the length of the repeat unit in bp. Error bars give +/− 1 s.d. One-sided P-values were computed using a Mann-Whitney test. c. Directionality bias in mutation size. The x-axis gives the size of the parent allele relative to hg38. The y-axis gives the mean mutation size.
Figure 3:
Figure 3:. TR mutation burden in ASD.
a. Mean mutation counts by gene annotation. Bars denote the mean number of mutations in non-ASD siblings (blue) and probands (red). Error bars give 95% confidence intervals. Circles and squares show counts for females and males, respectively. b. Mean mutation sizes in probands vs. non-ASD siblings. Bars denote mean mutation sizes (in # repeat units). The number of mutations in each category is annotated in the figure. Error bars give 95% confidence intervals. In a-b, single and double asterisks denote significant increases (p<0.05) before and after Bonferroni correction, respectively. c. Brain expression of genes with de novo TR mutations. Red and blue lines show the distribution of expression for genes with only proband (n=268 genes) or sibling mutations (n=242 genes), respectively. Dots give medians and lines extend from the 25th to 75th percentiles of expression across all genes in each set. Brain structure acronyms are defined in Methods. d. Mutation burden by allele frequency (AF). The x-axis stratifies mutations based on non-overlapping bins of the frequency of the mutant allele in SSC parents. The y-axis gives relative risk (RR). Error bars give 95% confidence intervals. The number of mutations in each category is annotated in the figure. “All” includes all mutations. For other bins, only TRs for which precise copy numbers could be inferred in at least 80% of SSC parents are included (Methods). a., b., and d. are based on mutations in n=1,593 probands and n=1,593 siblings.
Figure 4:
Figure 4:. Prioritizing TR mutations by fitness effects.
a. Comparison of true vs. inferred per-locus selection coefficients. The x-axis shows the true simulated value of s, and the y-axis shows the mean s value inferred by SISTR across 200 simulation replicates. Each color denotes a separate mutation model based on the repeat unit length (period) and optimal allele. b. Comparison of SISTR and MUTEA. Boxes show the distribution of MUTEA constraint scores for TRs inferred to have non-significant (top; n=43,672 TRs) or significant (bottom; n=6,251 TRs) selection coefficients (FDR<1%). White middle lines give medians and boxes span from the 25th percentile (Q1) to the 75th percentile (Q3). Whiskers extend to Q1-1.5*IQR (minima) and Q3+1.5*IQR (maxima), where IQR gives the interquartile range (Q3-Q1). c. Mutation burden at TR loci under negative selection. The x-axis stratifies mutations based on the same allele frequency categories as in Fig. 3d. The y-axis gives relative risk (RR). Blue dots give RR considering only TRs inferred to be under the strongest negative selection (FDR<1%). Error bars give 95% confidence intervals. d. Per-allele selection coefficients stratify mutation burden within allele frequency bins. Larger s values denote a mutation resulting in an allele predicted to be more deleterious. s10 and s1 correspond to the top 10% and top 1% of pathogenicity scores, respectively. The y-axis gives relative risk (RR). Error bars give 95% confidence intervals.

Comment in

Similar articles

Cited by

References

Main References

    1. Association, A. P. Diagnostic and Statistical Manual of Mental Disorders (DSM-5®). (American Psychiatric Pub, 2013).
    1. Rosti RO, Sadek AA, Vaux KK & Gleeson JG The genetic landscape of autism spectrum disorders. Dev Med Child Neurol 56, 12–18, doi:10.1111/dmcn.12278 (2014). - DOI - PubMed
    1. Gaugler T et al. Most genetic risk for autism resides with common variation. Nat Genet 46, 881–885, doi:10.1038/ng.3039 (2014). - DOI - PMC - PubMed
    1. Iakoucheva LM, Muotri AR & Sebat J Getting to the Cores of Autism. Cell 178, 1287–1298, doi:10.1016/j.cell.2019.07.037 (2019). - DOI - PMC - PubMed
    1. Iossifov I et al. The contribution of de novo coding mutations to autism spectrum disorder. Nature 515, 216–221, doi:10.1038/nature13908 (2014). - DOI - PMC - PubMed

Methods References

    1. Mousavi N et al. TRTools: a toolkit for genome-wide analysis of tandem repeats. Bioinformatics, doi:10.1093/bioinformatics/btaa736 (2020). - DOI - PMC - PubMed
    1. Kent WJ et al. The human genome browser at UCSC. Genome Res 12, 996–1006, doi:10.1101/gr.229102 (2002). - DOI - PMC - PubMed
    1. Willems T et al. Genome-wide profiling of heritable and de novo STR variations. Nat Methods 14, 590–592, doi:10.1038/nmeth.4267 (2017). - DOI - PMC - PubMed
    1. Huang W, Li L, Myers JR & Marth GT ART: a next-generation sequencing read simulator. Bioinformatics 28, 593–594, doi:10.1093/bioinformatics/btr708 (2012). - DOI - PMC - PubMed
    1. Li H Aligning sequence reads, clone sequences and assembly contigs with BWA-MEM. arXiv: Genomics (2013).

Publication types