. 2021 Feb;590(7844):151-156.
doi: 10.1038/s41586-020-03118-2. Epub 2021 Jan 13.

Local immune response to food antigens drives meal-induced abdominal pain

Affiliations

Local immune response to food antigens drives meal-induced abdominal pain

Javier Aguilera-Lizarraga et al. Nature. 2021 Feb.

Abstract

Up to 20% of people worldwide develop gastrointestinal symptoms following a meal1, leading to decreased quality of life, substantial morbidity and high medical costs. Although the interest of both the scientific and lay communities in this issue has increased markedly in recent years, with the worldwide introduction of gluten-free and other diets, the underlying mechanisms of food-induced abdominal complaints remain largely unknown. Here we show that a bacterial infection and bacterial toxins can trigger an immune response that leads to the production of dietary-antigen-specific IgE antibodies in mice, which are limited to the intestine. Following subsequent oral ingestion of the respective dietary antigen, an IgE- and mast-cell-dependent mechanism induced increased visceral pain. This aberrant pain signalling resulted from histamine receptor H1-mediated sensitization of visceral afferents. Moreover, injection of food antigens (gluten, wheat, soy and milk) into the rectosigmoid mucosa of patients with irritable bowel syndrome induced local oedema and mast cell activation. Our results identify and characterize a peripheral mechanism that underlies food-induced abdominal pain, thereby creating new possibilities for the treatment of irritable bowel syndrome and related abdominal pain disorders.


Conflict of interest statement

Competing Declaration of Interests:

The authors declare no competing interests

Figures
Extended Data Fig. 1
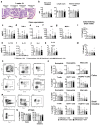
Extended Data Fig. 1. Extended analysis of the OVA-specific immune response and VHS in post-infectious mice.
a, b, diarrhea development quantification by (a) water content in feces and (b) whole-gut transit time upon gavage of carmine red dye in OVA/sham + OVA, OVA/infected + OVA (n = 10/group) mice. c, quantification of OVA-specific IgE in intestinal homogenates of OVA/sham + OVA, saline/infected + OVA, OVA/infected + saline and OVA/infected + OVA mice (n = 9, 10, 10 and 9, respectively) at 7 weeks post-infection. d, ear-swelling after intradermal injection of OVA in OVA/sham + OVA (n = 6), OVA/infected + OVA (n = 10), at 7 weeks post-infection, and OVA-allergy mice (n = 6, 10 and 6, respectively). e, f, VMR to colorectal distention in (e) OVA/sham + OVA, OVA/infected + saline, saline/infected + OVA and OVA/infected + OVA mice (n = 12, 11, 11 and 13, respectively) and (f) tracing of a electromyographic response to 20-μL-, 40-μL-, 60-μL- and 80-μL-volume colorectal distention in a OVA/infected + OVA mouse at baseline and 7 weeks post-infection. g, VMR to colorectal distention in OVA/infected + OVA (n = 7) and OVA/infected = Saline (n = 7 and 5, respectively) mice at baseline (BL), 7 weeks post-infection (PI) and after 1, 2, 3 and 4 weeks after stopping oral OVA or saline re-exposure, respectively. h, colonic permeability in BALB/c mice expressed as passage of fluorescein sodium (left) and transepithelial resistance (right) in OVA/sham + OVA, saline/infected + OVA, OVA/infected + saline and OVA/infected + OVA mice (n = 8, 11, 12 and 8, respectively) at 7 weeks post-infection. i, scheme illustrating the post-infectious protocol with prior OVA tolerization. j, VMR to colorectal distention in mice OVA-tolerized (high-dose) + saline/infected + OVA, OVA-tolerized (high-dose) + OVA/infected + OVA, OVA-tolerized (low-dose) + saline/infected + OVA and OVA-tolerized (low-dose) + OVA/infected + OVA (n = 6, 9, 6 and 8, respectively). k, l, VMR to colorectal distention in mice OVA/infected repeatedly gavaged with BSA compared to OVA (n = 6 and 10, respectively). m, scheme illustrating the post-infectious protocol in mice treated with anti-IgE antibody. n, VMR to colorectal distention in OVA/infected + OVA mice treated with anti-IgE antibody or control antibody (n = 8/group). o, colonic permeability expressed as passage of fluorescein sodium (left) and transepithelial resistance (right) of (l) VHS mice treated with anti-IgE antibody or control antibody (n = 8/group). p, VMR to colorectal distention in OVA/infected + OVA mice with WT or Igh7-/- background (n = 10/group). q, colonic permeability expressed as passage of fluorescein sodium (left) and transepithelial resistance (right) of OVA/infected + OVA mice with Igh7-/- background or WT mice (n = 10/group) at 7 weeks post-infection. r, scheme illustrating the protocol in mice that received monoclonal OVA-specific IgE antibody. s, VMR to colorectal distention in naïve mice treated with monoclonal OVA-specific IgE antibody or monoclonal Dinitrophenyl (DNP) antibody (n = 7 and 6, respectively). Two-tailed Mann–Whitney test in a and b for every time point, and in o and q (left); two-tailed t-test for q (right). Kruskal-Wallis test (Dunn’s multiple-comparisons test) in c and d. One-way ANOVA (Sidak’s multiple-comparisons test) in h. Two-way repeated ANOVA (Sidak’s multiple-comparisons test) in e, g, j-l, n, p and s. Data shown as Box-and-whiskers (center line, median; box, 25th-75th percentiles; whiskers, 10th-90th percentiles) in a, b and d and median ± IQR in c, e, g, h, j-l, n-q and s. VMR, visceromotor response; BL, baseline; w, week; d; day.
Extended Data Fig. 2
Extended Data Fig. 2. Changes in microbiota composition are not likely to be associated with the development in VHS.
a, changes in the gut microbiome composition over time studied by ordination (PCA) plot before the infection, 10 days after infection (R2 = 0.11, p-value = 0.02), and after OVA gavage (R2 = 0.18, p-value = 0.002) between OVA/infected and saline/infected (n = 8/group) mice. The numbers in brackets indicate the variation explained by each axis (PCA: principal component analysis). b-d, drivers of variation in the murine intestinal community after OVA re-exposure. b, Comparison of mean abundance of taxa between OVA- and saline-infected mice. Bacterial abundances were computed using centered log-ratio transformation (CLR; two-sided Mann–Whitney test, FDR < 0.2). c, ordination biplot of PCA analysis showing the significant contributors in the community variation. Arrows indicate the relative importance of each genus (permutation-based p < 0.05). d, abundance of genus Robinsoniella, Eisenbergiella, Senegalimassilia, Murimonas, Clostridium_XVIII and Stomatobaculum by group and VHS (two-sided Mann-Whitney test, FDR > 0.1). e, scheme illustrating the post-infectious protocol in mice treated with antibiotics. f, g, VMR to colorectal distention in VHS (OVA/infected + OVA) mice treated with antibiotics or control, and compared to OVA/infected + saline mice (n = 10, 7 and 6, respectively) (g depicts the VMM response at 7 weeks post-infection). In d, VHS threshold was established based on the 95th percentile of visceromotor responses at baseline (AUC > 4.8). There was no significant association between VHS and bacterial abundance in any group (two-tailed Mann-Whitney test). X-axis indicates absence (0) and presence (1) of VHS. Two-way ANOVA 9(Sidak’s multiple-comparisons test) in f and g. Data shown as box-and-whiskers ± 1.5 IQR in d and as median ± IQR in f and g. VMR, visceromotor response; BL, baseline; w, week.
Extended Data Fig. 3
Extended Data Fig. 3. Analysis of ‘low grade’ inflammation in colonic samples of post-infectious mice.
a, Representative H&E-stained colonic sections from OVA/sham + OVA, OVA/infected + saline, saline/infected + OVA and OVA/infected + OVA at 7 weeks post-infection. b, thickness of the colonic muscularis (left), length of the crypts (middle) and distance between crypts (right), measured in OVA/sham + OVA, saline/infected + OVA (n = 6), OVA/infected + saline and OVA/infected + OVA mice (n = 8, 6, 8 and 8, respectively) at 7 weeks post-infection. c-k, concentration of (c) IFN-γ, (d) TNF-α, (e) IL-6, (f) KC (murine IL-8 homologue), (g) MCP-1, (h) IL-17A, (i) IL-13, (j) IL-4 and (k) IL-10 assessed in colonic supernatant and (l) IL-13 and (m) IL-5 in colon-draining lymph nodes (coMLN) of OVA/sham + OVA, saline/infected + OVA, OVA/infected + saline and OVA/infected + OVA mice (n = 8, 11, 12 and 8, respectively, for c-k; n = 7, 7, 9 and 9, respectively for l and m). n-q, immune cell quantification along the intestinal tract: (n and p) gating strategy; (o) quantification of population of CD11b+Ly6G+SiglecF- neutrophils, CD11b+SiglecF+ eosinophils, CD117+FcRεI+ mast cells, CD3+ T cells, CD3+CD4+ T cells, CD3+CD4+Foxp3+ T cells and (q) Helios- Nrp1loFOXP3+ pTregs in the colon and small intestine in OVA/sham + OVA, saline/infected + OVA, OVA/infected + saline and OVA/infected + OVA mice (n = 7, 6, 7 and 7, respectively, for o (colon); 9, 8, 9 and 10, respectively, for o (small intestine); 9, 9, 8 and 10, respectively, for q (Helios-Nrp1loFOXP3+ pTregs in colon); 9, 9, 8 and 10, respectively, for q (Helios-Nrp1loFOXP3+ pTregs in small intestine);. One-way ANOVA (Sidak’s multiple-comparisons test) in b-m, o and q. Data shown median ± IQR in b-m, o and q.
Extended Data Fig. 4
Extended Data Fig. 4. Extended analysis of mast cell activation as key players in the development of OVA-induced VHS in post-infectious mice.
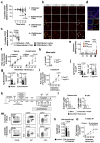
a-c, avidin-fluorescence intensity over time (expressed as TCCF) in MC from OVA/sham + OVA, saline/infected + OVA OVA/infected + saline and OVA/infected + OVA mice (n = 222 [7 mice], 145 [6 mice], 202 [8 mice] and 239 [9 mice], respectively), (a) shown as percentage at times = 0, 7, 14, 21 and 28 min, (b) micrographs and (c) shown at time = 28 min as median per mouse. In b, arrows point to representative MC showing degranulation (yellow, 28 min) compared to baseline (white, 0 min). d, representative image of double-staining using DAPI and avidin in fixed colonic tissue from healthy mice (n = 3). e, Histamine quantification in supernatant collected from OVA/sham + OVA, saline/infected + OVA, OVA/infected + saline and OVA/infected + OVA (n = 10/group) at 7 weeks post-infection. f, VMR to colorectal distention in OVA/infected + OVA mice (d) treated with doxantrazole or vehicle (n = 14 and 11, respectively). g, colonic permeability expressed as passage of fluorescein sodium (left) and transepithelial electrical resistance (right) of OVA/infected + OVA mice treated with doxantrazole or vehicle (n = 8/group) at 8 weeks post-infection. h, quantification of population of CD117+FcRεI+ mast cells in intestinal lamina propria from Cpa3Cre/+ and WT mice (n = 3/group). i, VMR to colorectal distention in OVA/infected + OVA mice with Cpa3Cre/+ background or WT littermates (n = 13 and 12, respectively). j, colonic permeability expressed as passage of fluorescein sodium (left) and transepithelial electrical resistance (right) in OVA/infected + OVA mice with Cpa3Cre /+ background or WT littermates (n = 12/group) at 9 weeks post-infection. k, scheme illustrating the post-infectious protocol in mice treated with anti-CD20 antibody and bortezomib. l, anti-CD20 (5D2 clone) antibody and bortezomib depleted CD19+ Ly6K+ plasma cells (left) and B220+ IgM+ B cells (right) from the colon of mice compared to control antibody/vehicle and naïve mice (n = 2, 1 and 4, respectively) and (m) gating strategy used to validate B cell and plasma cell depletion. n, quantification of OVA-specific IgE in colon samples homogenates from OVA/infected + OVA mice treated with anti-CD20 antibody and bortezomib or control antibody and vehicle (n = 12 and 9, respectively). o, VMR to colorectal distention in OVA/infected + OVA mice treated with anti-CD20 antibody/bortezomib or control antibody/vehicle (n = 3 and 4, respectively). Mixed-effects model (Dunnett’s multiple-comparisons test) in a and e. One-way ANOVA (Sidak’s multiple-comparisons test) in c. two-way repeated measures ANOVA (Sidak’s multiple-comparisons test) in f, I and o. Two-tailed Mann-Whitney in g, h, j and n. Data are shown as median ± IQR in a, e-j, l, n and o, and box-and-whiskers (center line, median; box, 25th and 75th percentiles; whiskers, 10th and 90th percentiles) in c. VMR, visceromotor response; BL, baseline; w, week.
Extended Data Fig. 5
Extended Data Fig. 5. H1R mediates OVA-induced VHS in post-infectious mice.
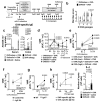
a, representative tracing and Fura-2 ratiometric fields of DRG neurons (TRPV1+ neuron [right] indicated by arrowhead). b, c, VMR to colorectal distention in OVA/infected + OVA mice (a) treated with vehicle and pyrilamine (n = 9 and 8, respectively) and (b) with WT and Hrh1-/- background (n = 13 and 9, respectively). Two-way repeated measures ANOVA (Sidak’s multiple-comparisons test) in b and c. Data are shown as median ± IQR.
Extended Data Fig. 6
Extended Data Fig. 6. SEB induces MC-mediated OVA-induced VHS upon comparable to C. rodentium infection.
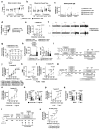
a, scheme illustrating the SEB protocol. b, VMR to colorectal distention in saline/SEB + OVA, OVA/SEB + OVA and OVA (low dose) + OVA/SEB + OVA mice (n = 10, 14 and 4, respectively). c, colonic permeability expressed as passage of fluorescein sodium (left) and transepithelial electrical resistance (right) of saline/SEB + OVA and OVA/SEB + OVA (n = 8 and 7, respectively) mice. d, heat-map of the gene expression of inflammatory genes and mast-cell-related genes in OVA/saline + OVA (a), saline/SEB + OVA (b) and OVA/SEB + OVA mice (c) (n = 21, 7 and 7, respectively; except for Tryptase α/β-1: n = 7/group). e, VMR to colorectal distention in SEB-VHS mice treated with doxantrazole or vehicle (n = 8 and 9, respectively). f, colonic permeability expressed as passage of fluorescein sodium (left) and transepithelial electrical resistance (right) of SEB-VHS mice treated with doxantrazole or vehicle (n = 8 and 7, respectively). g, VMR to colorectal distention in OVA/SEB + OVA mice with Cpa3Cre/+ background or WT littermates (n = 5 and 6, respectively). h, colonic permeability expressed as passage of fluorescein sodium (left) and transepithelial electrical resistance (right) of OVA/SEB + OVA mice with Cpa3Cre/+ background or WT littermates (n = 5 and 6, respectively). i, quantification of OVA-specific IgE in colon homogenates of saline/SEB + OVA and OVA/SEB + OVA mice (n = 8 and 7, respectively). j, ear-swelling after intradermal injection of OVA in saline/SEB + OVA, OVA/SEB + OVA and OVA-allergy mice (n = 9, 7 and 6, respectively) mice. k, % of HV and IBS patients (n = 64 and 84, respectively) positive for S. aureus (left) and SAg-encoding S. aureus (right) in fecal samples. Numbers below the bars represent the ratio of positive and total HV and patients. Two-way repeated ANOVA (Sidak’s multiple-comparisons test) in b, e and g. Two-tailed unpaired t-test in c and f. Two-tailed Mann-Whitney test in h and i. Kruskal-Wallis test (Dunn’s multiple-comparisons test) in d and j. Two-sided Fisher’s exact test in k. Data shown as median ± IQR in b, e-i and box-and-whiskers (center line, median; box, 25th-75th percentiles; whiskers, 10th-90th percentiles) in j. VMR, visceromotor response; BL, baseline; w, week. In d, Tpsab1, Il4, Il6 and Il10 gene expression differences were statistically significant in OVA/SEB + OVA vs. OVA/saline + OVA (adjusted p = 0.0005, 0.0004, 0.0163 and 0.0039, respectively).
Extended Data Fig. 7
Extended Data Fig. 7. Extended analysis of mast cells and IgE in human samples.
a, measurement of trypsin-like activity in supernatants of rectal biopsies from HV and IBS patients (n = 13 and 48, respectively) in basal conditions. b, c, number of (a) MC (CD117+) and (b) IgE+-MC (CD117+ IgE+) quantified in mucosal rectal biopsies from HV and IBS patients (n = 15 and 22, respectively). d, quantification of CD117+ IgE+ cells (MC) at ≤5 μm from nerve fibers (β tubulin III+ cells) in HV and IBS patients (n = 15 and 17, respectively). e, correlation between the IgE TCCF and max mucosal diameter after food-antigen injection in IBS patients (n = 7). f, number of IgE+ clones was quantified in mucosal rectal biopsies cDNA from HV and IBS patients (n = 10 and 20, respectively) using deep sequencing. Two-tailed Mann-Whitney test in a-d and f. two-tailed Pearson’s correlation in e. Data are shown as median ± IQR in a-d, and as box-and-whiskers (center line, median; box, 25th and 75th percentiles; whiskers, 10th and 90th percentiles) in f. HPF = high power field.
Extended Data Fig. 8
Extended Data Fig. 8. Graphical representation of the mechanism proposed: Local immune response to dietary antigens triggered by bacterial infection leads to food-induced abdominal pain.
Bacterial infection (or bacterial toxins, SEB) can trigger break of oral tolerance to food antigens leading to food-induced VHS upon food-antigen re-exposure. OVA-specific IgE antibodies bind to and sensitizes tissue-resident mast cells, which are activated upon re-exposure to OVA during feeding and release mediators that sensitize afferent neurons via H1R-mediated pathway.
Fig. 1
Fig. 1. OVA-specific immune response and VHS in post-infectious mice.
a, Experimental protocol. b, Diarrhea score in OVA/sham + OVA and OVA/infected + OVA mice (n = 6 and 8, respectively). c, Quantification of OVA-specific IgE in serum (left) and colon homogenates (right) of OVA/sham + OVA, saline/infected + OVA, OVA/infected + saline, OVA/infected + OVA and OVA-allergy mice (serum: n = 9, 10, 10, 9 and 8, respectively; colon: n = 9, 6, 9, 9 and 7, respectively). d-h, VMR to colorectal distention in (d) OVA/sham + OVA, OVA/infected + saline, saline/infected + OVA and OVA/infected + OVA mice (n = 12, 11, 11 and 13, respectively); (e) mice OVA-tolerized (high-dose) + saline/infected + OVA, OVA-tolerized (high-dose) + OVA/infected + OVA, OVA-tolerized (low-dose) + saline/infected + OVA and OVA-tolerized (low-dose) + OVA/infected + OVA (n = 6, 9, 6 and 8, respectively); (f) OVA/infected + OVA mice treated with anti-IgE antibody or control antibody (n = 8/group); (g); OVA/infected + OVA mice with WT or Igh7-/- background (n = 10/group); (h) and naïve mice treated with monoclonal OVA-specific IgE antibody or monoclonal Dinitrophenyl (DNP) antibody (n = 7 and 6, respectively). i, mIL-4-forming cells in coMLN from saline/infected + OVA, OVA/infected + OVA and OVA/infected + OVA mice (n = 8/group). Two-tailed Mann-Whitney test in b; Kruskal-Wallis test (Dunn’s multiple-comparisons test) in c and i; two-way repeated ANOVA (Sidak’s multiple-comparisons test) in d-h. Data shown as violin plots in b and median ± IQR in c-i. VMR, visceromotor response; BL, baseline; w, week.
Fig. 2
Fig. 2. Mast cells play a key role in the development of OVA-induced VHS.
a, Relative gene expression in colon samples from OVA/sham + OVA (a), saline/infected + OVA (b), OVA/infected + saline (c) and OVA/infected + OVA (d) (n = 21, 11, 11 and 21, respectively [except for Tpsab1: n = 7, 5, 7 and 8, respectively; and Il13: n = 7, 9, 7 and 8, respectively]). b, c, MC-degranulation in OVA/sham + OVA, saline/infected + OVA, OVA/infected + saline and OVA/infected + OVA mice measured as (b) % of avidin-fluorescence intensity (TCCF) relative to baseline time = 28 min (n = 222 [7 mice], 145 [6 mice], 202 [8 mice] and 239 [9 mice], respectively) and (c) % of total degranulated MC. d-f, VMR to colorectal distention in OVA/infected + OVA mice (d) treated with doxantrazole or vehicle (n = 14 and 11, respectively), (e) with Cpa3Cre/+ background or WT littermates (n = 13 and 10, respectively) and (f) treated with anti-CD20 antibody/bortezomib or control antibody/vehicle (n = 3 and 4, respectively). One-way ANOVA (Sidak’s multiple-comparisons test) in a; Kruskal-Wallis test (Sidak’s multiple-comparisons test) in b and c; two-way repeated ANOVA (Sidak’s multiple-comparisons test) in d-f. Data shown as Box-and-whiskers (center line, median; box, 25th-75th percentiles; whiskers, 10th-90th percentiles; dots depict outliers) in b, and as median ± IQR in c-f. In a, Tpsab1 expression was statistically significant in OVA/infected + saline and OVA/infected + OVA vs. OVA/sham + OVA (adjusted p = 0.0173 and 0.0014, respectively).
Fig. 3
Fig. 3. H1R-mediated nociceptive neuron sensitization drives OVA-induced VHS.
a, afferent nerve recording in naïve, OVA/infected + saline and OVA/infected + OVA mice (n = 5, 6 and 8, respectively). b, rheobase (up) and action potential (AP) number at 2x the rheobase (down) in DRG neurons incubated with supernatants from OVA/sham + OVA, saline/infected + OVA and OVA/infected + OVA mice (n = 20 [5 supernatants], 18 [6 supernatants] and 19 [5 supernatants], respectively). c, ratiometric Ca2+ response (left) and % cells responding to 10-nM capsaicin (right) in DRG neurons incubated with RPMI, histamine, supernatants from OVA/infected + saline and OVA/infected + OVA mice (n = 85 [5 supernatants], 59 [6 supernatants], 123 [12 supernatants] and 82 [11 supernatants], respectively). d, e, (d) rheobase (left) and action potential number at 2x the rheobase (right) (n = 19 neurons [4 supernatants] and 20 neurons [5 supernatants], respectively) and (e) ratiometric Ca2+ response (left) and % cells responding to 10-nM capsaicin (right) (n = 65 [12 supernatants], 87 [11 supernatants], 51 [3 supernatants] and 100 [8 supernatants], respectively) in DRG neurons incubated with supernatants from VHS mice with vehicle or pyrilamine and (only in e) comparing WT and Hrh1-/-. f, g, VMR to colorectal distention in OVA/infected + OVA mice (f) treated with vehicle or pyrilamine (n = 9 and 8, respectively) and (g) with WT or Hrh1-/- background (n = 13 and 9, respectively). One-way ANOVA (Sidak’s multiple-comparisons test) in a and b; Kruskal-Wallis test (Dunn’s multiple-comparison test) in c (left); two-tailed Fisher’s exact test in c (right) and e (right); two-tailed t-test in d, two-tailed Mann-Whitney test in e (left); two-way repeated measures ANOVA (Sidak’s multiple-comparisons test) in f and g. Data shown as median ± IQR in a, f and g, as Box-and-whiskers (center line, median; box, 25th-75th percentiles; whiskers, 10th-90th percentiles) for b (up), c (left), d (left) and e (left) and as violin plots (center line, median) in b (down), d (right). SN, supernatant.
Fig. 4
Fig. 4. Intramucosal injection of food antigens induces an immediate mucosal response in IBS patients.
a, representative images (arrows, antigen injection site; arrow-heads, reaction area) and (b) diameter reaction to food antigen injection in HV and IBS patients (n = 8 and 12, respectively) (dotted line represents the threshold for positive reactions). c, trypsin-like activity in rectal biopsies supernatants after antigen injection in IBS patients (n = 8). d, micrographs used to measure (e) IgE+ MC-nerve fibers distance in HV (n = 15 subjects [left], 206 cells [right]) and IBS patients (n = 17 subjects [left], 296 cells [right]). f, correlation between the IgE+ MC-nerve fibers distance and abdominal pain severity in IBS patients (n = 17). g, micrographs used to quantify (h) IgE intensity (TCCF) in MC in mucosal rectal biopsies from HV (n = 15 subjects [left], 261 cells [right]) and IBS patients (n = 22 subjects [left], 315 cells [right]). i, correlation between the IgE TCCF and abdominal pain severity in IBS patients (n = 22). Two-tailed Mann-Whitney test in b, e and h; two-way ANOVA (Sidak’s multiple-comparisons test) in c; two-tailed Spearman’s and Pearson’s correlation in f and i, respectively. Data represented as individual dots and median in b and median ± IQR in e and h left panels. e and h right panes show Box-and-whiskers (center line, median; box, 25th-75th percentiles; whiskers, 10th-90th percentiles).

Comment in

Similar articles

Cited by

References

    1. Schäfer T, et al. Epidemiology of food allergy/food intolerance in adults: Associations with other manifestations of atopy. Allergy Eur J Allergy Clin Immunol. 2001;56:1172–1179. - PubMed
    1. Honda K, Littman DR. The microbiota in adaptive immune homeostasis and disease. Nature. 2016;535:75–84. - PubMed
    1. Mowat AMI. Anatomical basis of tolerance and immunity to intestinal antigens. Nature Reviews Immunology. 2003;3:331–341. - PubMed
    1. Bouziat R, et al. Reovirus infection triggers inflammatory responses to dietary antigens and development of celiac disease. Science (80-) 2017;356:44–50. - PMC - PubMed
    1. Spiller R, Garsed K. Postinfectious irritable bowel syndrome. Gastroenterology. 2009;136:1979–1988. - PubMed

Publication types

MeSH terms