. 2021 Feb;590(7845):338-343.
doi: 10.1038/s41586-020-03121-7. Epub 2021 Jan 13.

Loop extrusion mediates physiological Igh locus contraction for RAG scanning

Affiliations

Loop extrusion mediates physiological Igh locus contraction for RAG scanning

Hai-Qiang Dai et al. Nature. 2021 Feb.

Abstract

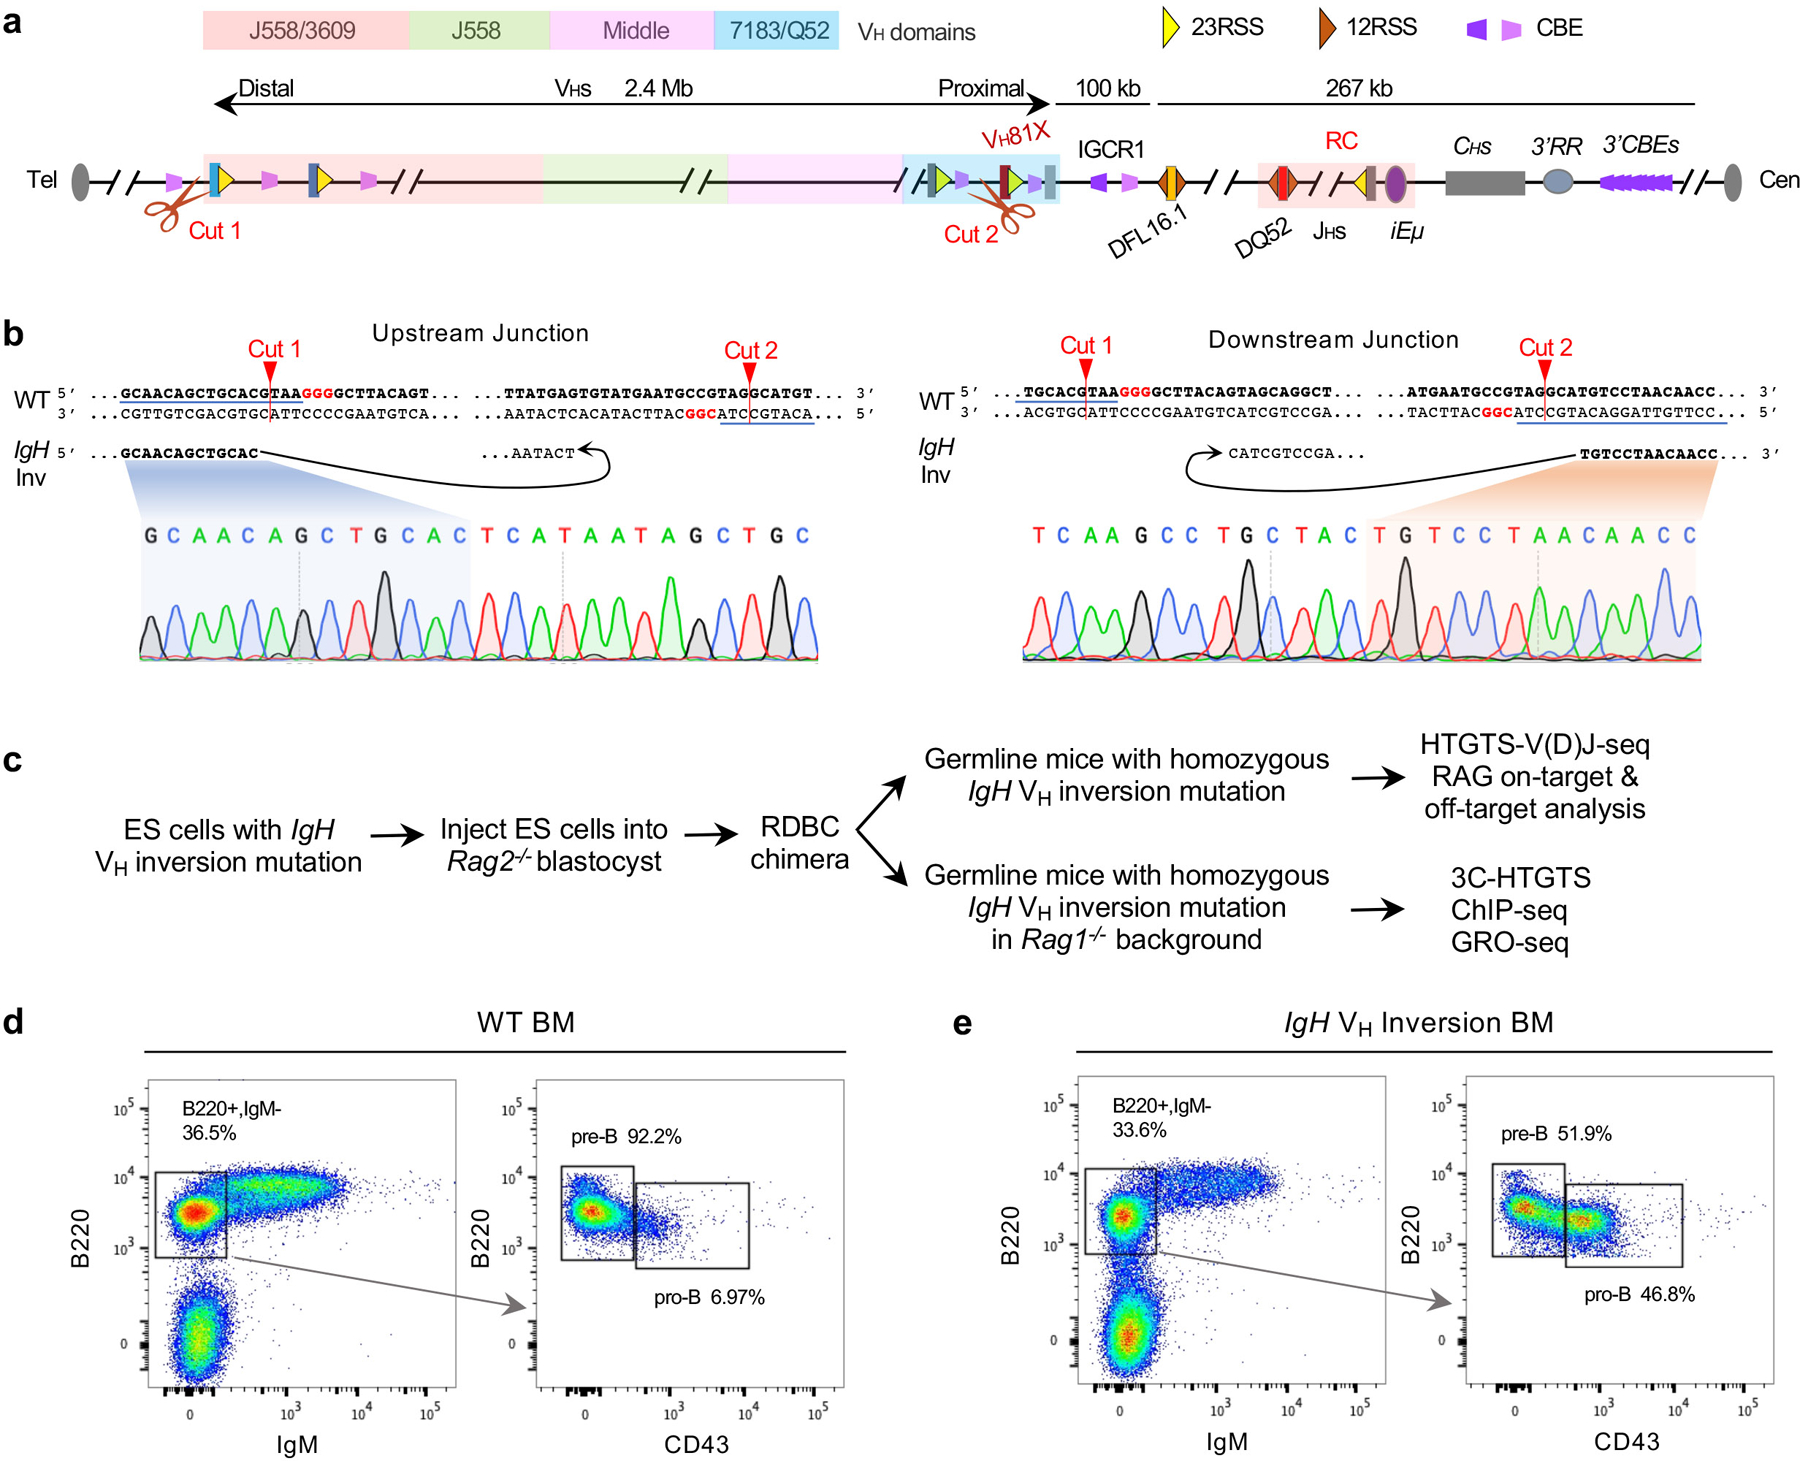
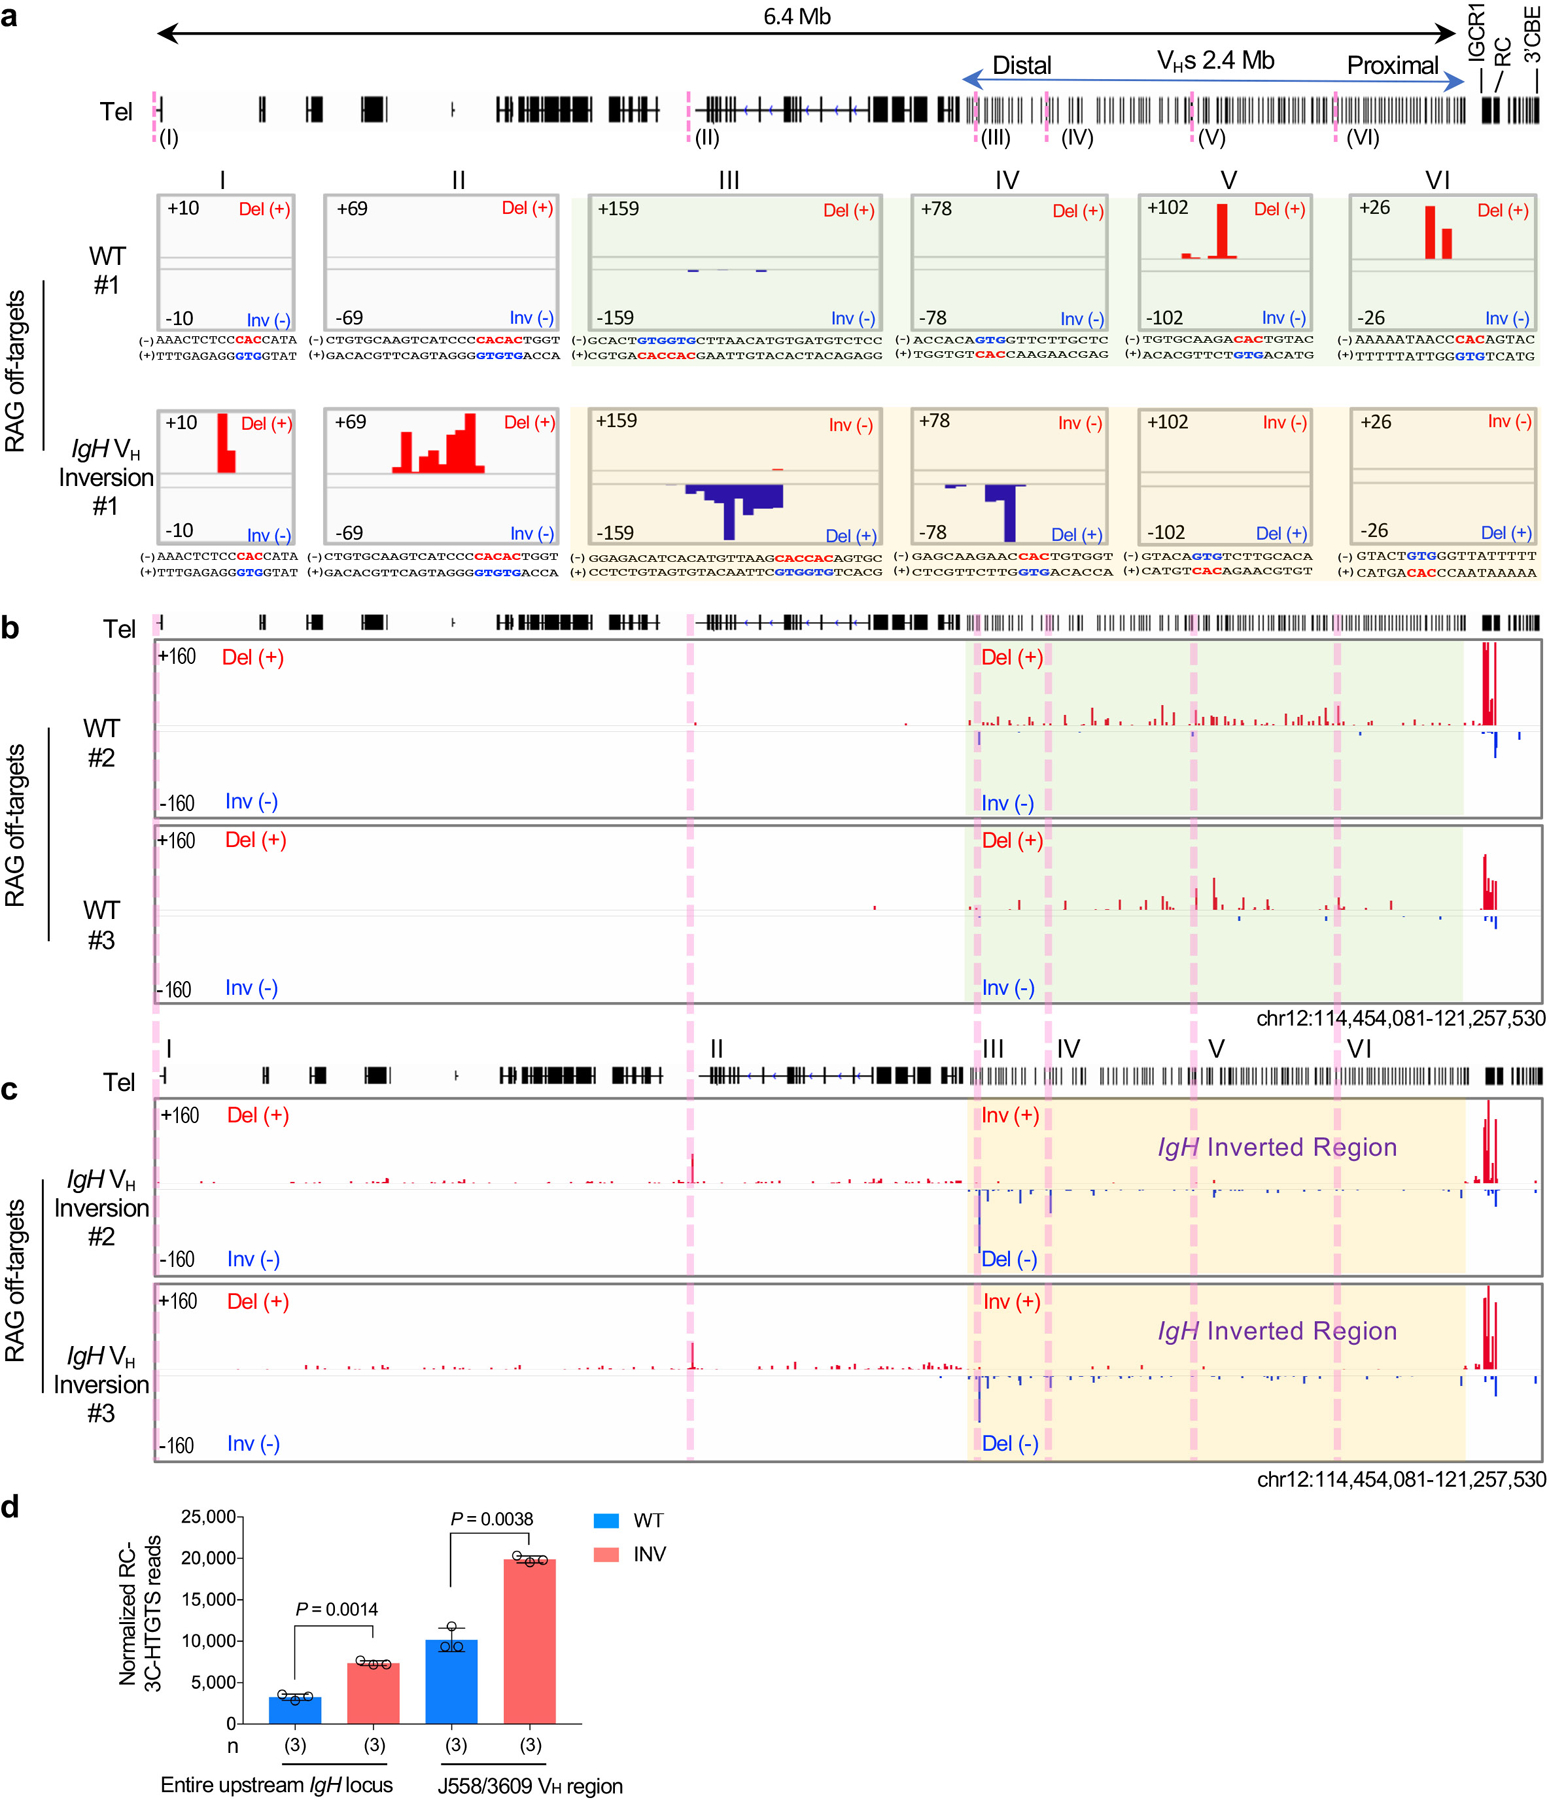
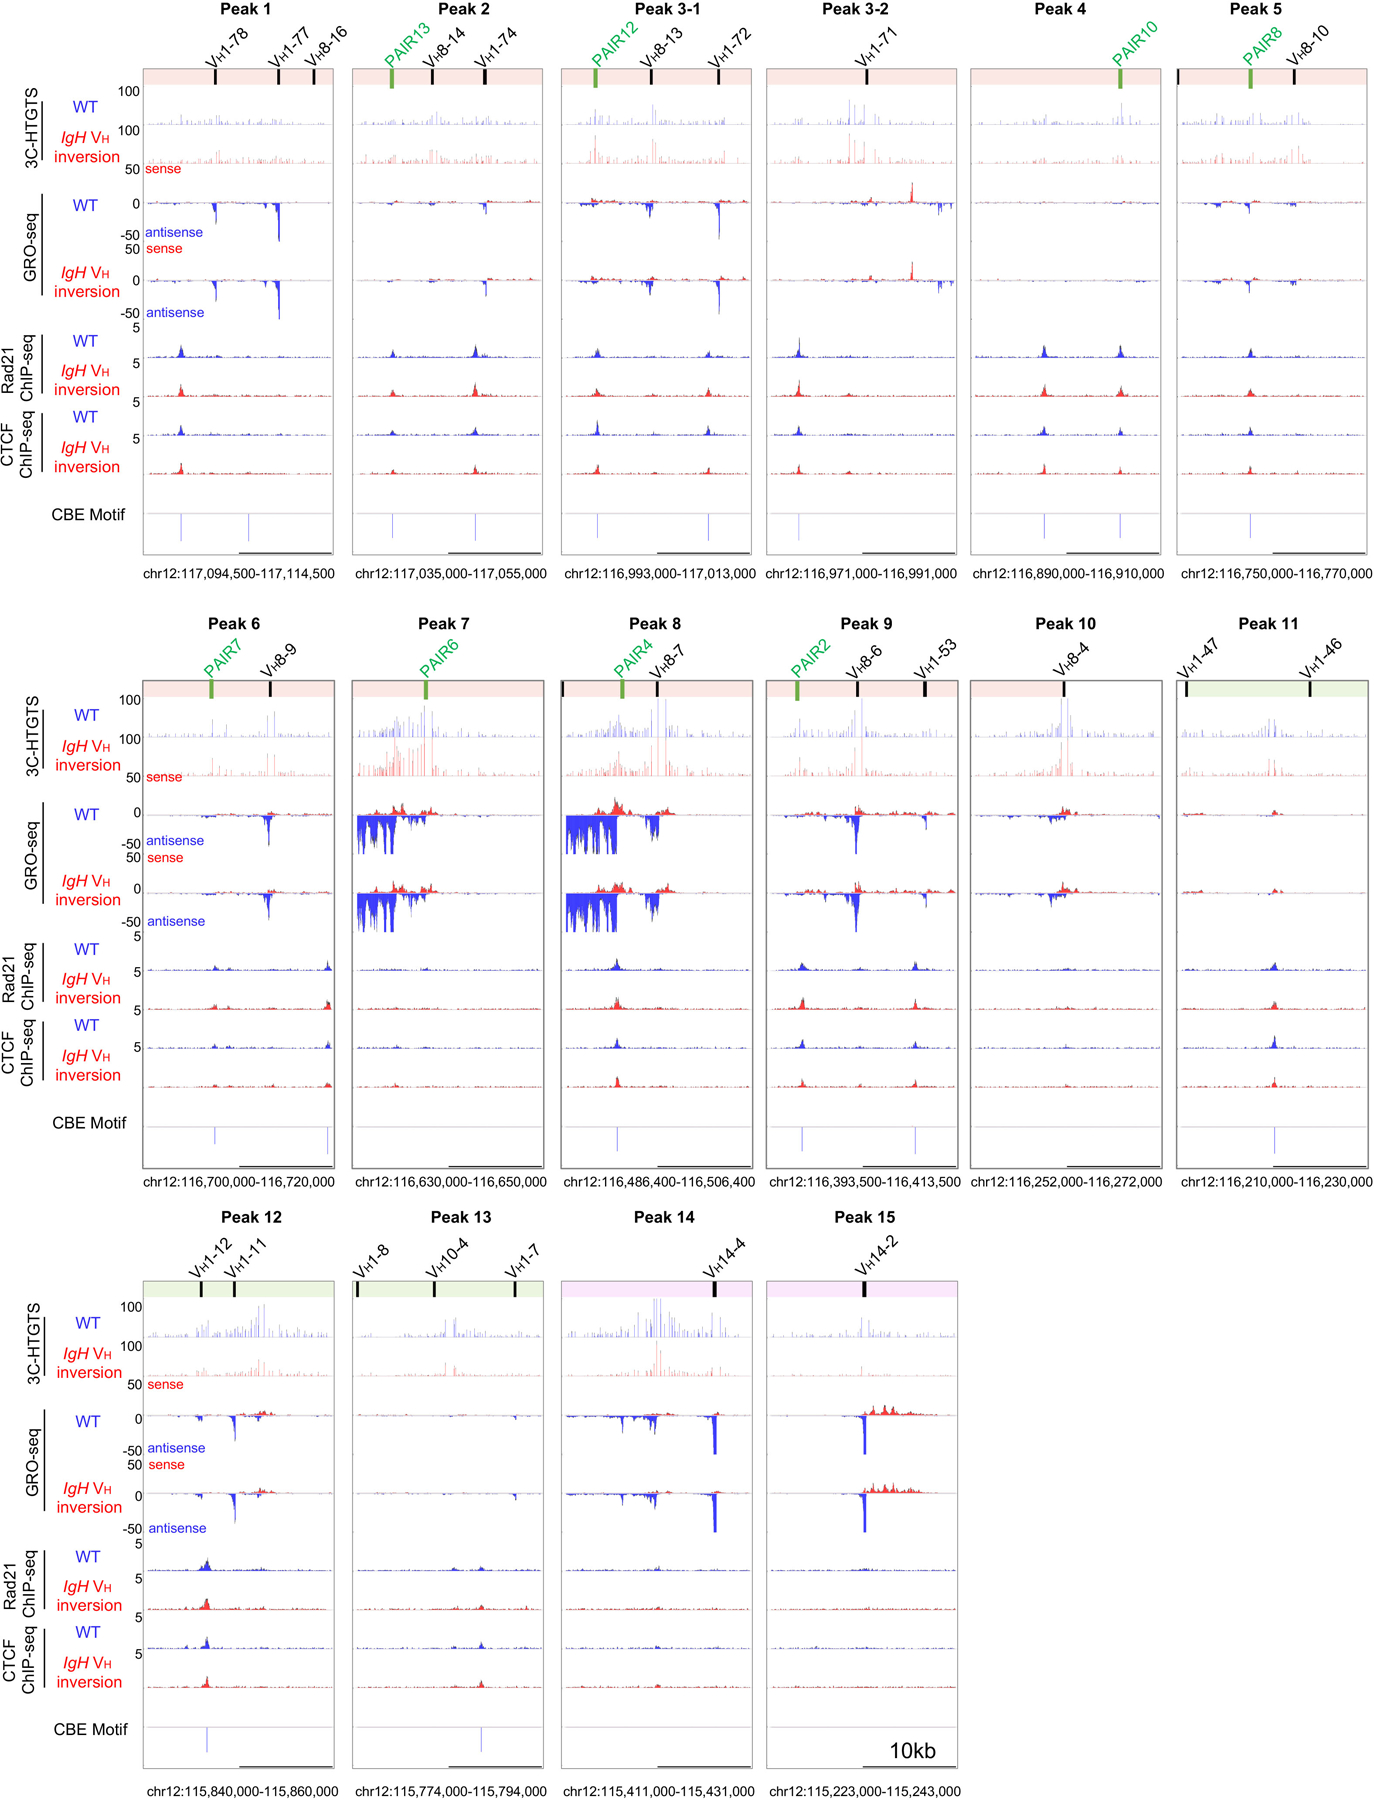
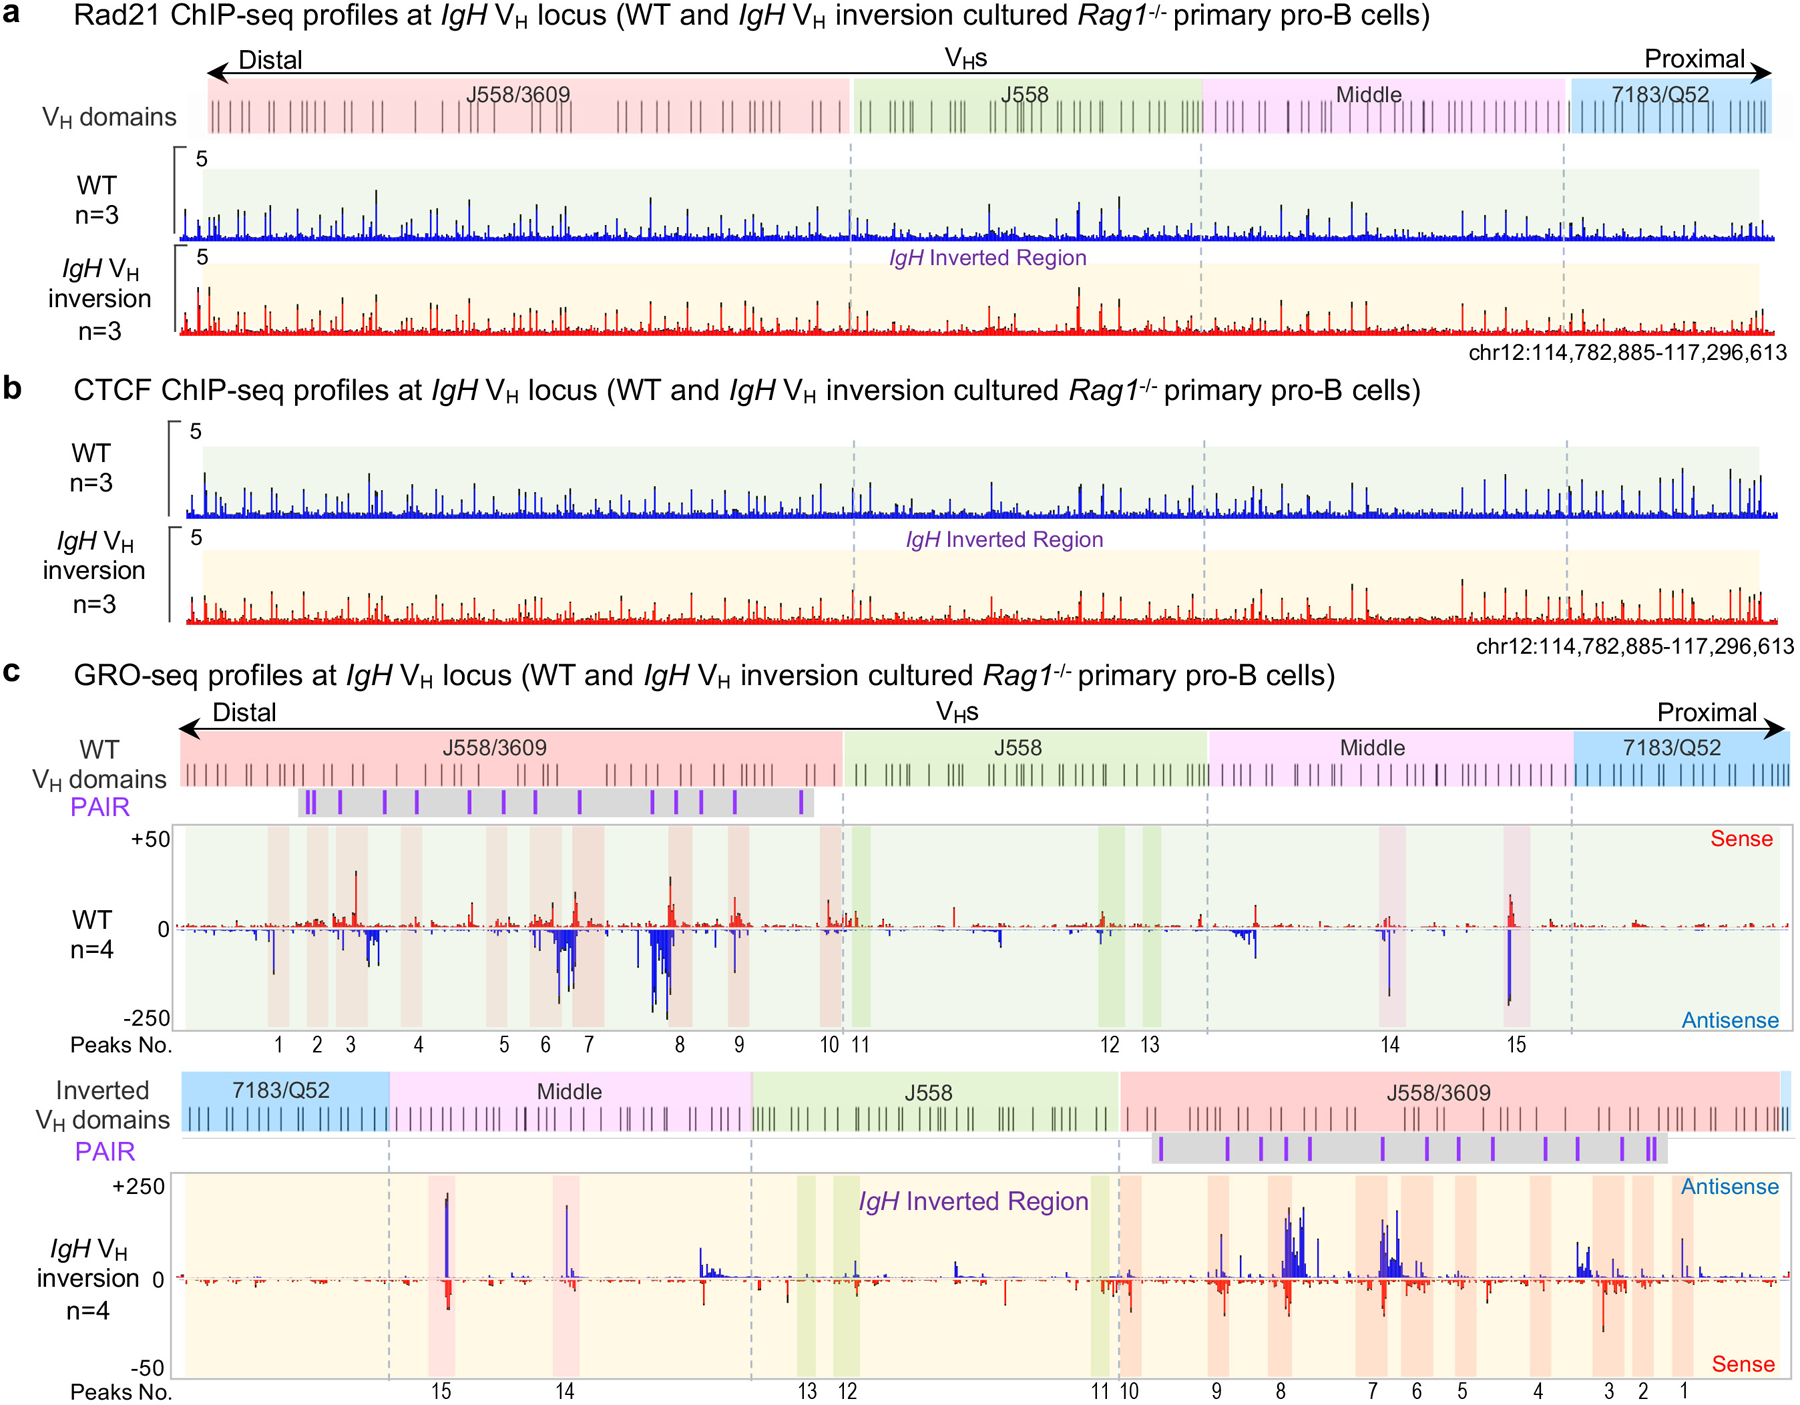
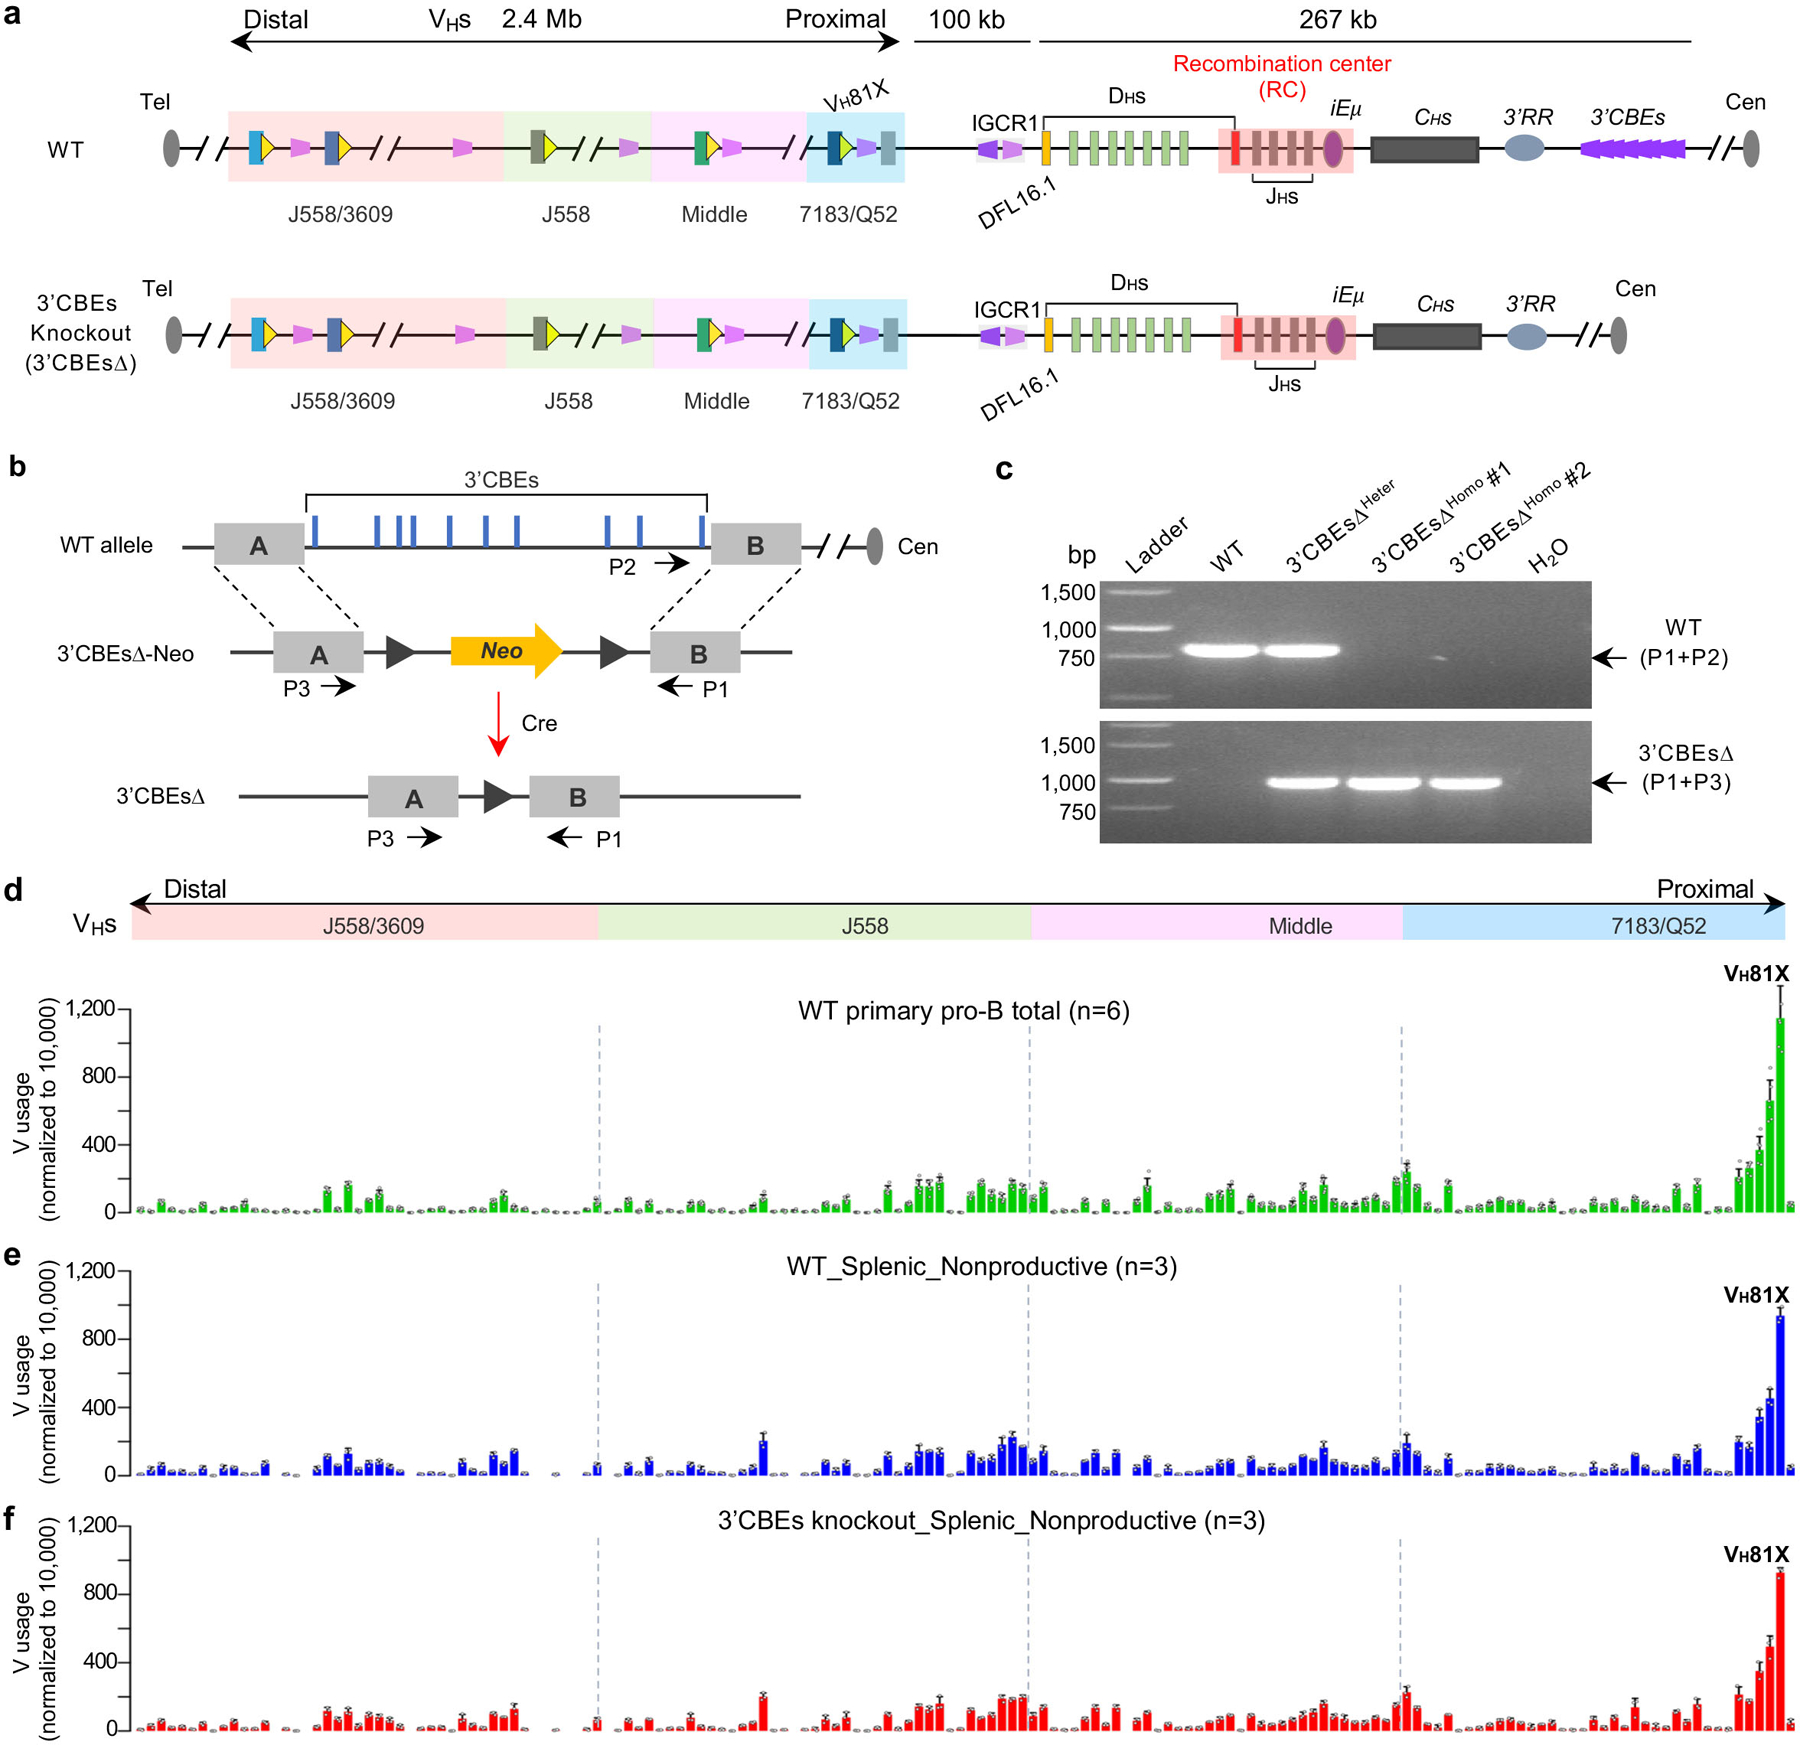
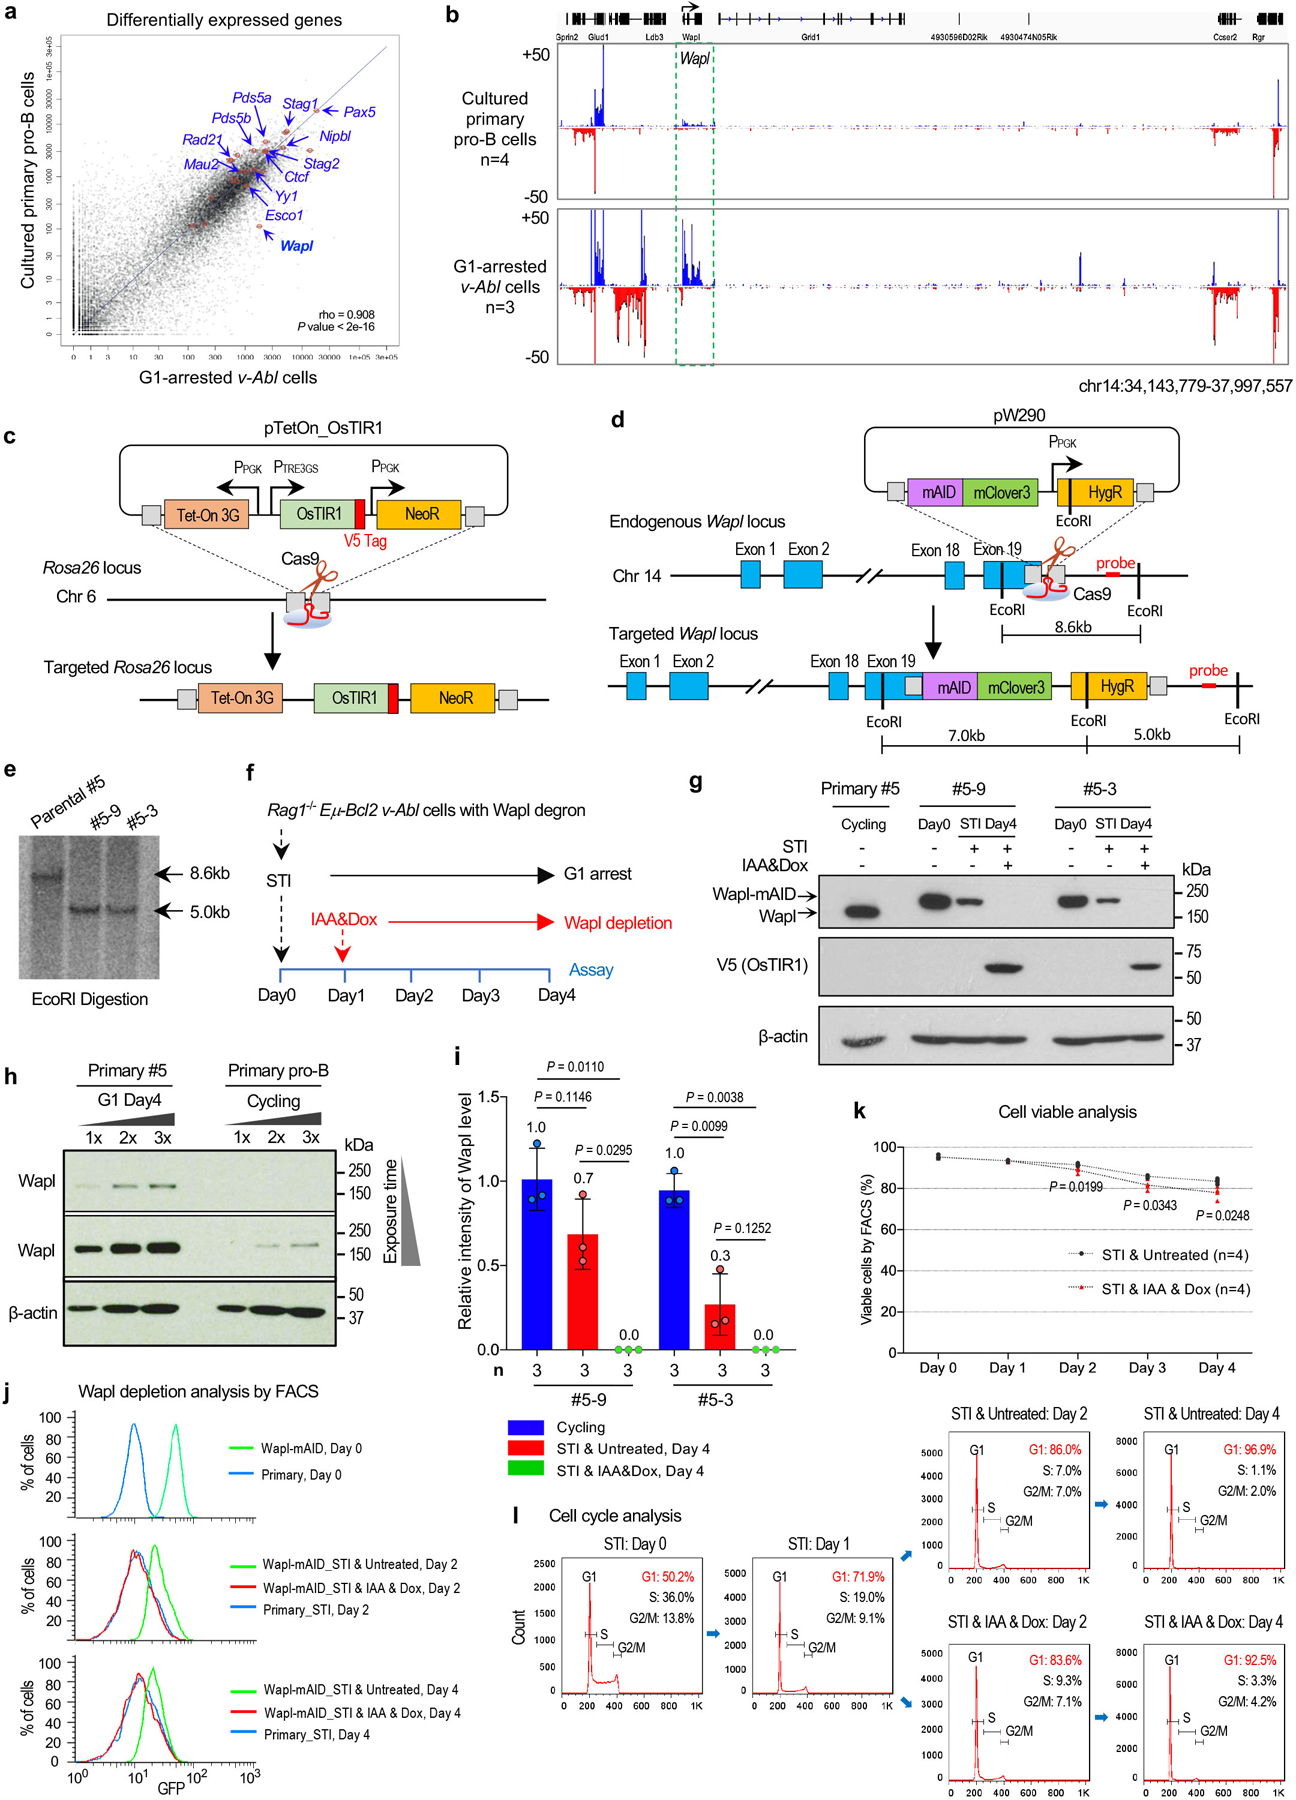
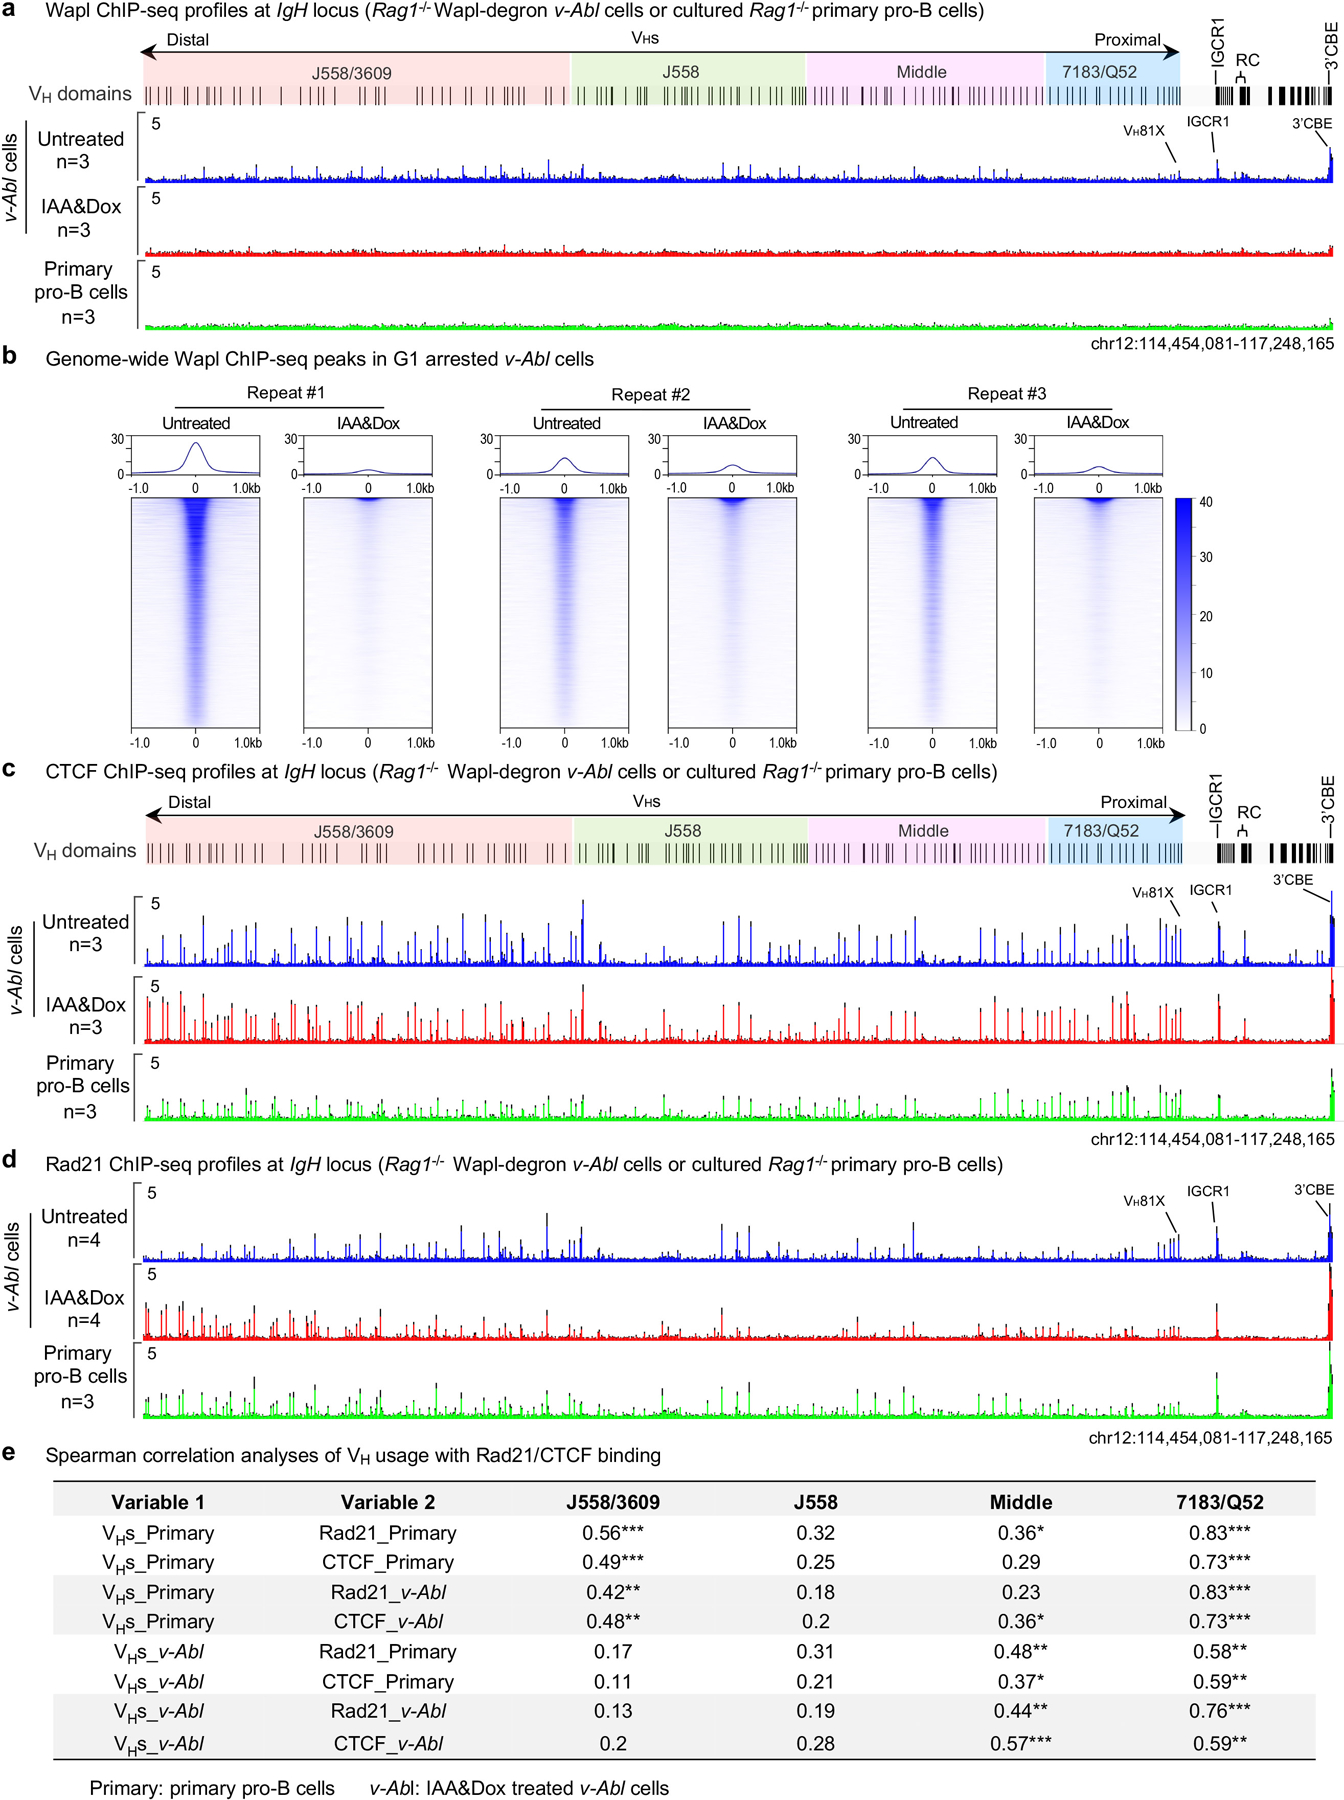
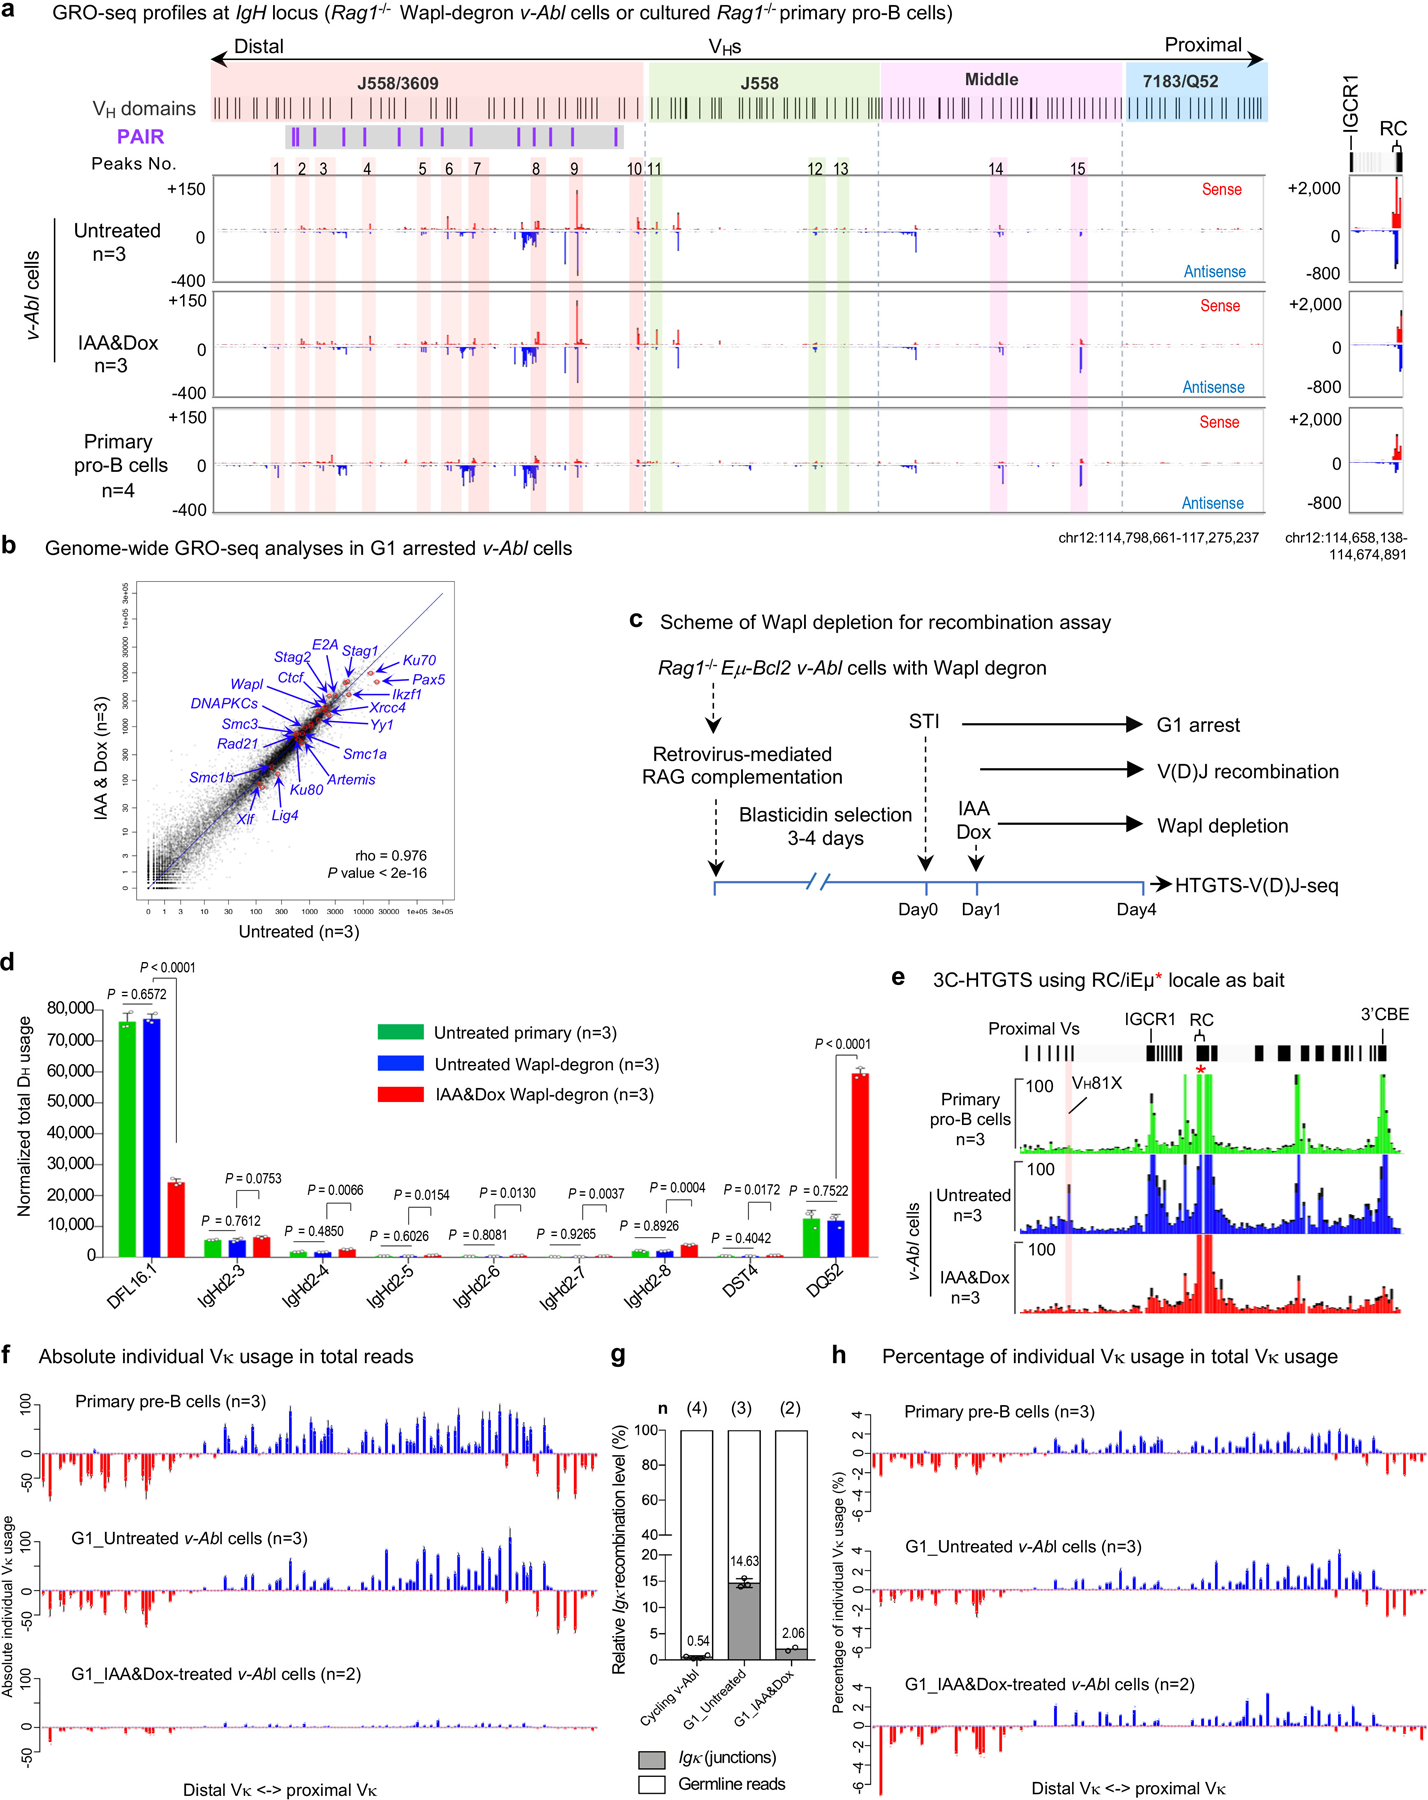
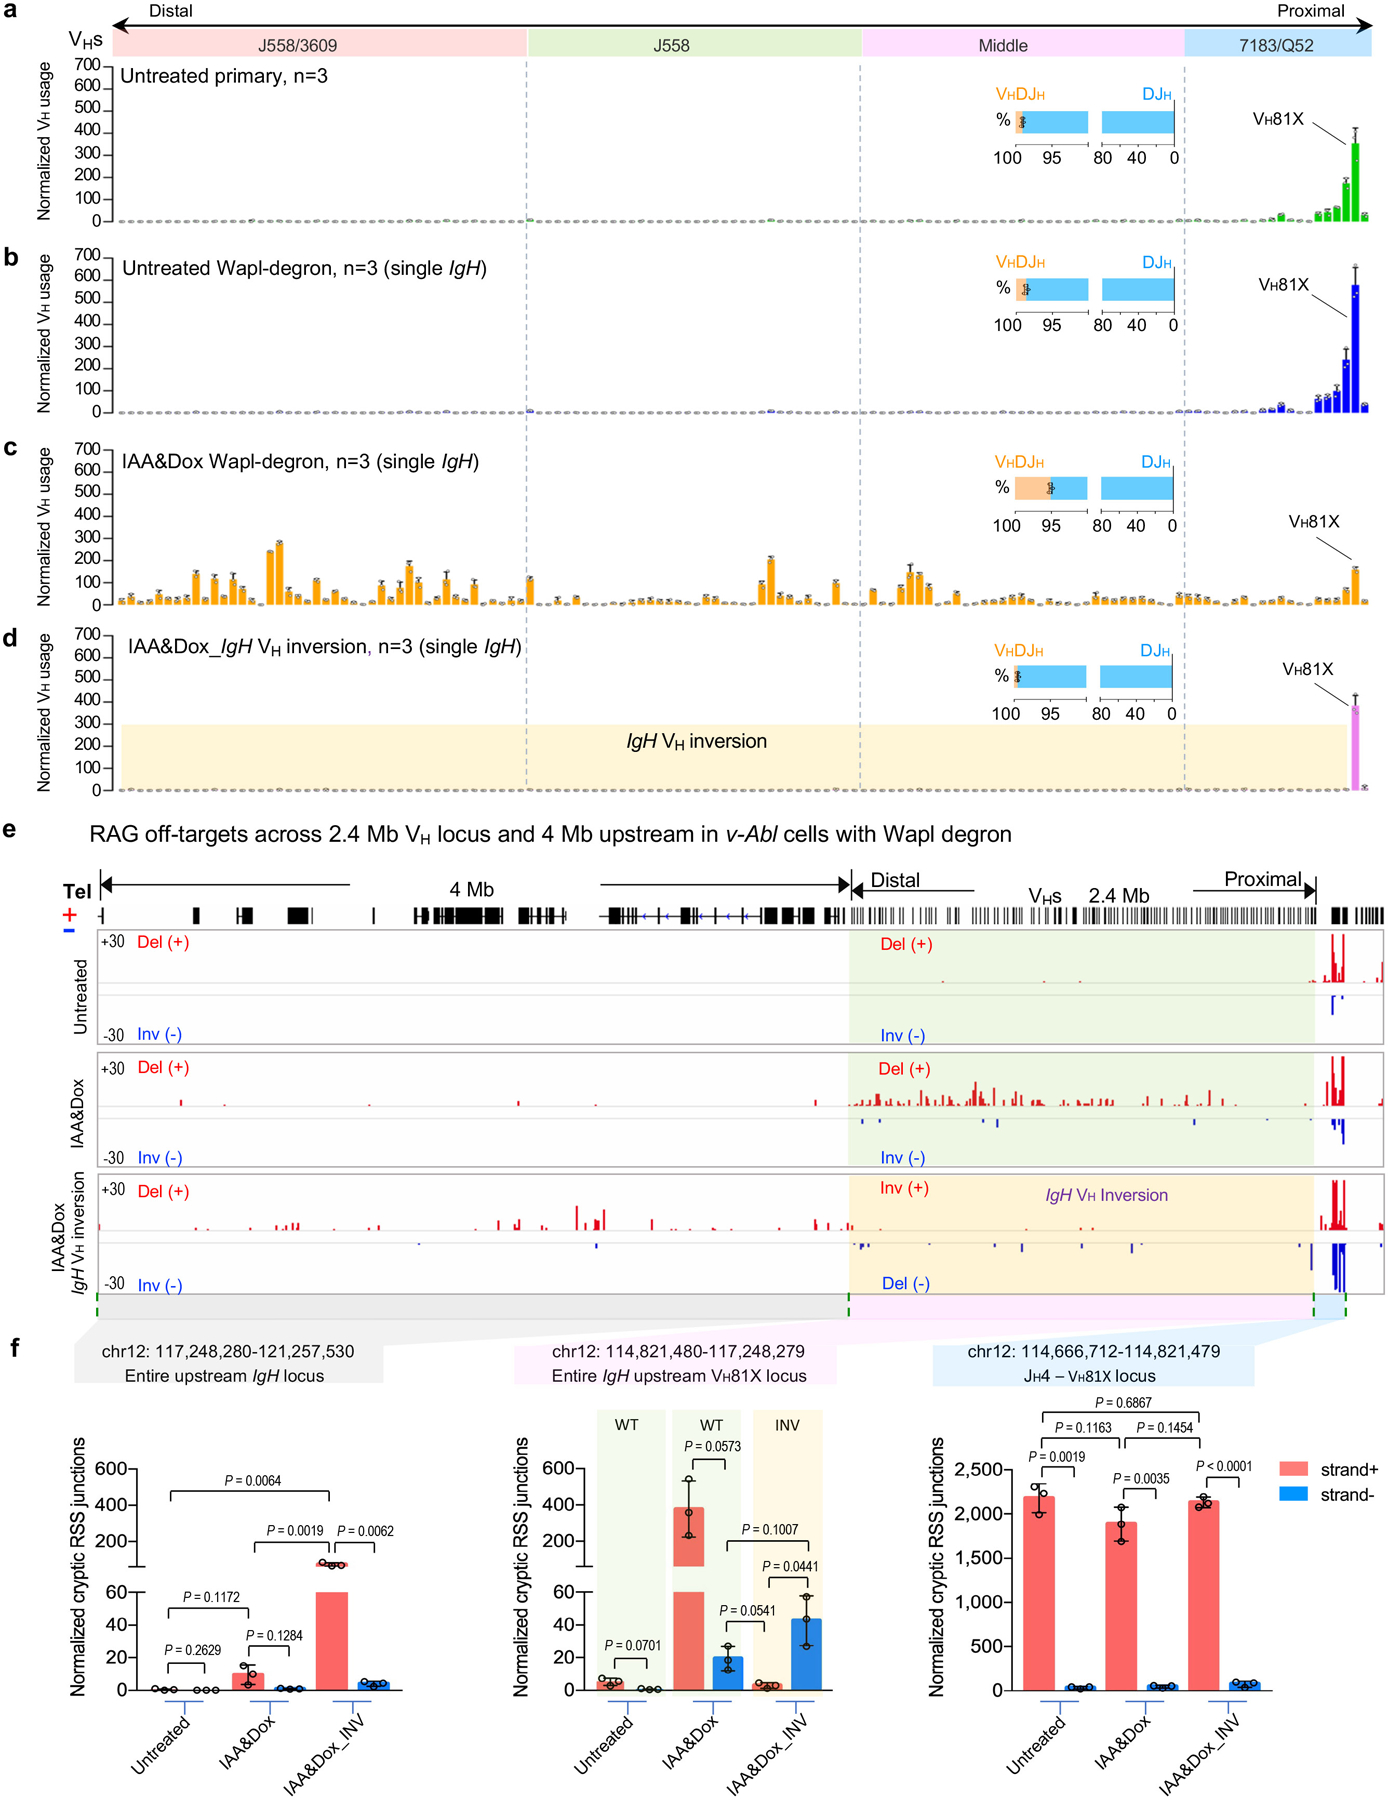
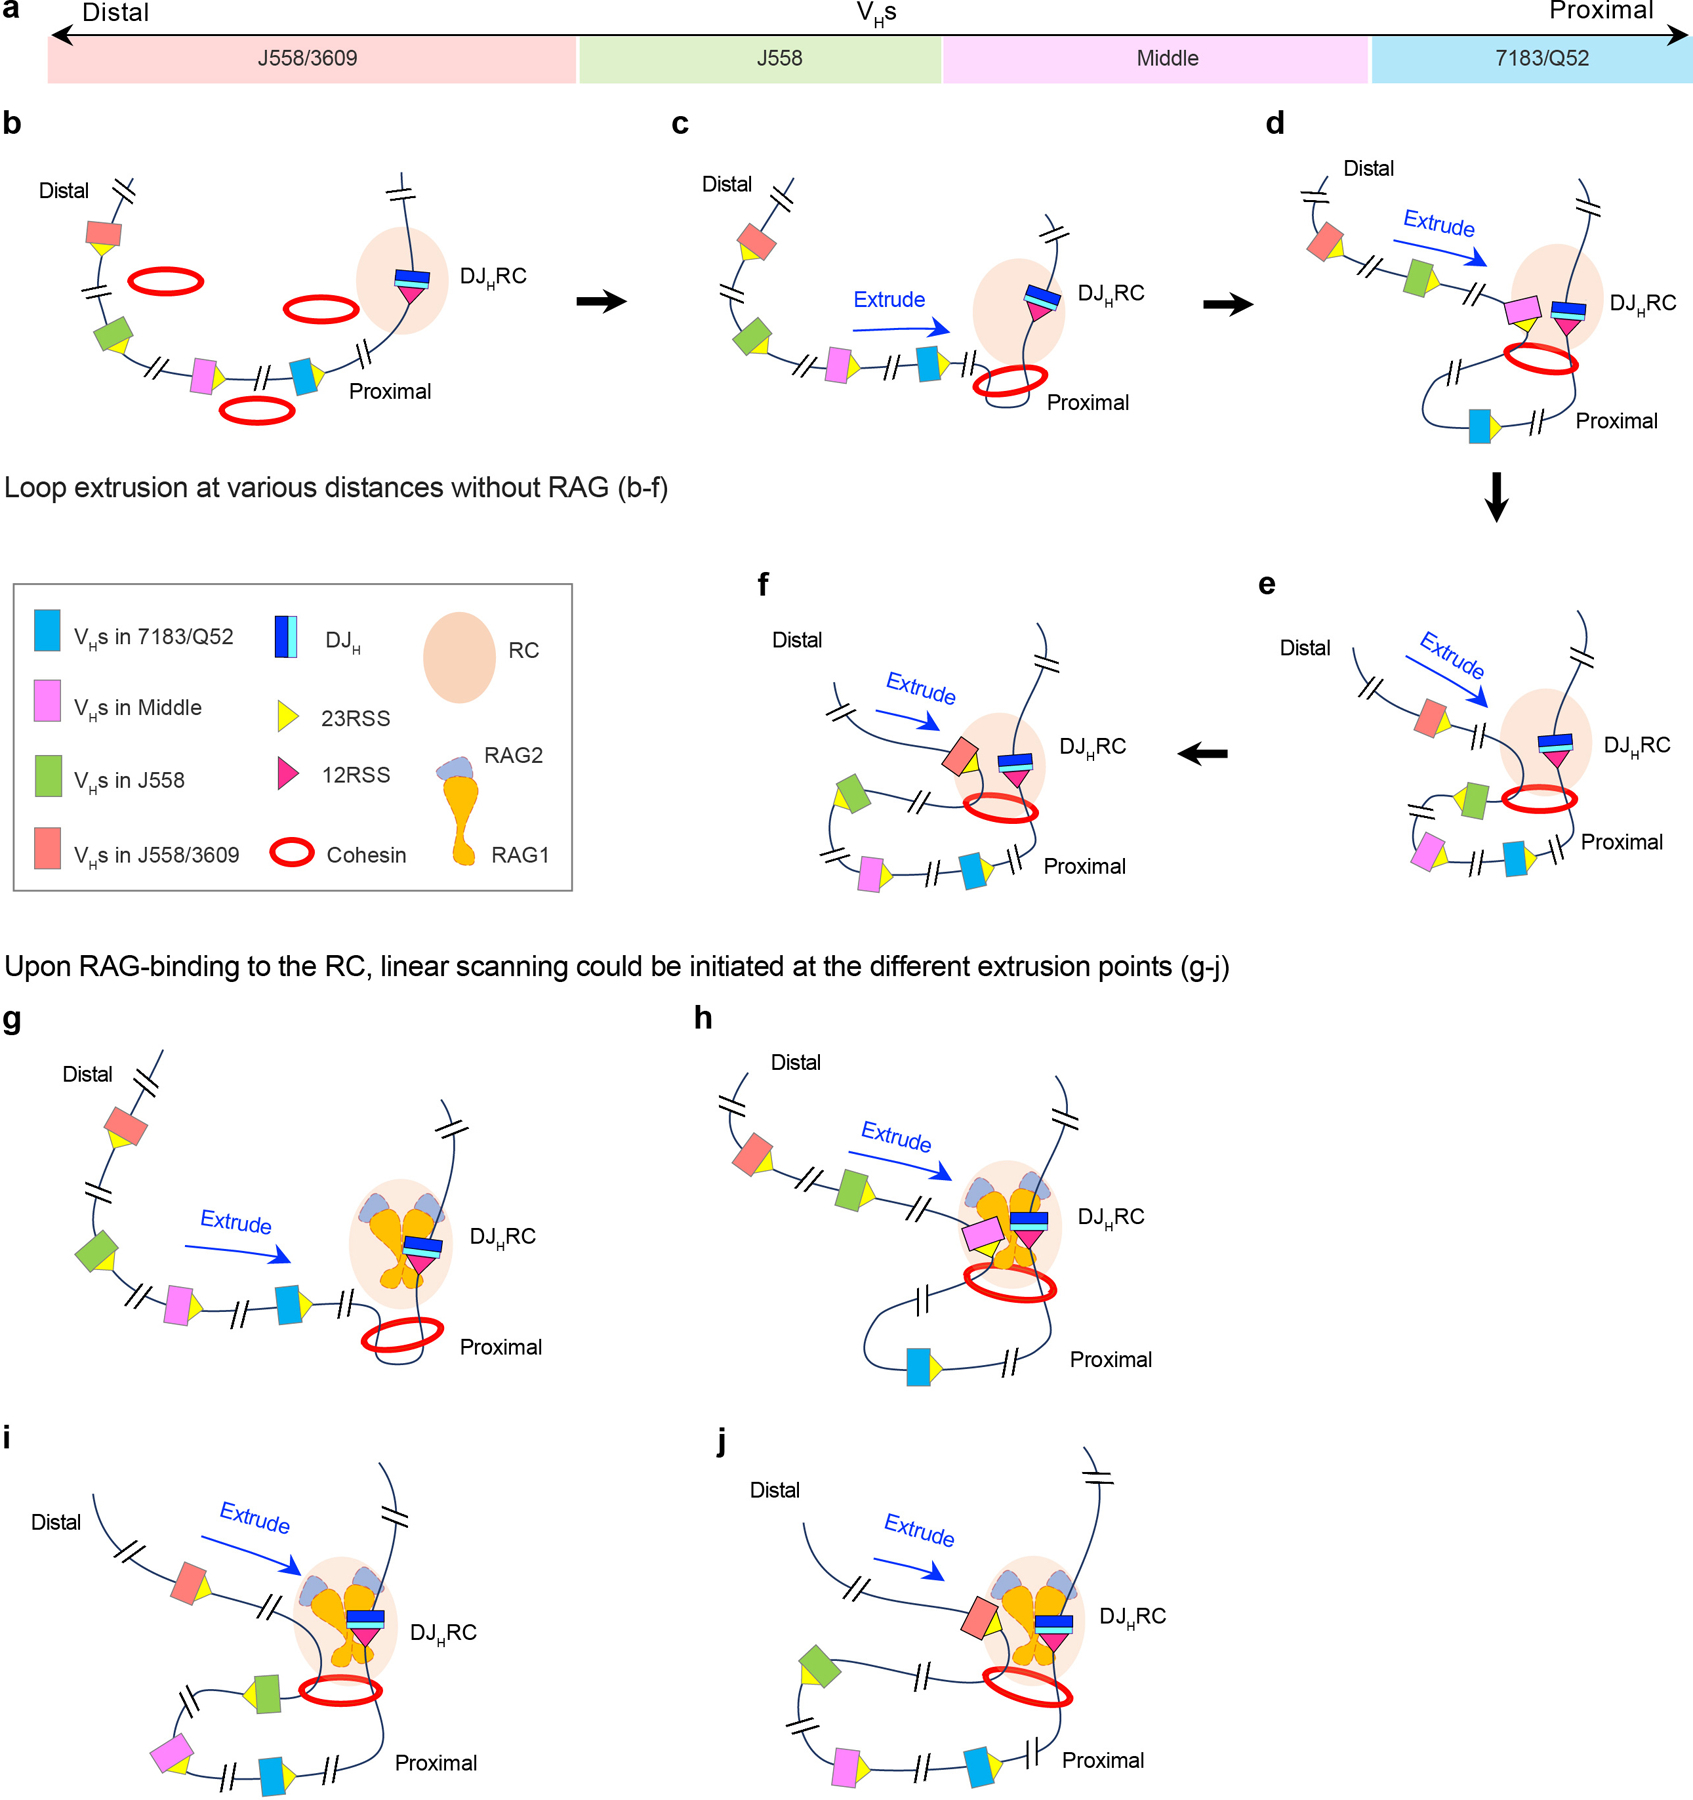
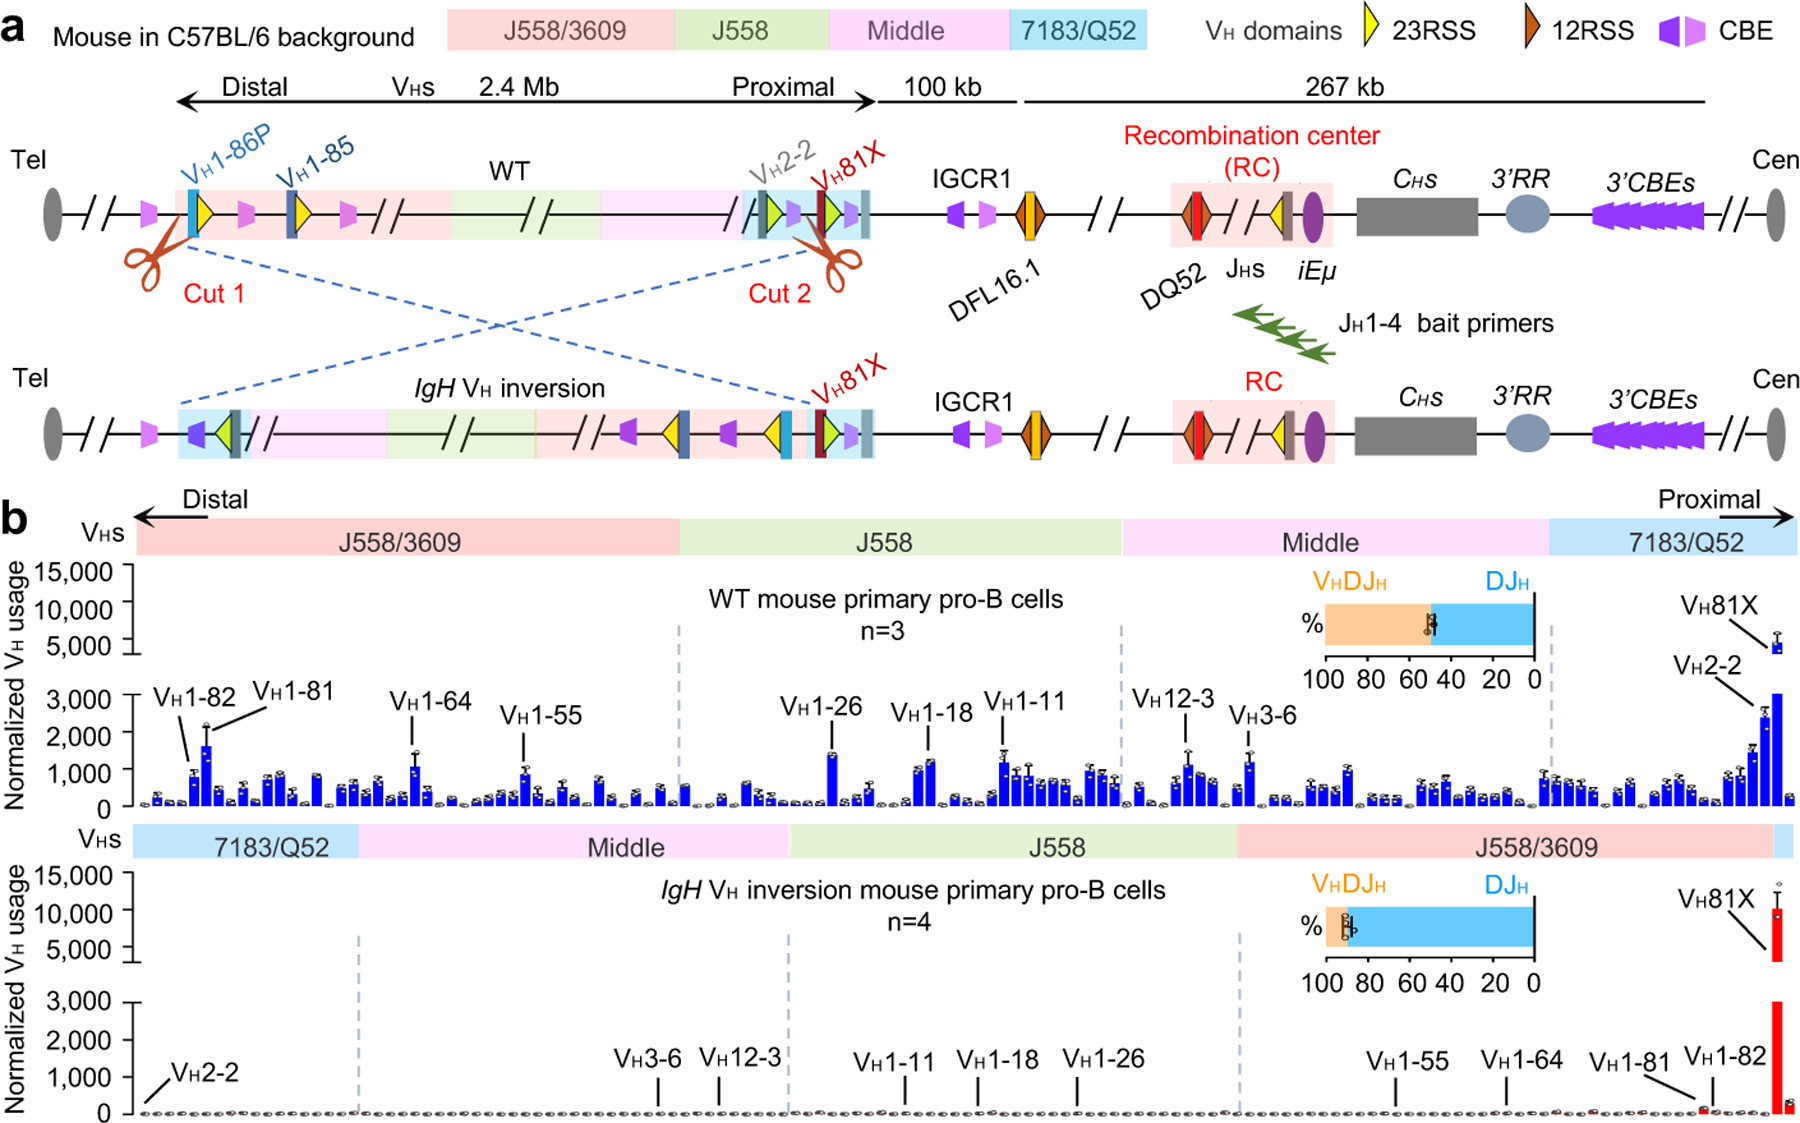
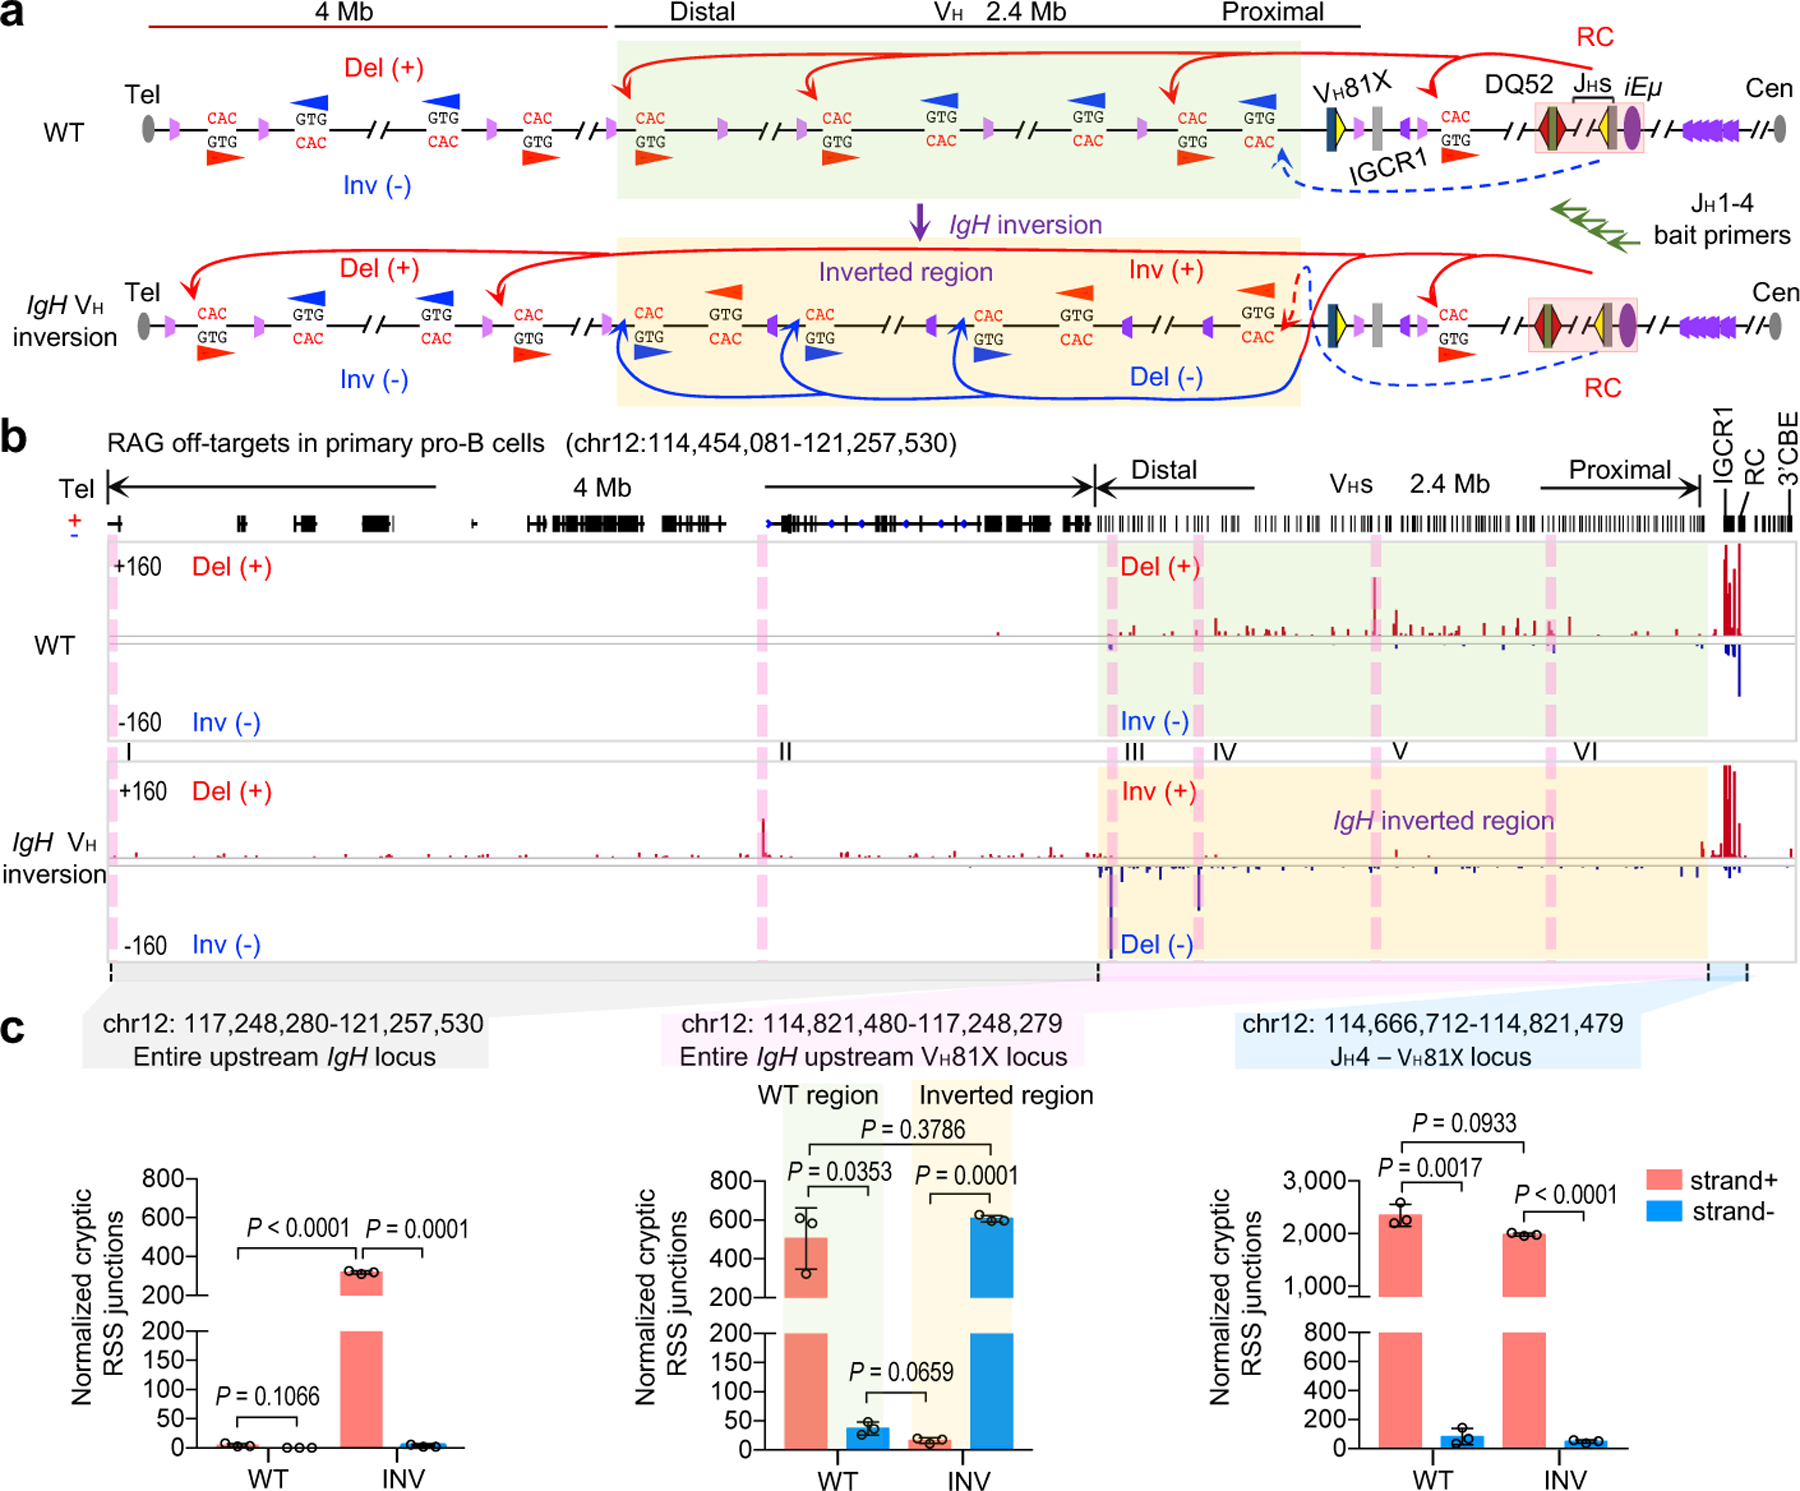
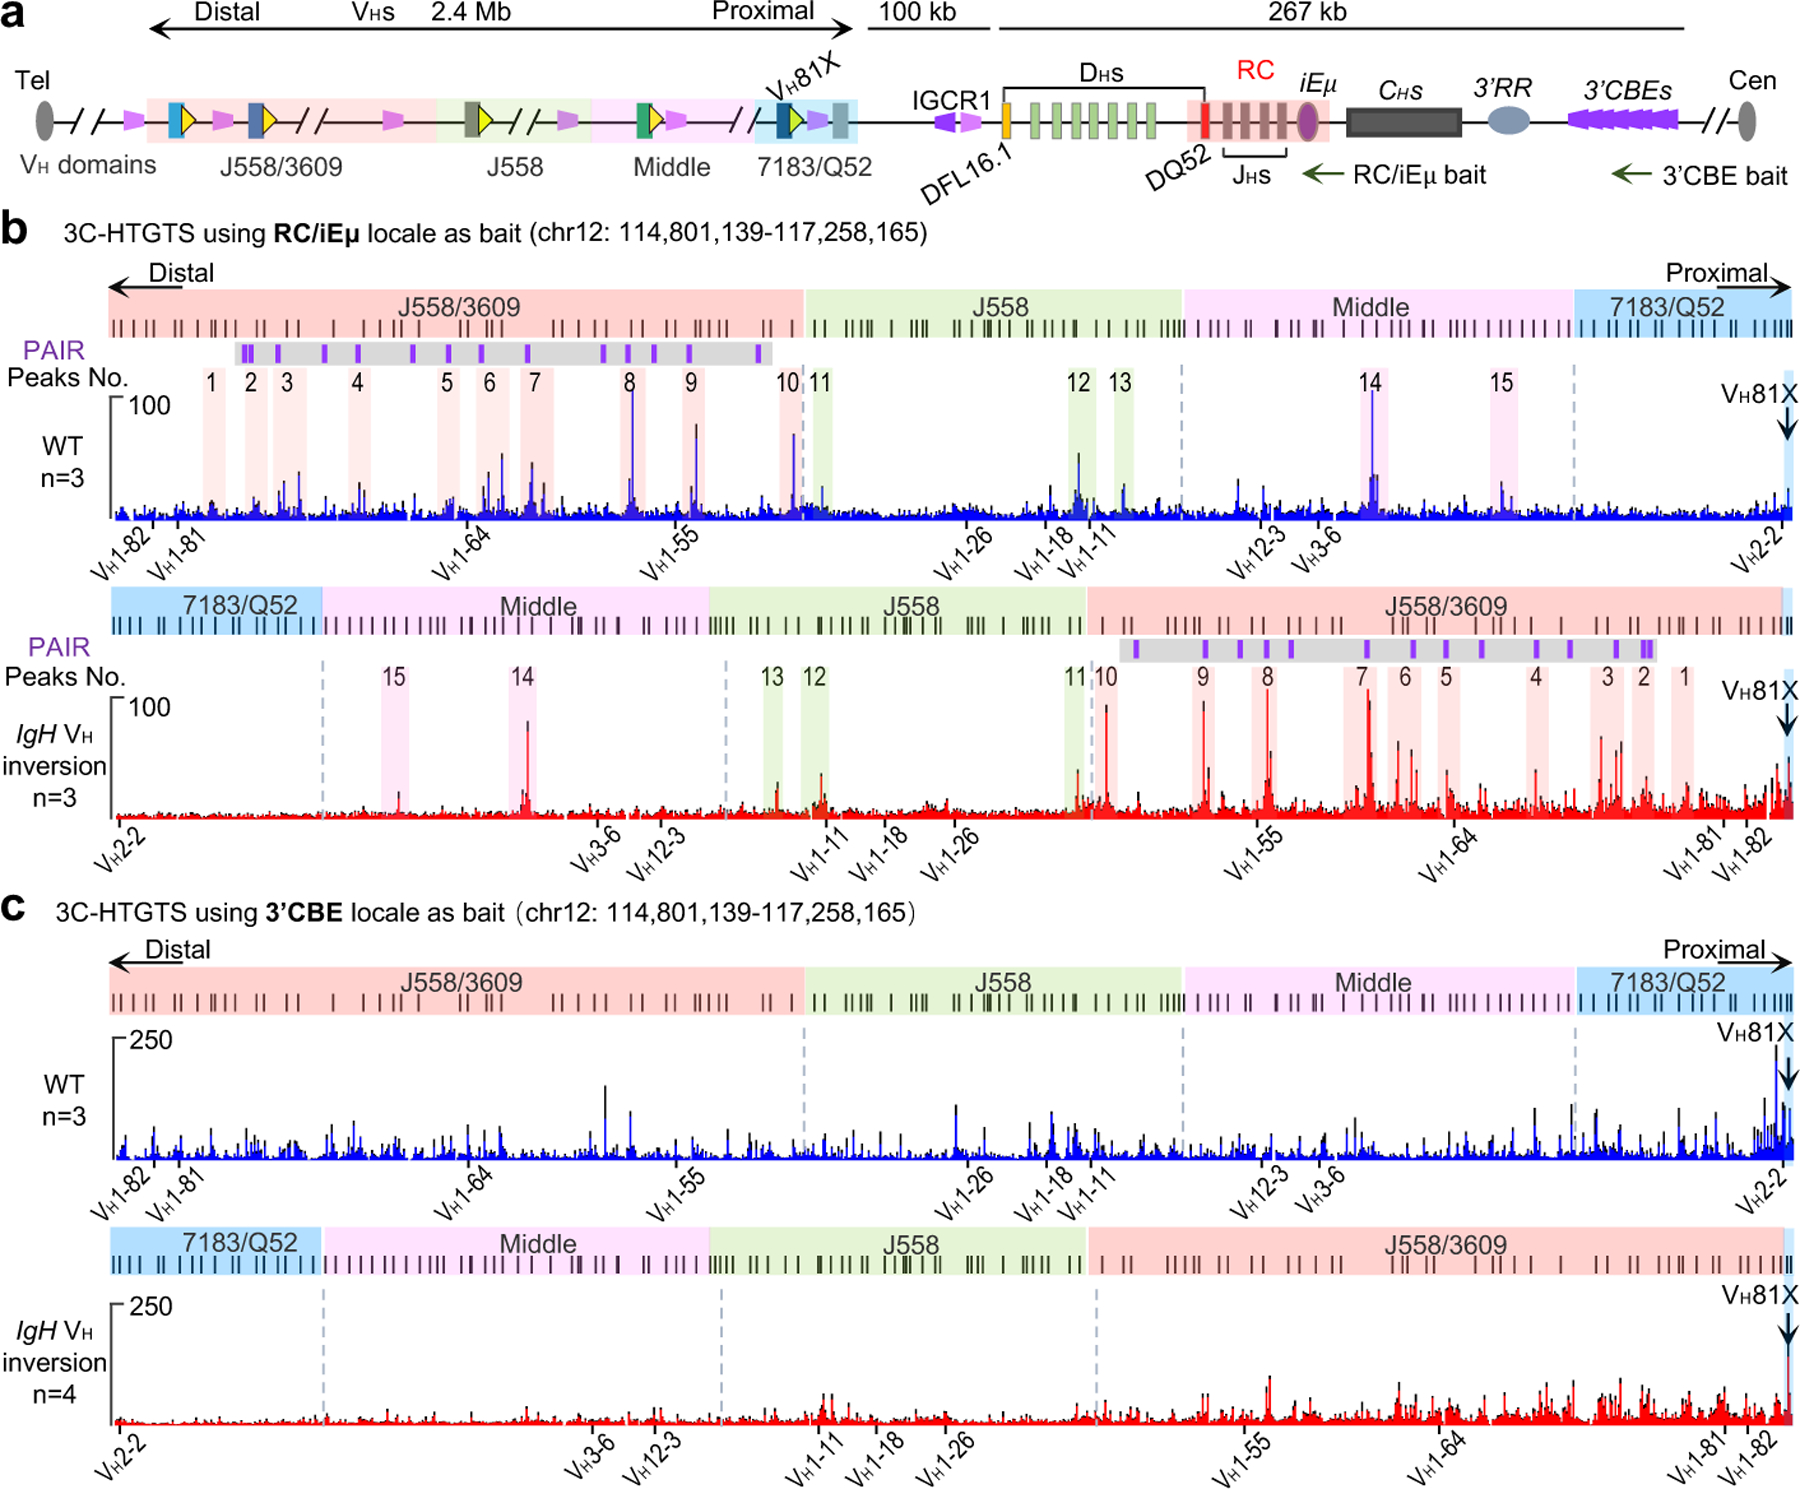
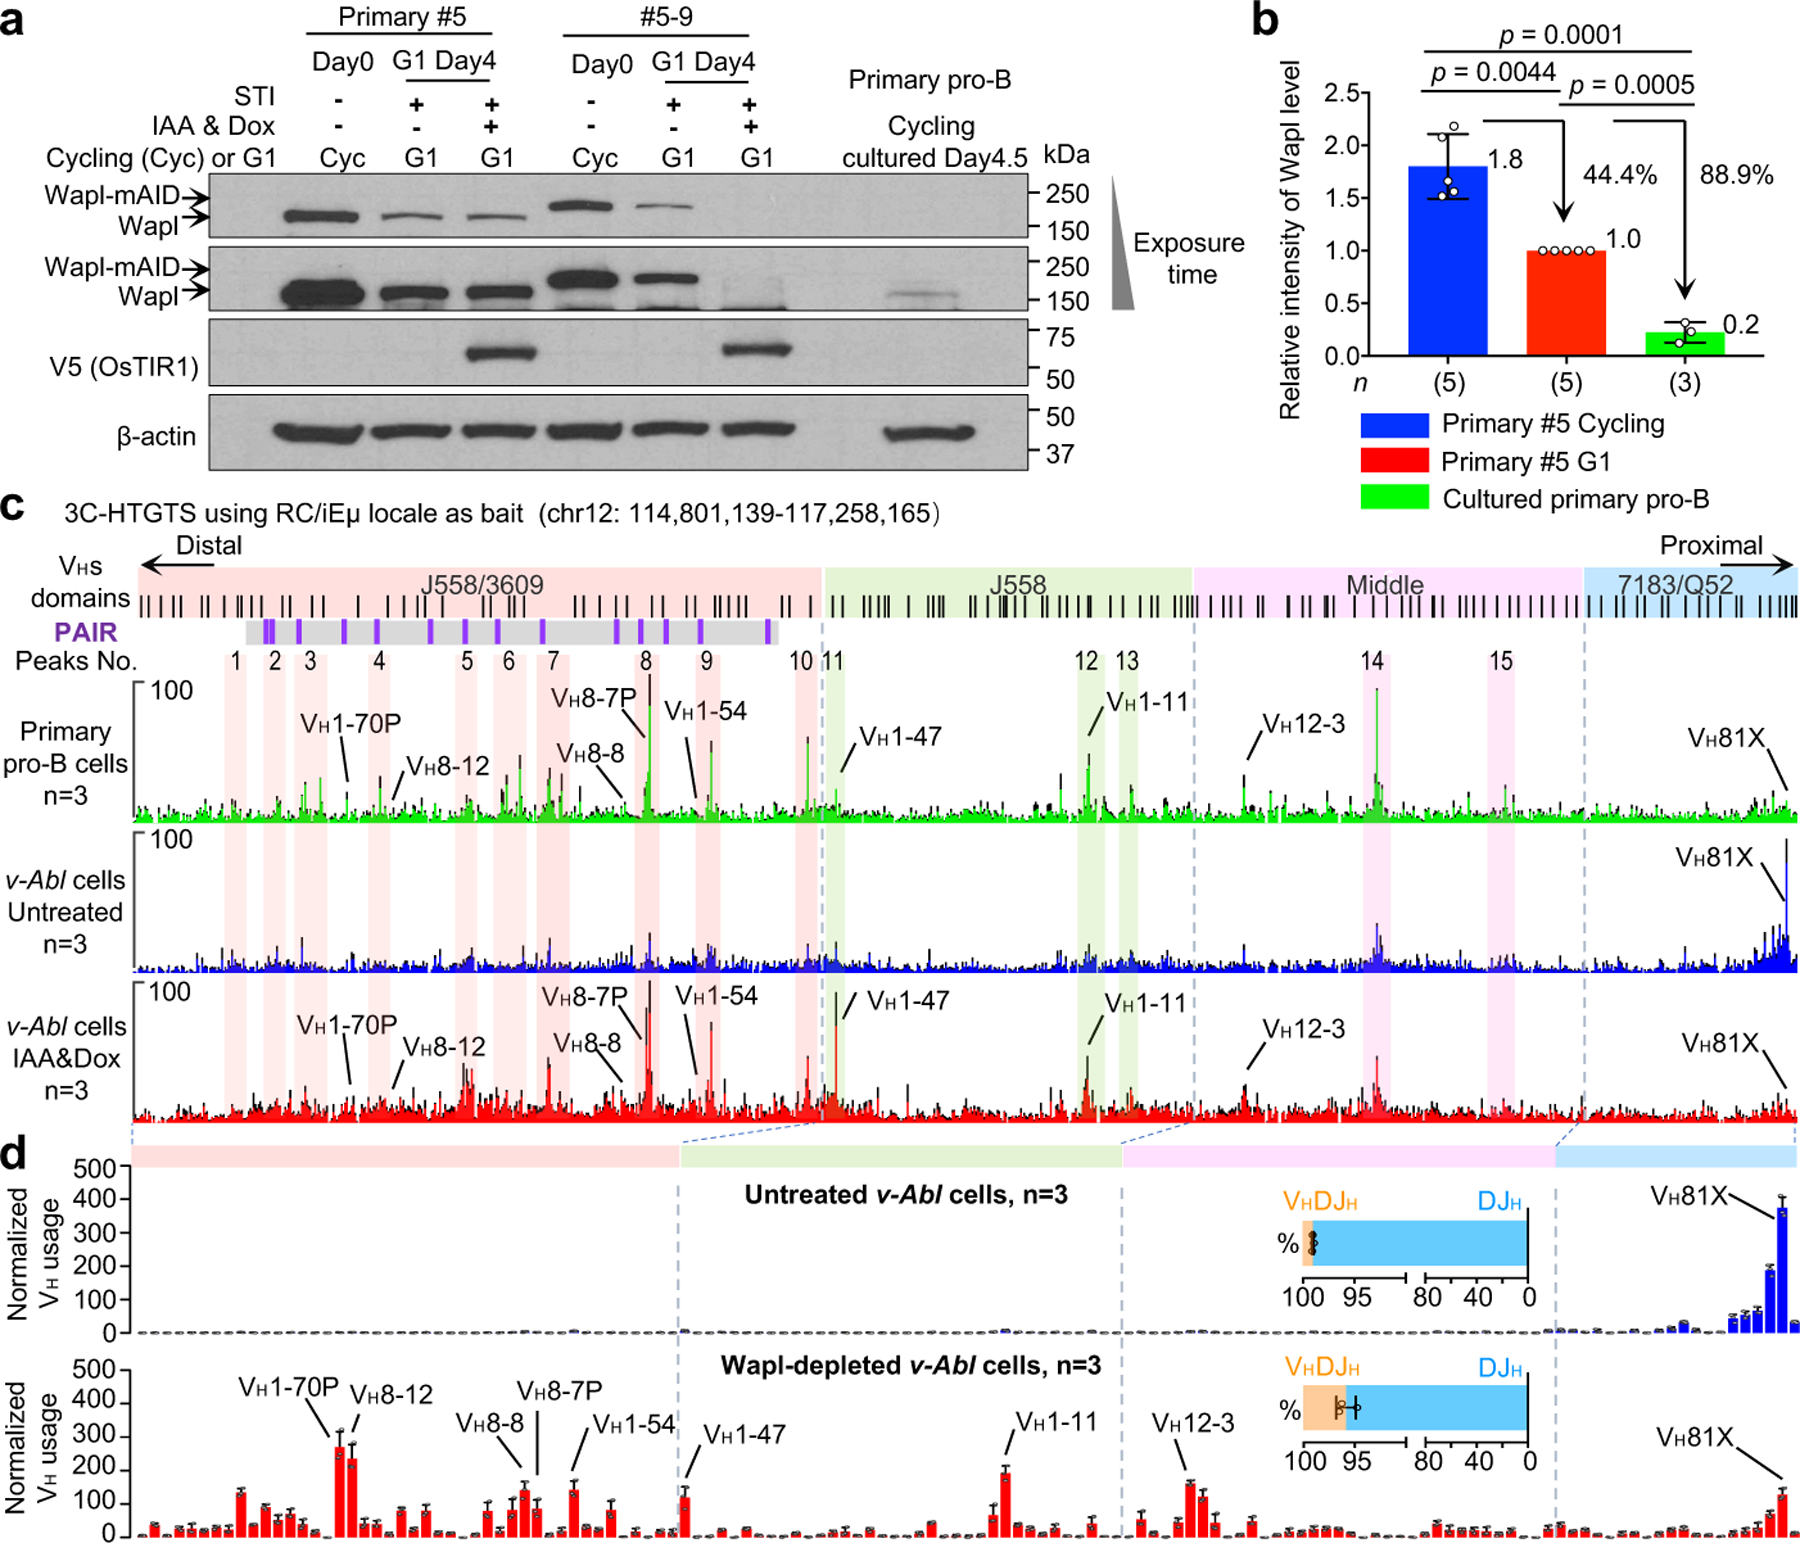
RAG endonuclease initiates Igh V(D)J recombination in progenitor B cells by binding a JH-recombination signal sequence (RSS) within a recombination centre (RC) and then linearly scanning upstream chromatin, presented by loop extrusion mediated by cohesin, for convergent D-RSSs1,2. The utilization of convergently oriented RSSs and cryptic RSSs is intrinsic to long-range RAG scanning3. Scanning of RAG from the DJH-RC-RSS to upstream convergent VH-RSSs is impeded by D-proximal CTCF-binding elements (CBEs)2-5. Primary progenitor B cells undergo a mechanistically undefined contraction of the VH locus that is proposed to provide distal VHs access to the DJH-RC6-9. Here we report that an inversion of the entire 2.4-Mb VH locus in mouse primary progenitor B cells abrogates rearrangement of both VH-RSSs and normally convergent cryptic RSSs, even though locus contraction still occurs. In addition, this inversion activated both the utilization of cryptic VH-RSSs that are normally in opposite orientation and RAG scanning beyond the VH locus through several convergent CBE domains to the telomere. Together, these findings imply that broad deregulation of CBE impediments in primary progenitor B cells promotes RAG scanning of the VH locus mediated by loop extrusion. We further found that the expression of wings apart-like protein homologue (WAPL)10, a cohesin-unloading factor, was low in primary progenitor B cells compared with v-Abl-transformed progenitor B cell lines that lacked contraction and RAG scanning of the VH locus. Correspondingly, depletion of WAPL in v-Abl-transformed lines activated both processes, further implicating loop extrusion in the locus contraction mechanism.


Conflict of interest statement

The authors declare no competing financial interests. F.W.A. is a co-founder of Otoro Biopharmaceuticals.

Figures

Extended Data Figure. 1 |
Extended Data Figure. 1 |. Generation and characterization of IgH VH locus inversion mouse model.
a, Schematic diagram showing CRISPR-Cas9-mediated entire IgH VH locus inversion upstream VH81X in embryonic stem cells (ES cells) on the IgH allele in C57BL/6 genetic background. Cut1 and Cut2 showing the location of 2 sgRNAs. Details as shown in Fig. 1a. b, Confirmation of the upstream and downstream inversion junctions by Sanger sequencing. The sgRNA-targeting sequence is underlined, and the PAM sequence is labelled in red. sgRNAs and oligos used are listed in Supplementary Table 6. c, Schematic showing the generation of IgH VH locus inversion mouse model and further assays for phenotype and mechanism analyses. d, e, Representative flow cytometry analysis of IgM- bone marrow (BM) B cell populations in 4~6-week-old WT (d) and IgH VH locus inversion (e) mice. B220+IgM- B cells were gated and shown in the left plot (d, e). The black arrow lines indicate the gating strategies. B220+CD43+ pro-B and B220+CD43- pre-B cell populations are indicated in the right plot (d, e).
Extended Data Figure. 2 |
Extended Data Figure. 2 |. RAG utilization of cryptic RSSs across normal and inverted IgH loci in primary pro-B cells.
a, 6 examples (labeled in Fig. 2b, I-VI) of RAG off-target peaks in WT (repeat #1, middle) and IgH VH locus inversion (repeat #1, bottom) primary pro-B cells plotted at single-base-pair resolution. Top panels are WT 2.4 Mb IgH locus and upstream 4 Mb region track. For comparison, the sequence of RAG off-target peaks (III-VI) in the inverted region are shown in inverted orientation. b, c, RAG off-target junction profiles at IgH locus and upstream 4 Mb region in WT (repeat #2, #3, middle) and IgH VH inversion (repeat #2, #3, bottom) primary pro-B cells. For comparison, RAG off-target junction profiles in the inverted region are shown in normal orientation (c). The same regions of RAG off-target peaks (shown in a) are highlighted with pink lines (b, c). The IgH VH inverted region is highlighted in transparent green (WT, a, b) and transparent gold (IgH VH inversion, a, c), respectively. Del (+) indicates deletional junction. Inv (−) indicates inversional junction. d, Normalized RC-3C-HTGTS reads ± s.d. of WT (n=3) and INV (n=3) in entire upstream IgH locus and J558/3609 VH region are shown. See Supplementary Data 1 for individual repeats of RC interactions with whole IgH locus and entire upstream IgH locus. Indicated P values were calculated using unpaired two-tailed t-test. n, number of independent experiments.
Extended Data Figure. 3 |
Extended Data Figure. 3 |. The major RC interactions, transcription patterns, and binding of key looping factors are maintained in the inverted IgH loci in cultured RAG1-deficient primary pro-B cells (Related to Fig. 3b).
For comparison, all the data in the inverted region are shown in normal orientation. Related to Fig. 3b. Zoom-in profiles of 3C-HTGTS, GRO-seq, Rad21/CTCF ChIP-seq signals for ± 10 kb regions of 15 representative peaks/clusters in Fig. 3b from WT (blue) and IgH inversion (INV, Red) cultured RAG1-deficient primary pro-B cells along with relevant bona fide CBE motif sites are shown, data are presented as average signal counts ± s.e.m., PAIR elements (green bars) that located in each peak were also shown above. 3C-HTGTS: WT, n=3; INV, n=3. GRO-seq: WT, n=4; INV, n=4. Rad21 ChIP-seq: WT, n=3; INV, n=3. CTCF ChIP-seq: WT, n=3; INV, n=3. n, number of independent experiments. A similarly detailed view of these parameters across the entire VH locus is shown in Supplementary Data 2. Discussion: Overall these patterns indicate that proximal 7183/Q52 highly rearranged VHs are not transcribed but frequently have CTCF-bound closely associated CBEs; whereas distal J558/3609 highly rearranged VHs are often transcribed and/or have CBEs within 5kb that are CTCF-bound, which in cases where both occur may cooperate to enhance rearrangement. In the J558 and Middle VH domains, some highly rearranged VHs are transcribed and/or have associated CTCF/cohesin-bound CBEs; but some highly rearranged VHs in these regions appear to have neither, suggesting other unknown mechanisms for their RAG-targeting during scanning. In some latter examples we cannot rule out very low level sense and/or anti-sense transcription as having a contributory role; since the threshold for transcriptional targeting of RAG scanning activity has not been determined. Overall, these patterns are somewhat similar to those discussed in recent report on study involving CTCF-depletion in v-Abl cells.
Extended Data Figure. 4 |
Extended Data Figure. 4 |. Cohesin/ CTCF binding patterns and germline VH transcription patterns are shown in normal and inverted IgH loci in cultured RAG1-deficient primary pro-B cells (Related to Fig. 3b and Supplementary Data 2).
a, b, For comparison, the ChIP-seq data in the inverted locus are shown in normal orientation. Average signal counts ± s.e.m. of Rad21 (a) / CTCF (b) ChIP-seq across the 4 VH domains as indicated in WT (upper, blue, n=3) and IgH VH locus inversion (bottom, red, n=3) cultured RAG1-deficient primary pro-B cells. n, number of independent experiments. c, Average signal counts ± s.e.m. of GRO-seq profiles across the 4 VH domains in WT (upper, n=4) and IgH VH locus inversion (bottom, n=4) cultured RAG1-deficient primary pro-B cells. n, number of independent experiments. For comparison, the GRO-seq results in the inverted locus is shown in inverted orientation (c, bottom). The WT and inverted VH locus/domains with PAIR elements are diagrammed at the top of each panel. Both the sense and antisense transcription are relative to the entire IgH VH locus upstream VH81X with or without inversion and indicated, respectively. For comparison, 15 representative major interaction peaks/clusters as shown in Fig. 3b were indicated with colour shades and numbers. The IgH VH inverted region is highlighted in transparent green (WT) and transparent gold (IgH VH inversion), respectively. See Supplementary Data 2 for more details.
Extended Data Figure. 5 |
Extended Data Figure. 5 |. The 3’CBEs are not required for VH utilization.
a, Diagram of the entire murine IgH locus with or without ten 3’IgH CBEs, details as shown in Fig. 1a. b, Schematic of the strategy to generate the mouse ES cells with entire 3’CBE locus deletion. Ten 3’IgH CBEs are shown in gray peaks on the top panel. LoxP sites flanking the pGK-Neo selection marker are shown as black triangles. Red filled boxes ‘A’ and ‘B’ indicates the left and right homology arms, respectively, flanking all ten 3’IgH CBEs. c, Gel images show the confirmation results of two independent 3’CBE-deleted ES cell clones, 3’CBEs∆HOMO #1 and #2 (n=2 biologically independent repeats with similar results). P1-P3 are the genotyping primers and listed in Supplementary Table 6. See Methods for more details. d, Average utilization frequencies ± s.d. of all VH segments in WT primary pro-B cells (n=6). VH usage data were extracted from Ba et al. (GEO: GSE142781). n, number of independent experiments. e, f, Average utilization frequencies ± s.d. of all non-productive (NP) VH segments in splenic B cells from WT (e, n=3) and 3’CBE deletion (f, n=3) mice, respectively. n, number of independent experiments. All the data are from 129SV background mice (d-f). Prior studies show that non-productive allele rearrangement patterns of splenic B cells are highly correlated with those productive and non-productive patterns in primary pro-B cells. See Supplementary Table 3 and Methods for all further details of this analysis. Discussion: Termination of loop extrusion-mediated VH locus RAG-scanning within the VH locus in normal primary pro-B cells may be largely impeded by bona fide convergent VHRSS-mediated rearrangements. In this regard, inversion of the VH locus would eliminate any potential contribution of VHRSS-mediated contributions. Beyond this, such termination of RAG-scanning also may be contributed by cooperative activities of highly frequent distal VH locus scanning impediments including active transcription sites and CBEs. Due to the number of such impediments, and the possibility that their activity may be collective, assessing their functions in this context may be difficult via targeted mutational analyses. However, our findings of differential effects of the inversion on proximal versus distal VH locus CBEs interactions with convergent 3’CBEs in the VH inverted locus provides indirect support of such a potential role for distal CBEs (Fig. 3c, bottom).
Extended Data Figure. 6 |
Extended Data Figure. 6 |. Generation and characterization of RAG1-deficient Wapl-degron v-Abl cell lines.
a, Scatter plots of average transcriptome-wide GRO-seq counts in G1-arrested v-Abl cells (x axis, n=3) and primary pro-B cells (y axis, n=4). n, number of independent experiments. Representative known requisite genes implicated in the cohesin-complex function for V(D)J recombination and chromatin interactions are highlighted by red circles and blue arrows. Representative known genes implicated in the DNA repair and B cell development were also analyzed to determine if there were any potential transcriptional defects in these essential genes for V(D)J recombination and none were found and highlighted. Analyses of scatter plots indicate that Wapl is expressed at significantly higher levels in G1-arrested v-Abl cells than in primary pro-B cells (Spearman’s correlation coefficient (rho) and P values determined by two-sided Spearman’s correlation test are presented). These transcription finding were confirmed by western blotting studies (Fig. 4a). b, Comparison of Wapl transcription levels by GRO-seq in primary pro-B cells and G1-arrested v-Abl cells from 4 and 3 independent repeats, respectively. Data are presented as average signal counts ± s.e.m. of GRO-seq. n, number of independent experiments. Although other genes upstream and downstream of the Wapl gene show altered transcription in primary pro-B cells compared to the v-Abl cells, their products thus far have not been implicated in loop extrusion or chromatin scanning. c, Schematic of the targeting strategy for introducing Tet-On OsTIR1 expression cassette at the mouse Rosa26 locus. d, Strategy to generate Wapl-degron v-Abl cell lines. Positions of homology arms (gray box), Cas9/sgRNAs and southern blot probe are indicated. e, Southern blot confirmation of two correctly targeted clones (#5–3 and #5–9) with Wapl-mAID on both alleles (n=2 biologically independent repeats with similar results). f, Diagram of the experimental strategy to specifically deplete mAID-tagged Wapl protein in G1-arrested v-Abl cells. g, Western blotting to detect Wapl and Wapl-mAID protein. The indicated clones (#5–3 and #5–9) were grown without or with Wapl depletion at indicated time points before immunoblotting (n=2 biologically independent repeats with similar results). The specific western blotting bands of WT Wapl and Wapl-mAID were labeled. OsTIR1 was detected by anti-V5 antibody. Primary #5 clone was used for the WT Wapl control and β-actin was a loading control. h, Western blotting to detect Wapl protein levels in G1-arrested RAG1-deficient primary #5 v-Abl cells and cultured RAG1-deficient primary pro-B cells. Each sample was loaded with 3 indicated titrations. One of the two experiments is shown. i, Western blotting results to determine relative Wapl protein levels in cycling and G1 arrested Wapl-degron v-Abl cell clones (#5–3 and #5–9) with indicated conditions. For comparison, the intensity of the Wapl band in G1-arrested primary #5 v-Abl cells is set as 1.0. Average value is indicated at each bar. n, number of independent repeats. Indicated P values were calculated using unpaired two-tailed t-test. j, Representative flow-cytometry plots showing the percentage of Clover-positive Wapl-degron v-Abl cells that are without (Untreated) or with (IAA&Dox) Wapl depletion at indicated time points (n=2 biologically independent repeats with similar results). Primary #5 was processed as a Clover-negative control. k, Cell viability assay for G1-arrested v-Abl cells with indicated conditions. Data are presented as average percentage ± s.d. of viable cells for each condition. n, number of independent experiments. l, Representative flow-cytometry plots of propidium iodide (PI) stained G1-arrested v-Abl cells with indicated conditions (n=2 biologically independent repeats with similar results). Percentages in the top-right corner represent the percentage of cells at G1, S and G2/M stage. One of the two experiments is shown. Indicated P values were calculated using unpaired two-tailed t-test (i, k). Plasmids, sgRNAs and oligos used are listed in Supplementary Table 6.
Extended Data Figure. 7 |
Extended Data Figure. 7 |. Characterization of Wapl/ CTCF/ Rad21-binding in G1-arrested RAG1-deficient Wapl-degron v-Abl cells.
a, Average signal counts ± s.e.m. of Wapl ChIP-seq across the entire IgH locus are plotted as indicated for G1-arrested RAG1-deficient v-Abl cells without (Untreated, blue) or with (IAA&Dox, red) Wapl depletion and cultured RAG1-deficient primary pro-B cells (green). n, number of independent experiments. Wapl ChIP-seq showed that IAA&Dox treatment leads to a depletion of chromatin-bound Wapl at IgH locus, which largely resembles that of primary pro-B cells at IgH locus. b, Three independent repeats of Wapl ChIP-seq signal within ±1.0 kb region across all peaks genome-wide called in G1-arrested RAG1-deficient v-Abl cells without (Untreated) or with (IAA&Dox) Wapl depletion. Top: Average enrichment. c, d, Average signal counts ± s.e.m. of CTCF (c) and Rad21 (d) ChIP-seq across the entire IgH locus are plotted as indicated for G1-arrested RAG1-deficient v-Abl cells without (Untreated, blue) or with (IAA&Dox, red) Wapl depletion, and cultured RAG1-deficient primary pro-B cells (green). n, number of independent experiments. Rad21 ChIP-seq showed that Wapl depletion in G1-arrested v-Abl cells influenced Rad21 (cohesin) redistribution across the IgH locus to give a pattern significantly similar to primary pro-B cells (Spearman’s correlation r=0.84, P<2e-16) (d). e, Spearman correlation analyses of VH usage with Rad21 and CTCF binding in WT primary pro-B cells and Wapl depleted v-Abl cells. Data for Spearman correlation analyses are from Fig. 1b, 4d, and Extended Data Fig. 4a–b, and 7c–d. Indicated P values were calculated by a two-sided Spearman’s correlation test and shown as: *: 0.01≤P<0.05, **: 0.001≤P<0.01, and ***: P<0.001. Discussion: As noted in the text, we found significant correlations between VH usage and Rad21 or CTCF binding in 3 of the 4 VH families including the distal VH J558/3609 family in primary pro-B cells. However, in the IAA&Dox-treated v-Abl lines, we did not observe a significant correlation between VH usage and Rad21 or CTCF binding in the distal VH J558/3609 family. To explore the reason for this correlation discrepancy, we did an analysis of the correlation of primary pro-B cell VH usage patterns with cohesin and CTCF binding patterns in IAA&Dox-treated v-Abl cells, which indeed revealed significant correlations of these patterns in distal J558/3609 VH usage for both cohesin and CTCF (Extended Data Fig. 7e). This finding indicates that the lack of correlation of distal J558/3609 VH usage with cohesin and CTCF binding patterns in Wapl-depleted v-Abl cells stems from their VH usage patterns. In this regard, primary pro-B cells generate their VH repertoires from a steady state population in which these cells presumably have RAG scanning across the locus fully engaged and coordinated with VH locus contraction. However, in Wapl-depleted v-Abl cells, RAG scanning and VH locus contraction may not be physiologically matched due to ectopic RAG expression and ectopically-induced Wapl depletion. The further impact of the nearly complete Wapl-depletion in IAA&Dox-treated v-Abl cells versus Wapl expression levels in primary pro-B cells (Fig. 4a) is reflected by greatly reduced levels of proximal versus distal VH rearrangements in v-Abl lines versus those primary pro-B cells (Fig. 4d, bottom; Extended Data Fig. 9c; Supplementary Table 2, 5). Moreover, complete Wapl depletion decreases overall V(D)J recombination activity per se in v-Abl lines as noted in the text, which might also impact these correlations.
Extended Data Figure. 8 |
Extended Data Figure. 8 |. Characterization IgH gene transcription, D usage, and Igκ rearrangements in G1-arrested Wapl-degron v-Abl cells.
a, Average signal counts ± s.e.m. of GRO-seq across the 4 VH domains (left) and RC region (right) are plotted as indicated in G1-arrested RAG1-deficient v-Abl cells without (Untreated, upper) or with (IAA&Dox, middle) Wapl depletion and cultured RAG1-deficient primary pro-B cells (bottom). n, number of independent experiments. For comparison, 15 representative major interaction peaks/clusters as Fig. 3b are indicated. PAIR elements are indicated as purple lines with gray background. b, Scatter plots of average transcriptome-wide GRO-seq counts in G1-arrested RAG1-deficient v-Abl cells without (Untreated, x axis) and with (IAA&Dox, y axis) Wapl depletion. n, number of independent experiments. Representative known requisite genes for V(D)J recombination and chromatin interaction are highlighted by red circles and blue arrows in each of the three scatter plots. Spearman’s correlation coefficient (rho) and P value determined by two-sided Spearman’s correlation test are presented. c, Diagram of the experimental strategy including retrovirus-mediated RAG complementation in Wapl-degron v-Abl cells for HTGTS-V(D)J-seq assay. d, Average utilization frequencies ± s.d. of all D segments from DJH plus VHDJH joins in RAG1-complemented, G1-arrested Untreated primary, Untreated Wapl-degron and IAA&Dox-treated Wapl-degron v-Abl lines. n, number of independent experiments. Indicated P values were calculated using unpaired two-tailed t-test. e, Average 3C-HTGTS signal counts ± s.e.m. baiting from RC for interactions with the RC domains that includes 3’CBE downstream and the most proximal VHs upstream in RAG1-deficient cultured primary pro-B cells (top), G1-arrested RAG1-deficient v-Abl cells without (middle) or with Wapl depletion (bottom). n, number of independent experiments. See Supplementary Data 1 for whole IgH locus interactions. Related very low-level peaks of RC interactions with IGCR1 in IAA&Dox treated cells suggest IGCR1 impediments were neutralized by Wapl depletion in v-Abl cells. f, Absolute individual Vκ usage in total reads. Each library was normalized to 20,000 total reads including Igκ junctions and germline reads. Data are presented as average absolute Vκ usage ± s.d. across the Igκ locus in WT primary pre-B cells and untreated Wapl-degron v-Abl cells (G1_Untreated). For the IAA&Dox-treated Wapl-degron v-Abl cells (G1_IAA&Dox), data are presented as average absolute Vκ usage. Spearman correlation of Vκ usage patterns between WT primary pre-B cells and untreated Wapl-degron v-Abl cells is statistically significant (r=0.96, P<0.001). P values are calculated by two-sided Spearman’s correlation test. n, number of independent experiments. g, Relative Vκ to Jκ rearrangement levels in RAG1-complemented cycling v-Abl cells and G1-arrested Wapl-degron v-Abl cells without (G1_Untreated) or with (G1_IAA&Dox) Wapl depletion. Relative Vκ to Jκ rearrangement levels = Igκ junctions / (Igκ junctions + germline reads) %.Data are presented as mean percentage values ± s.d. for cycling v-Abl cells and untreated Wapl-degron v-Abl cells (G1_Untreated). For IAA&Dox treated Wapl-degron v-Abl cells (G1_IAA&Dox), data are presented as mean percentage values. Average Igκ recombination levels are indicated at each bar. n, number of independent experiments. Vκ usage data of RAG1-complemented G1-arrested Wapl-degron v-Abl cells without or with Wapl depletion from Panel f (middle and bottom) are used to generate the bar graphs (G1_Untreated and G1_IAA&Dox). n, number of independent experiments. h, Percentage of individual Vκ usage in total Vκ to Jκ rearrangements. The same library as panel f was normalized to 20,000 total Igκ junctions. Data are presented as average percentage ± s.d. in WT primary pre-B cells and untreated Wapl-degron v-Abl cells (G1_Untreated). For the IAA&Dox treated Wapl-degron v-Abl cells (G1_IAA&Dox), data are presented as average percentage. n, number of independent experiments. See Supplementary Table 2, 4 and Methods for all further details of the analyses.
Extended Data Figure. 9 |
Extended Data Figure. 9 |. The large VH inversion has similar impacts on normal and cryptic RSS utilization within and beyond the VH locus in G1-arrested Wapl-degron v-Abl cells and primary pro-B cells.
a-d, Average utilization frequencies ± s.d. of all VH segments in RAG1-complemented, G1-arrested v-Abl cells with indicated conditions. Average percentage ± s.d. of VHDJH and DJH rearrangements are shown. Untreated primary, n=3 (a); Untreated Wapl-degron (single IgH allele), n=3 (b); IAA&Dox Wapl-degron (single IgH allele), n=3 (c); IAA&Dox Wapl-degron IgH VH inversion (single IgH allele), n=3 (d) were used for independent experiments for statistical analyses with error bars. n, number of independent experiments. All VH segments divided into four domains from most proximal to distal. See Supplementary Table 2, 5 and Methods for more details. e, Pooled HTGTS junction profiles at IgH locus and upstream 4 Mb region for deletional and inversional joining in RAG1-complemented, G1-arrested v-Abl cells without (Untreated, upper, pooled n=3) or with Wapl depletion (IAA&Dox, middle, pooled n=3), or with 2.4 Mb inversion with Wapl depletion (IAA&Dox, IgH VH inversion, bottom, pooled n=3). For comparison, the VH usage (d) and RAG off-target (e, bottom) data in the VH-loci inverted v-Abl cells are shown in normal IgH orientation. A smaller scale is used to present recombination to cryptic recombination signal sequences in Wapl-degron v-Abl lines (e) compared with that in primary pro-B cells (Fig. 2b); the need for this likely reflects lower levels of overall V(D)J recombination following Wapl depletion. f, Average frequencies ± s.d. of plus strand (red, +) and minus strand (blue, -) joining events within indicated regions in RAG1-complemented, G1-arrested v-Abl cells: Untreated Wapl-degron, n=3; IAA&Dox Wapl-degron, n=3; IAA&Dox Wapl-degron IgH VH inversion, n=3. n, number of independent experiments. Indicated P values were calculated using unpaired two-tailed t-test. See Methods for more details.
Extended Data Figure. 10 |
Extended Data Figure. 10 |. Working model for loop extrusion-mediated IgH locus contraction for RAG chromatin scanning.
a, In C57BL/6 mice, all 109 VH segments are located within one or another four VHs domains as indicated in figure from proximal to distal: 7183/Q52 (blue), Middle (pink), J558 (green) and J558/3609 (red). Beyond VH domains relevant elements and proteins including the DJHRC, 12 and 23 RSSs, cohesin, and RAG1 and RAG2 subunits and complexes are indicated in the box. b-j, Model for loop-extrusion-mediated physiological locus contraction for distal VH utilization based on RAG1-deficient background analyses and RAG on- and off-target analyses in primary pro-B cells with reduced Wapl expression. See text for overall description. In brief: Loop extrusion past the nascent (non-RAG-bound) DJH-RC may cover much greater distances of upstream chromatin (that would vary from cell) than would occur when RAG is bound to the RC, as directly suggested by results of a recent publication from our lab (b-f). If RAG bound to the DJH-RC subsequently in such cells, it could form active DJHRCs that could initiate loop-extrusion-mediated scanning at different extrusion points across the VH locus (g-j), which could avoid downstream rearrangements and potential impediments in those cells to provide more equal scanning access to all VHs across the locus for V(D)J recombination and contribution to diverse antibody repertoires. This model and findings that form its basis may also be relevant to why VH utilization patterns, which must be done in RAG sufficient cells, in some cases, do not correlate as well as might be anticipated with various peaks found for CTCF/cohesin-binding and 3C-HTGTS interaction studies done in RAG-deficient cells,this study. In this regard, future experiments with catalytically dead RAG mutants in which RAG still binds to the RC, as opposed to RAG-deficient cells, may be informative. Finally, please see related discussion in Extended Data Fig. 7.
Figure. 1 |
Figure. 1 |. A 2.4 Mb inversion of the VH locus nearly abrogates rearrangement of VHs within it in primary pro-B cells.
a, Schematic of the strategy of targeted IgH VH locus inversion. Diagram of the murine IgH locus showing the first two proximal VHs (VH81X and VH2–2), the last two distal VHs (VH1–86P and VH1–85), Ds, JHs, CHs, and regulatory elements as indicated (not to scale), with RC that comprises JH-proximal DQ52 segment, four JH segments, and the intronic enhancer (iEμ) highlighted. All VH segments are indicated and divided into four VHs domains (7183/Q52, Middle, J558 and J558/3609) from most proximal to distal. Yellow and dark orange triangles represent position and orientation of bona fide 23RSS and 12RSS, respectively. Purple and pink trapezoids represent position and orientation of CBEs. Green arrows denote the JH1–4 coding end bait primers used for generating HTGTS-V(D)J-seq libraries. Cut1 and Cut2 show the location of 2 sgRNAs. Tel denotes telomere. Cen denotes centromere. b, Average utilization frequencies ± s.d. of all VHs in WT (top) and IgH VH inversion (bottom) primary pro-B cells. Average percentage ± s.d. of VHDJH and DJH rearrangements are shown. For comparison, the VH usage data in the inverted locus is shown in inverted orientation (b, bottom), and several highly utilized VHs in each VH domain are indicated. n, number of independent experiments. See Supplementary Table 1 and Methods for more details.
Figure. 2 |
Figure. 2 |. V(D)J recombination of cryptic RSSs in normal and inverted IgH loci in primary pro-B cells.
a, Illustration of possible joining outcomes between bona fide IgH locus RSSs from JH1–4 coding-end baits to cryptic RSSs mostly represented by CAC motifs in the upstream D, VHs and domains upstream of VHs to the telomere in WT (top) and IgH VH inversion (bottom) primary pro-B cells. Red and blue arches with arrows show possible deletional and inversional junctions, respectively, except for the IgH VH inverted region (red for inversional, blue for deletional). Green arrows indicate the position and orientation of HTGTS primers. Details as shown in Fig. 1a. b, RAG off-target junction profiles at IgH locus and upstream 4 Mb region in WT and IgH VH inversion primary pro-B cells. Junctions are displayed in a linear scale as stacked tracks. I-VI peaks indicated by pink lines are the RAG off-target examples plotted at single-base-pair resolution in Extended Data Fig. 2a. For comparison, RAG off-target junction profiles in the inverted region are shown in normal orientation (b, bottom). The IgH VH inverted region is highlighted in transparent green (a, b, WT) and transparent gold (a, b, IgH VH inversion), respectively. Del (+) indicates deletional junction. Inv (−) indicates inversional junction. c, Average frequencies ± s.d. of plus strand (red, +) and minus strand (blue, -) joining events within indicated regions in wide-type (WT, n=3) and IgH VH inversion (INV, n=3) primary pro-B cells. n, number of independent experiments. Indicated P values were calculated using unpaired two-tailed t-test. See Methods and related Extended Data Fig. 2 for more details.
Figure. 3 |
Figure. 3 |. 3C-HTGTS interactions in normal and inverted IgH loci in cultured RAG1-deficient primary pro-B cells.
a, Diagram of the entire murine IgH locus with details as shown in Fig. 1a. The primer regions of RC/iEμ bait and 3’CBE bait used for 3C-HTGTS are shown. b, Average RC/iEμ baited 3C-HTGTS signal counts ± s.e.m. across the four VH domains in cultured WT (top) and IgH VH inversion (bottom) RAG1-deficient primary pro-B cells. 15 representative major interaction peaks/clusters are indicated with color shades and numbers. PAIR elements are indicated as purple lines with gray background. n indicates the number of biological repeats. c, Average 3’CBE baited 3C-HTGTS signal counts ± s.e.m. across the four VH domains in cultured WT (top) and IgH VH inversion (bottom) RAG1-deficient primary pro-B cells. n indicates the number of biological repeats. The WT and inverted VH locus/domains are diagrammed at the top of each panel (b, c). For comparison, the 3C-HTGTS results in the inverted region are shown in inverted orientation (b, bottom; c, bottom), and the highly utilized VHs in Fig. 1b are labeled at each panel (b, c). See Supplementary Data 1 for individual repeats of RC or 3’CBE interactions with entire IgH locus.
Figure. 4 |
Figure. 4 |. Wapl depletion activates IgH VH locus contraction and long-range VH utilization in G1-arrested v-Abl cells.
a, Western blotting to detect Wapl protein levels in the primary #5 cycling v-Abl cells and the derived Wapl-degron #5–9 v-Abl cells before (day0) and after STI&IAA&Dox treatment (day4) and cultured primary pro-B cells. One of the two experiments is shown. b, Western blotting results to determine relative expression of Wapl protein levels in cycling and G1 arrested primary #5 v-Abl cells and cultured primary pro-B cells. Average values ± s.d. of Wapl protein levels are shown. For comparison, the intensity of the Wapl band in G1-arrested primary #5 v-Abl cells is set as 1.0. Average value is indicated at each bar. n, number of independent repeats. Indicated P values were calculated using unpaired two-tailed t-test. c, Average 3C-HTGTS signal counts ± s.e.m. across the four VH domains in cultured RAG1-deficient primary pro-B cells (top), G1-arrested RAG1-deficient v-Abl cells without (middle) or with Wapl depletion (bottom). n, number of independent experiments. For comparison, 15 representative major interaction peaks/clusters are shown as in Fig. 3b. d, Average utilization frequencies ± s.d. of all VH segments in RAG1-complemented, G1-arrested Wapl-degron v-Abl cells without (Untreated) or with (IAA&Dox) Wapl depletion are indicated. Average percentage ± s.d. of VHDJH and DJH rearrangements are shown. n, number of independent experiments. See Supplementary Table 2 and Methods for more details.

Similar articles

Cited by

References

    1. Zhang Y et al. The fundamental role of chromatin loop extrusion in physiological V(D)J recombination. Nature 573, 600–604, doi:10.1038/s41586-019-1547-y (2019). - DOI - PMC - PubMed
    1. Ba Z et al. CTCF orchestrates long-range cohesin-driven V(D)J recombinational scanning. Nature, doi:10.1038/s41586-020-2578-0 (2020). - DOI - PMC - PubMed
    1. Hu J et al. Chromosomal Loop Domains Direct the Recombination of Antigen Receptor Genes. Cell 163, 947–959, doi:10.1016/j.cell.2015.10.016 (2015). - DOI - PMC - PubMed
    1. Guo C et al. CTCF-binding elements mediate control of V(D)J recombination. Nature 477, 424–430, doi:10.1038/nature10495 (2011). - DOI - PMC - PubMed
    1. Jain S, Ba Z, Zhang Y, Dai HQ & Alt FW CTCF-Binding Elements Mediate Accessibility of RAG Substrates During Chromatin Scanning. Cell 174, 102–116 e114, doi:10.1016/j.cell.2018.04.035 (2018). - DOI - PMC - PubMed

Publication types

MeSH terms