. 2021 Mar;591(7848):117-123.
doi: 10.1038/s41586-020-03129-z. Epub 2021 Jan 13.

Chaperone-mediated autophagy sustains haematopoietic stem-cell function

Affiliations

Chaperone-mediated autophagy sustains haematopoietic stem-cell function

Shuxian Dong et al. Nature. 2021 Mar.

Abstract

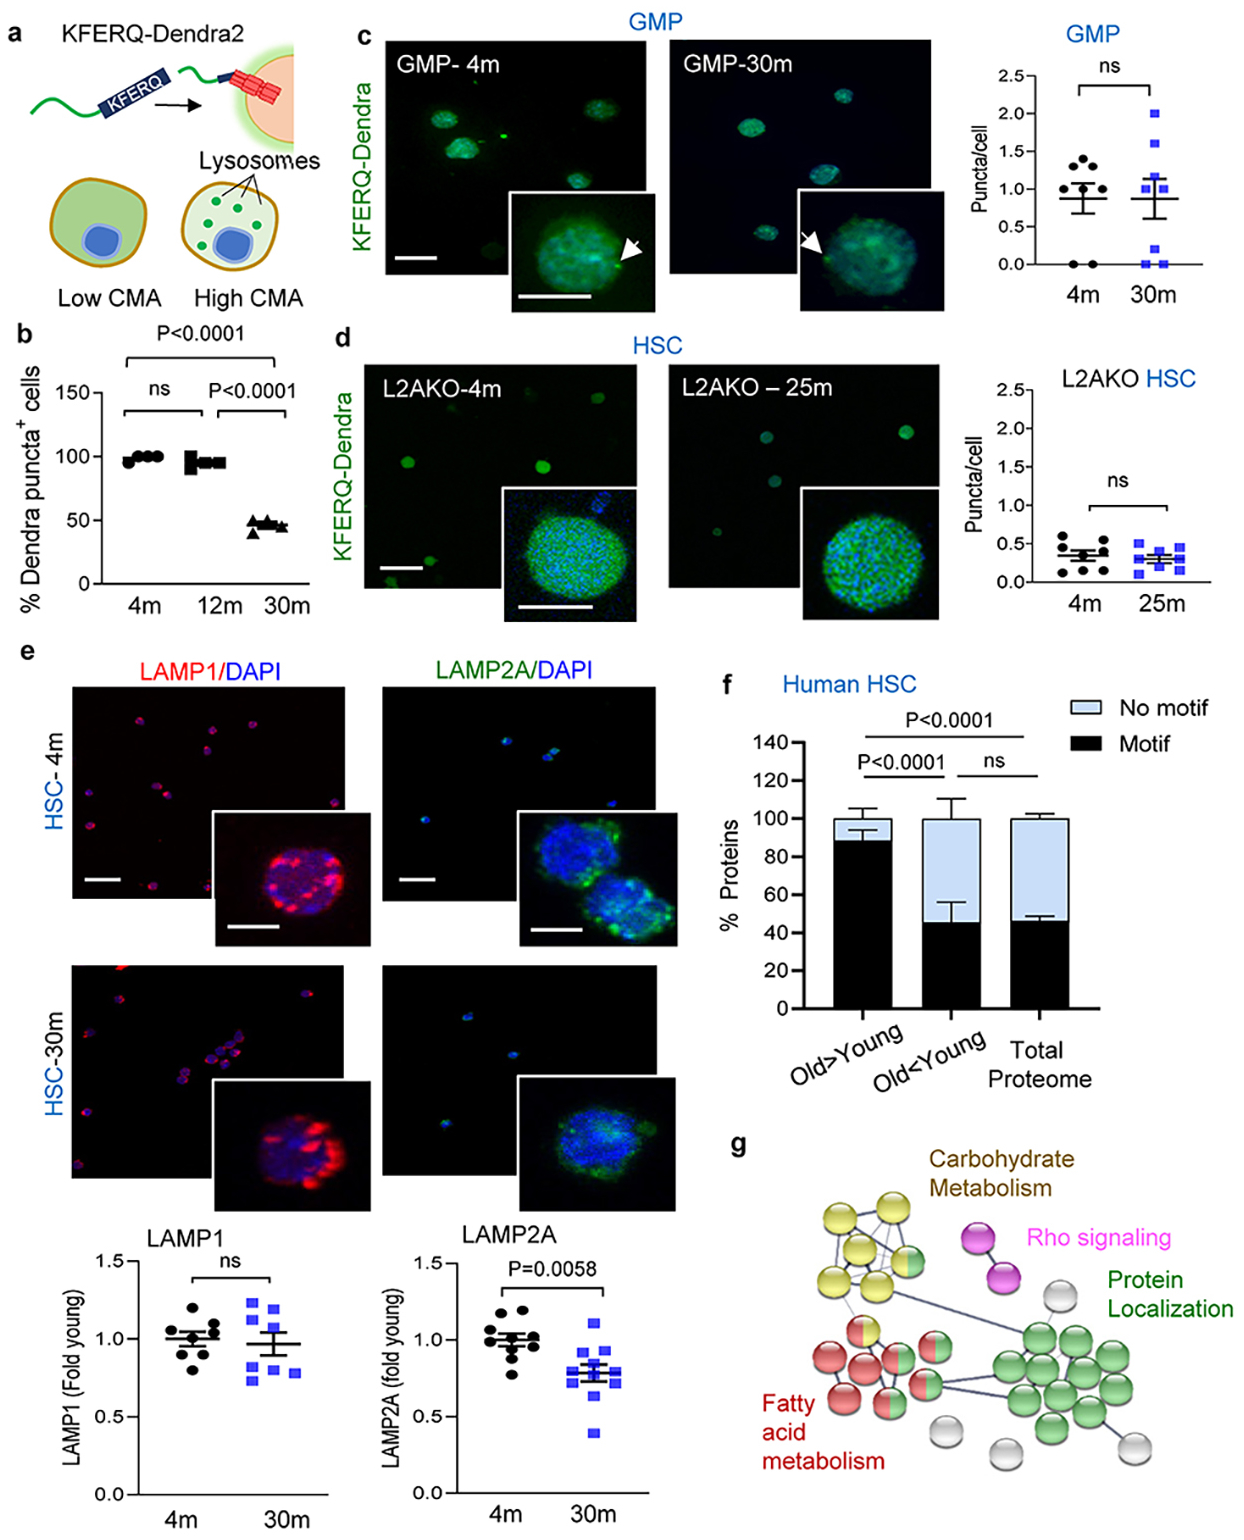
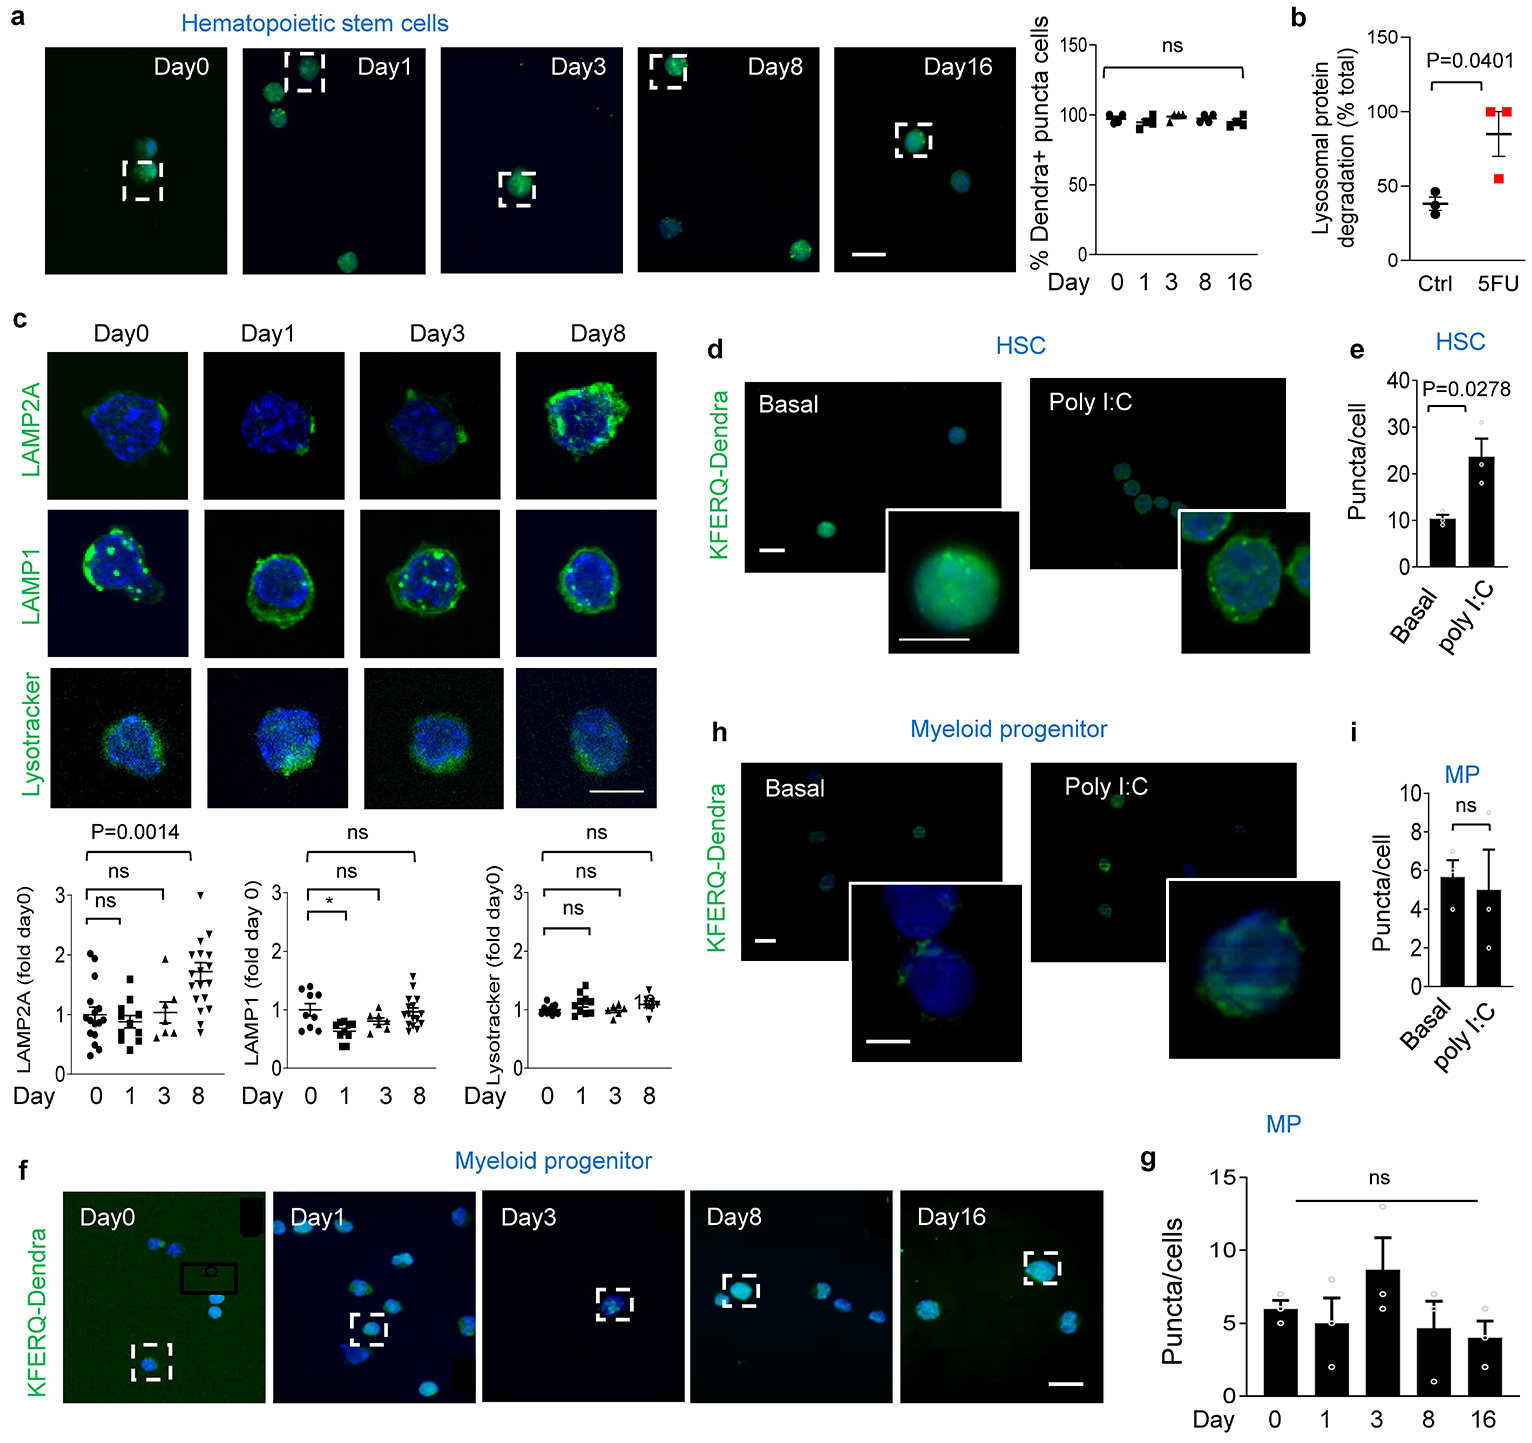
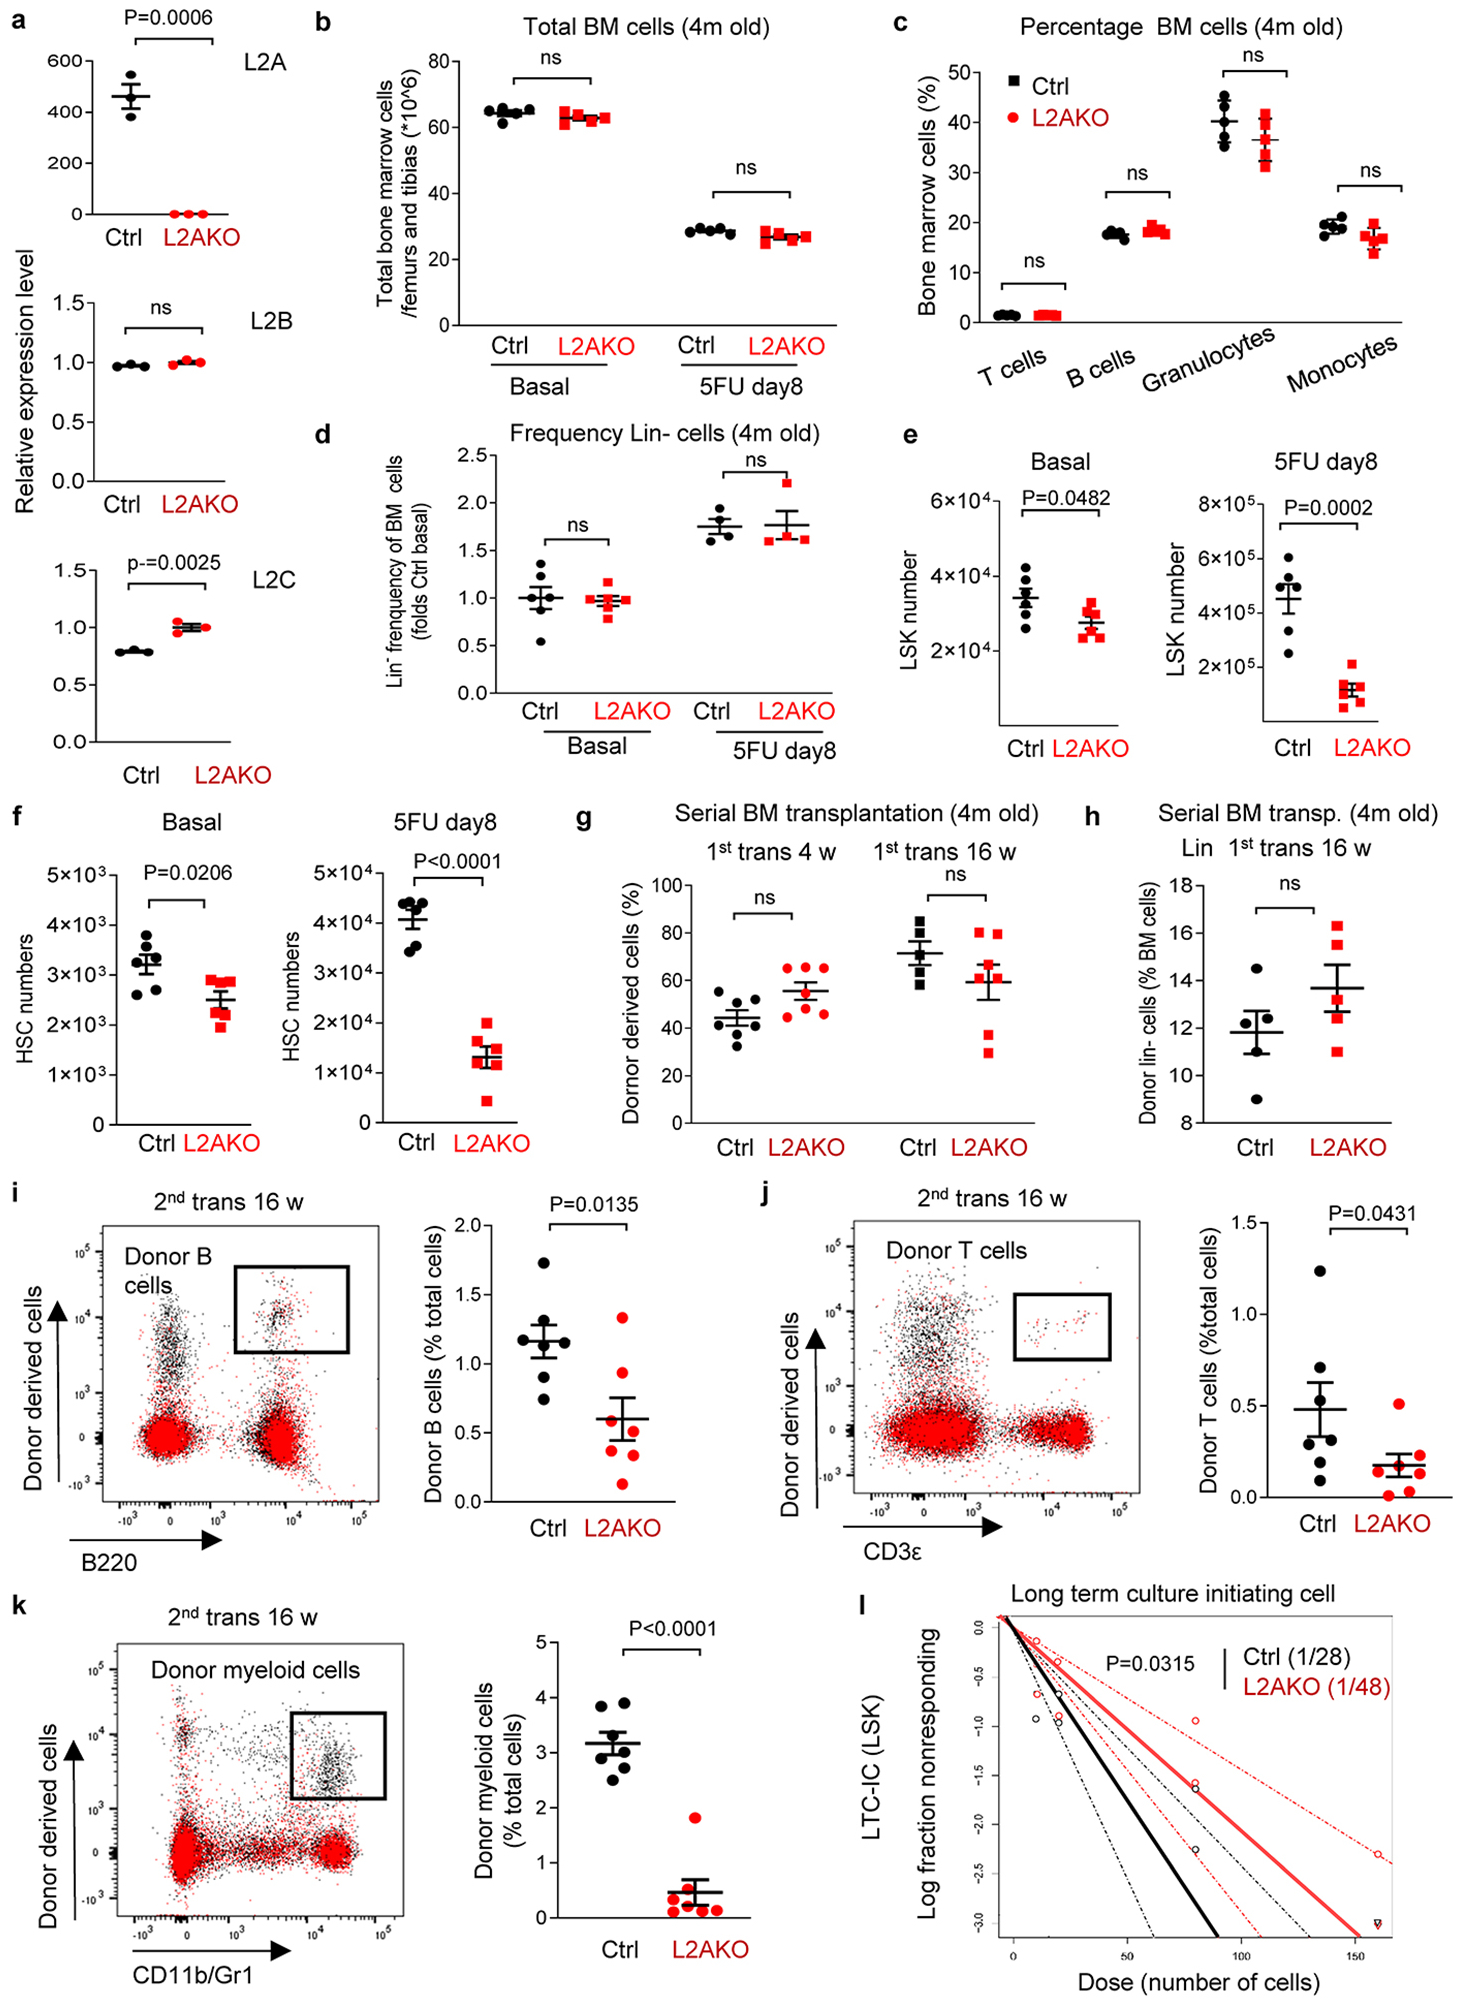
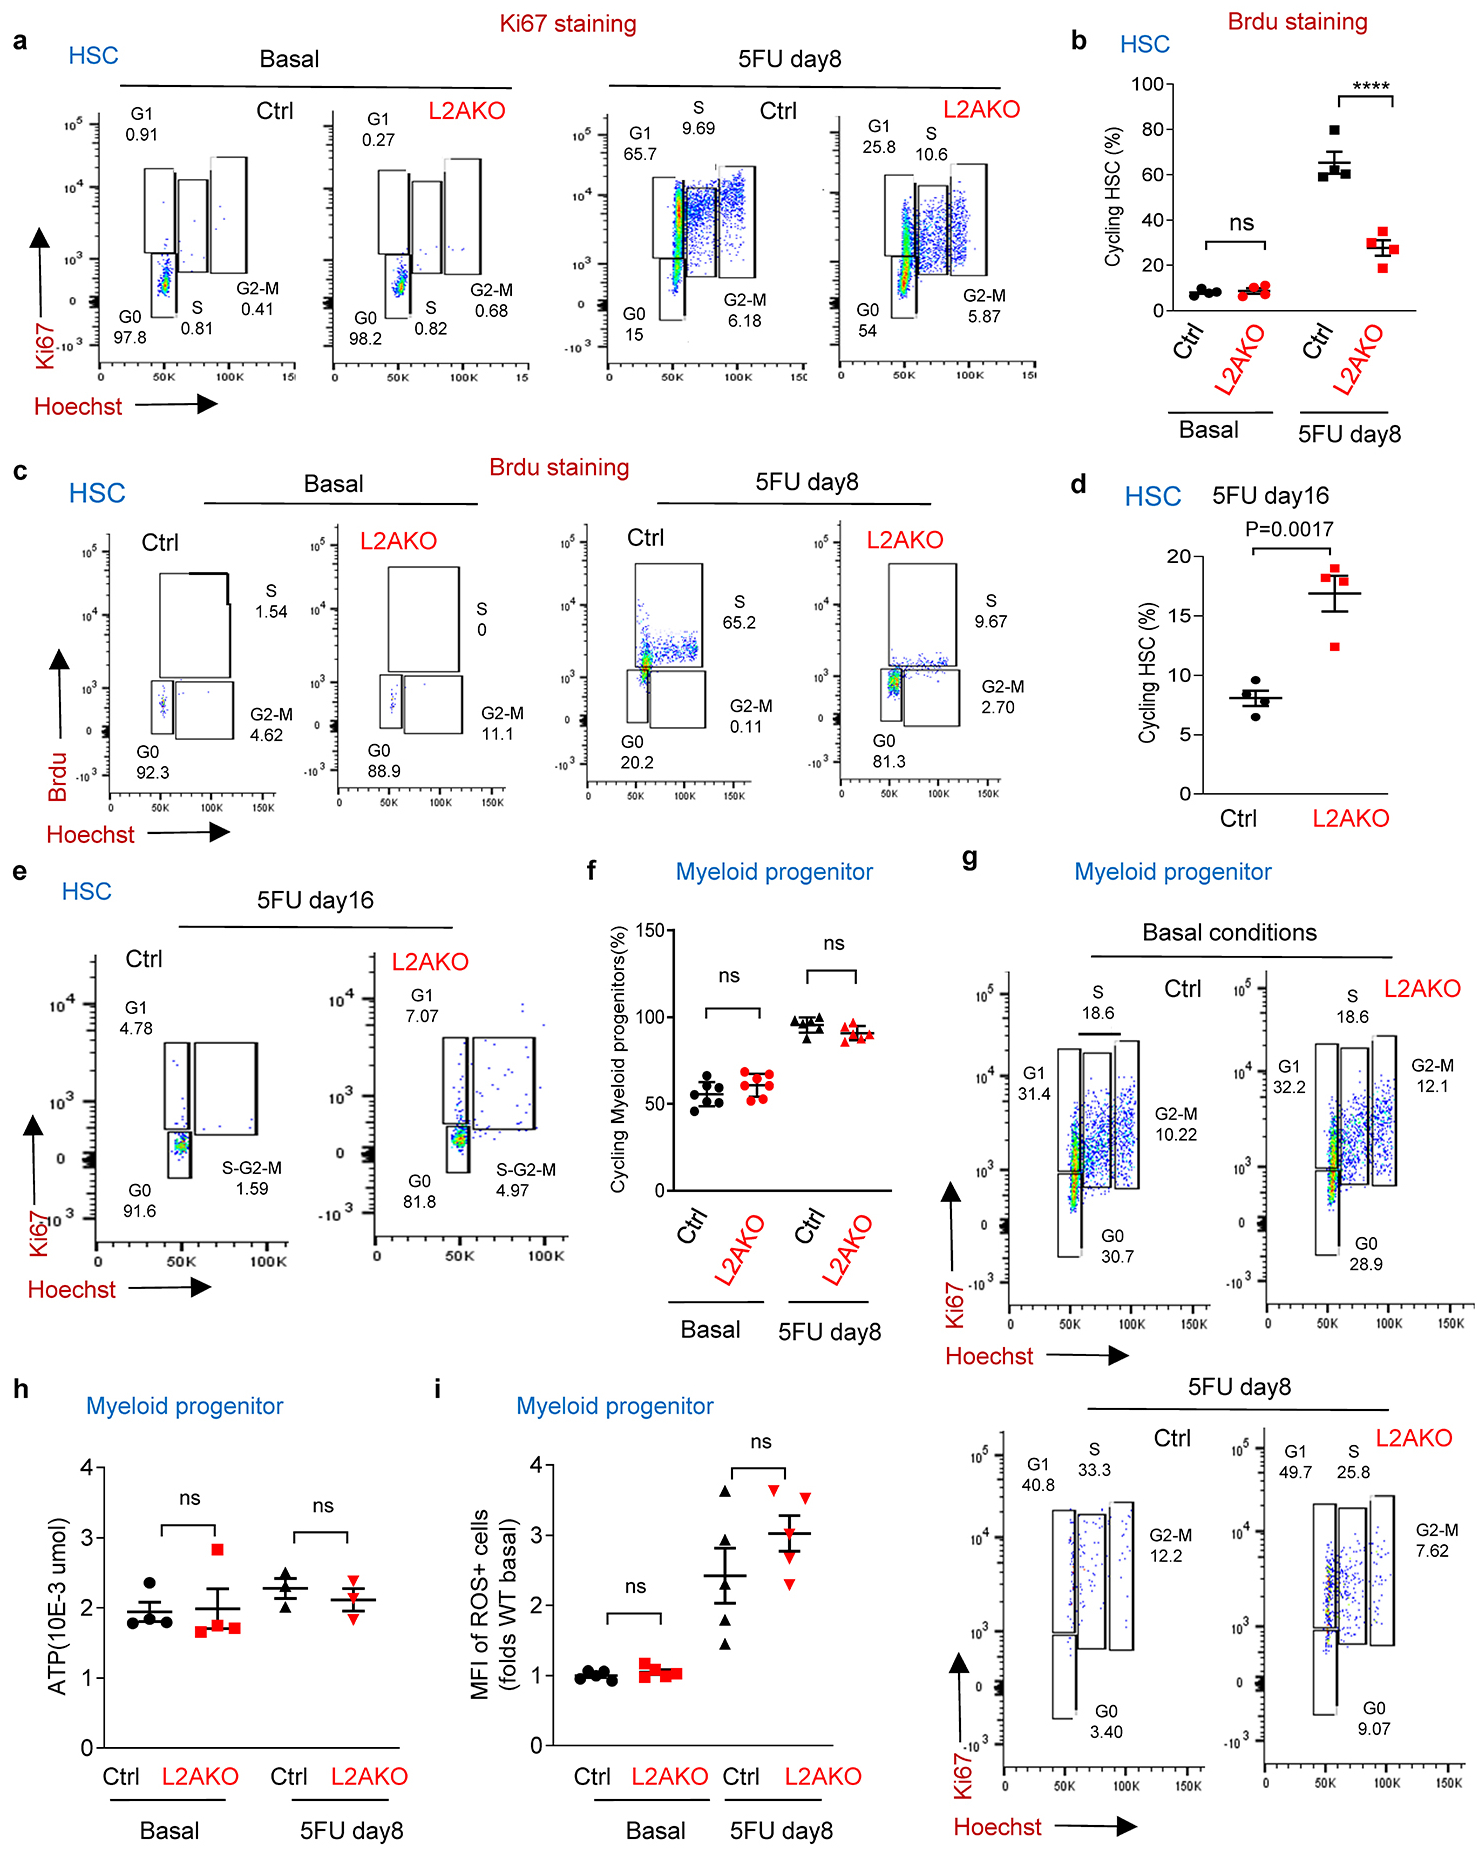
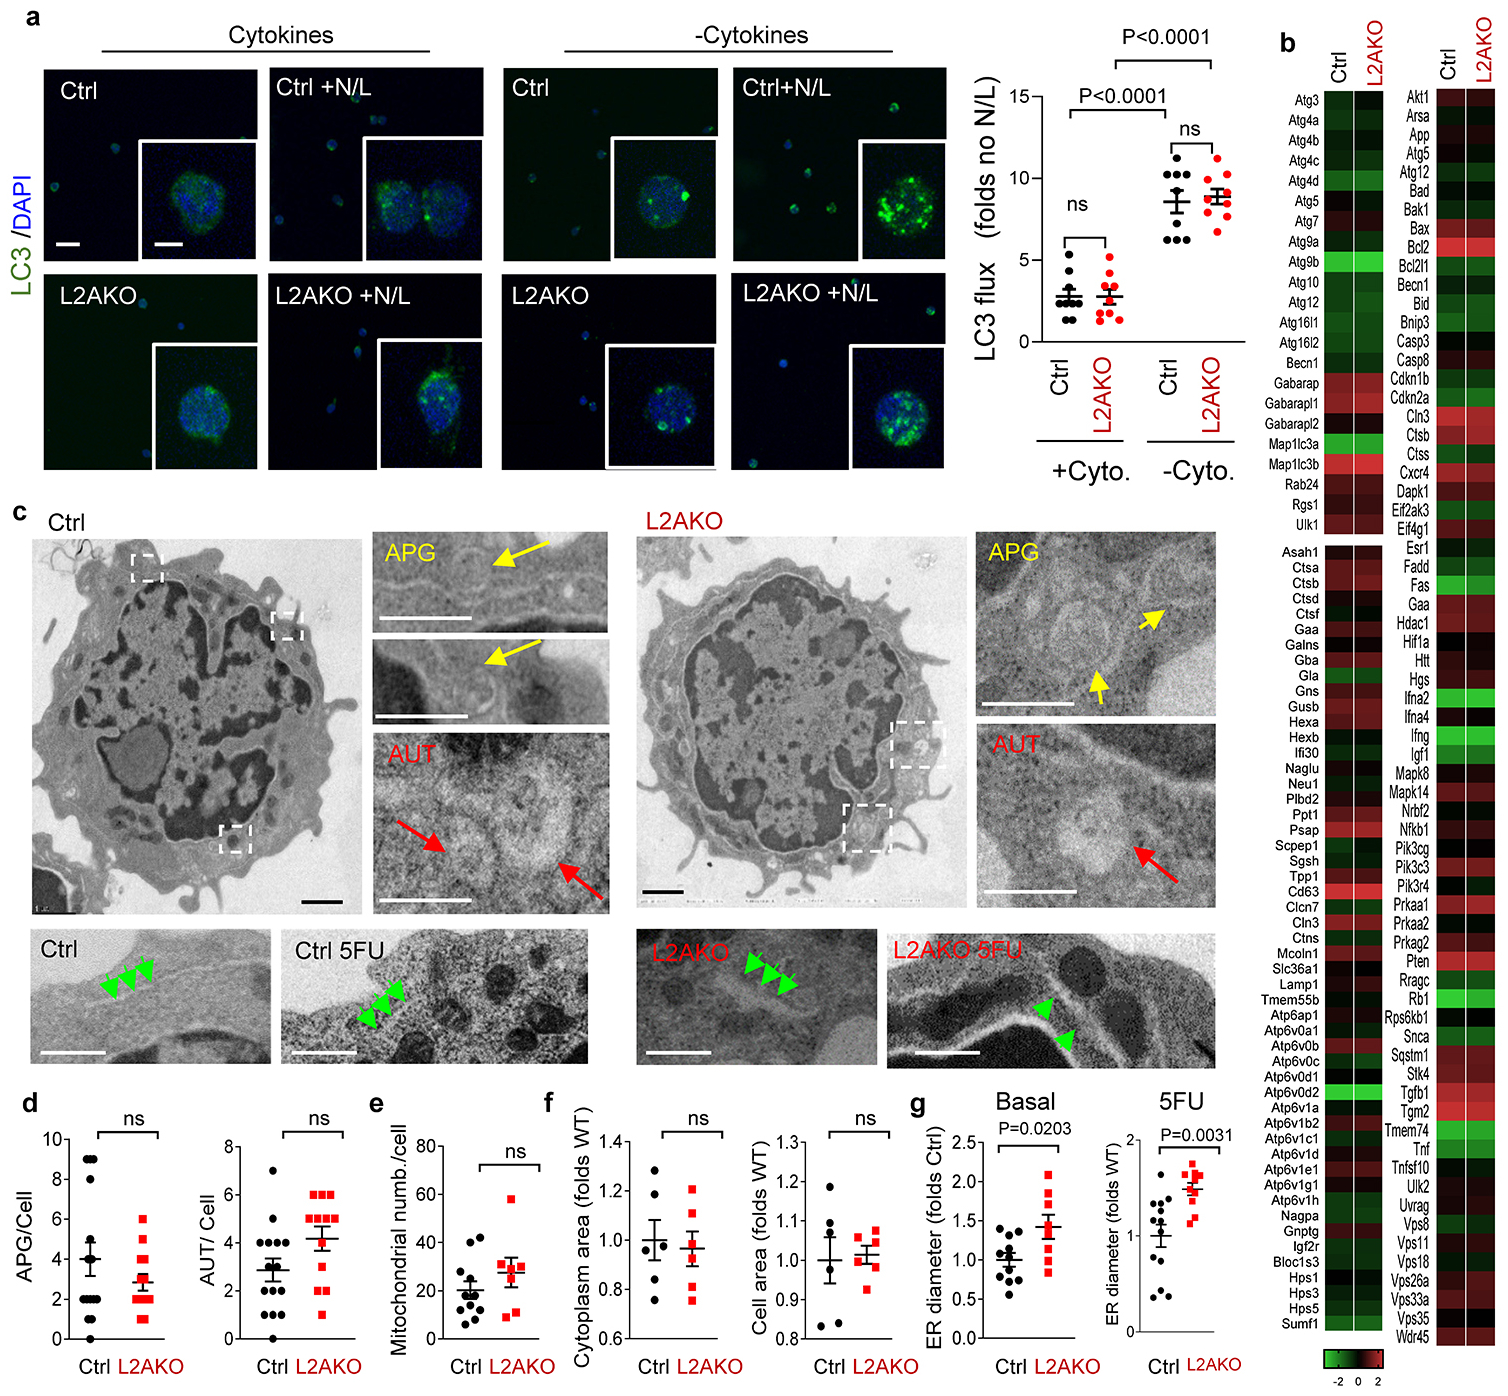
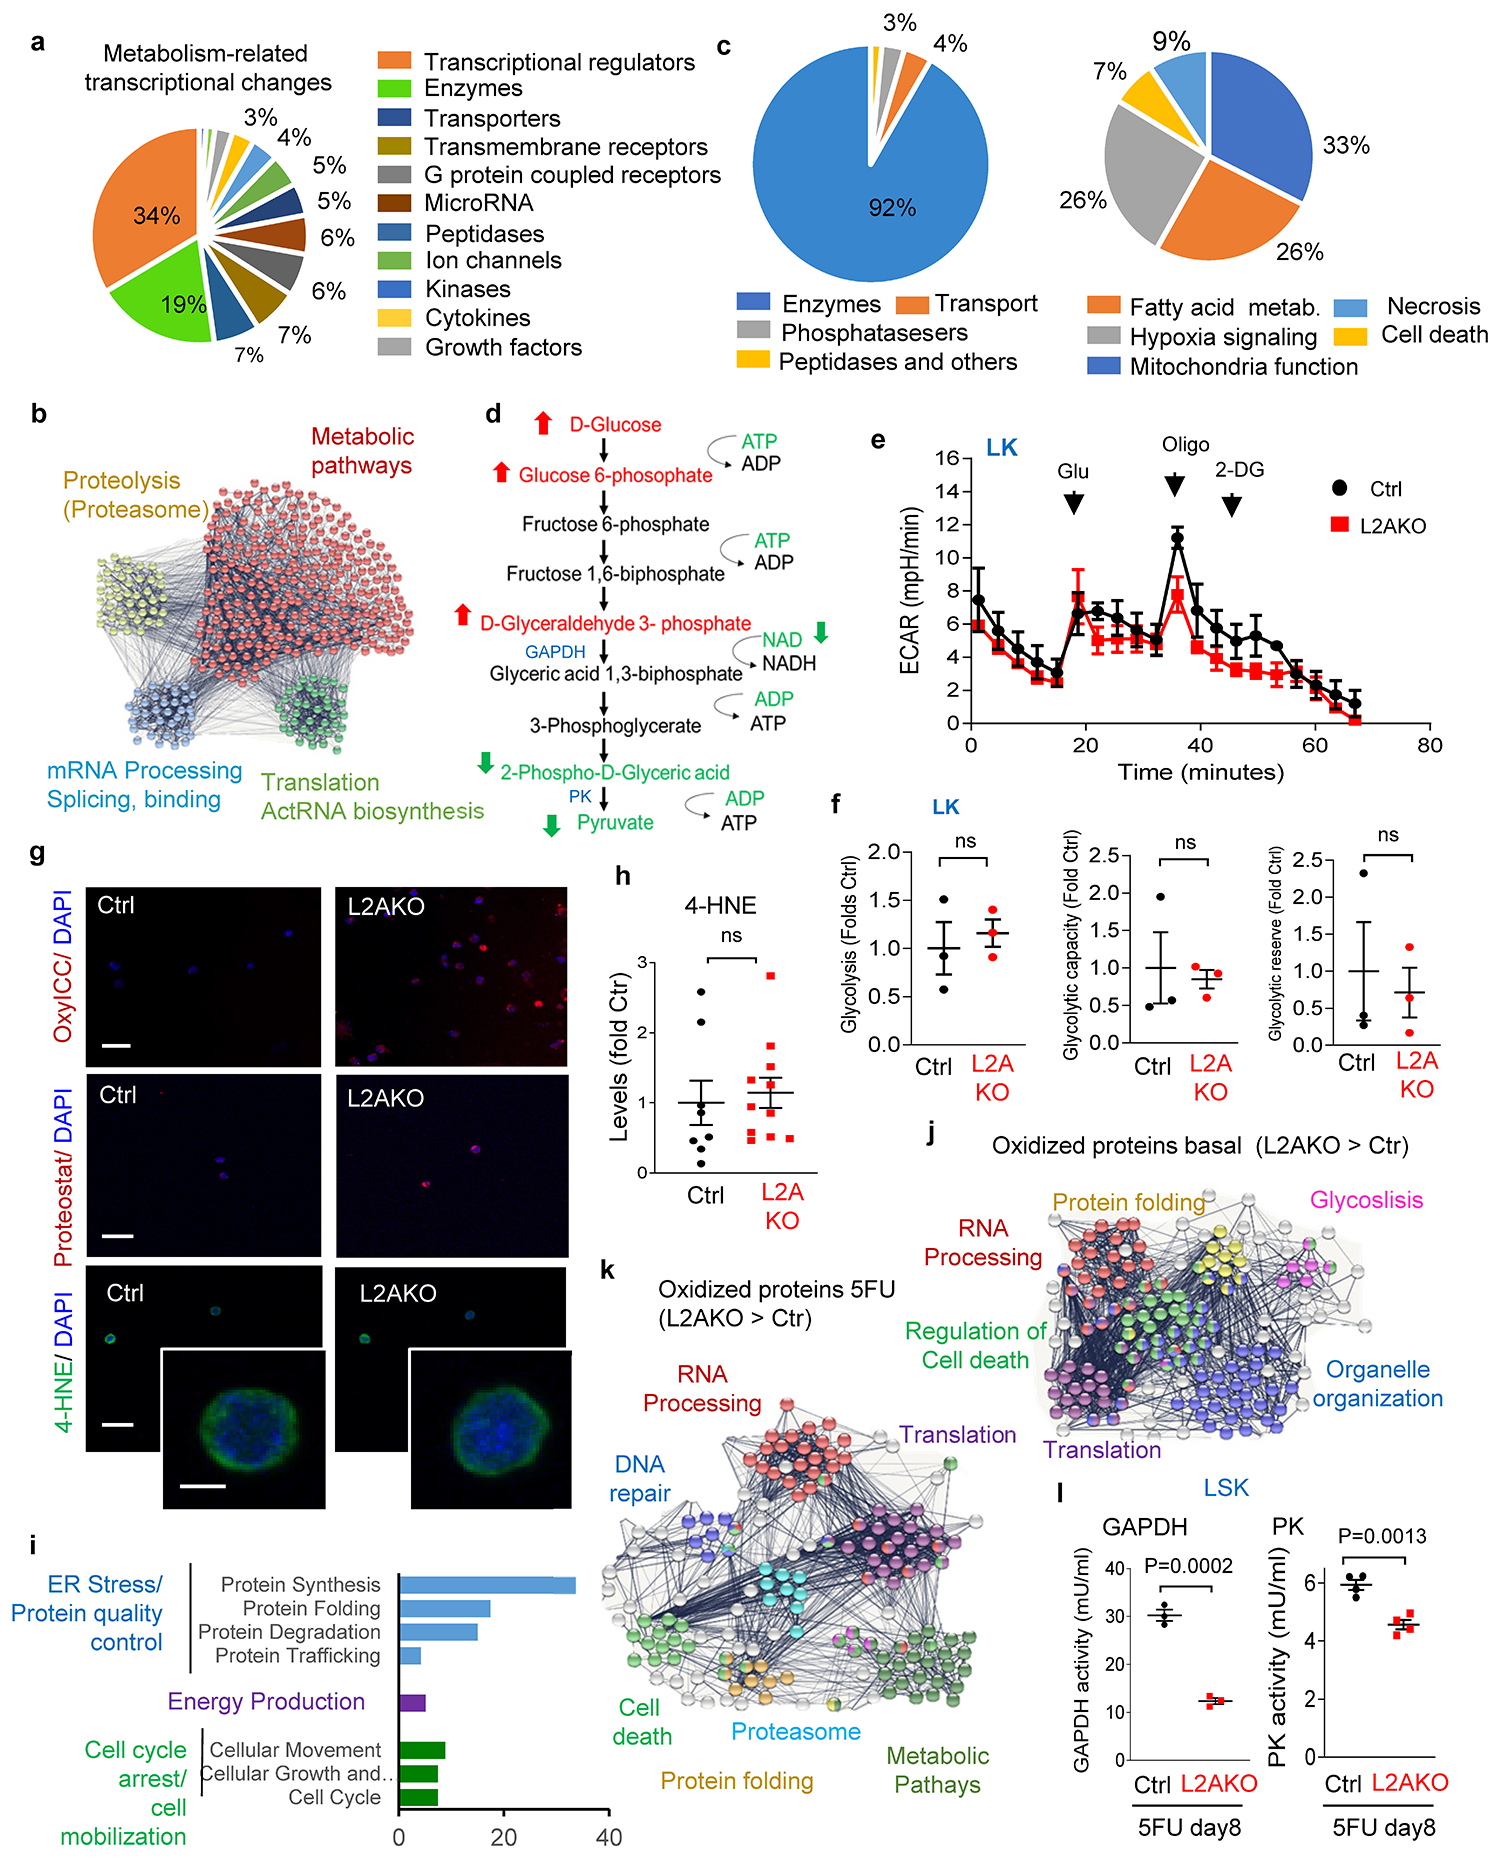
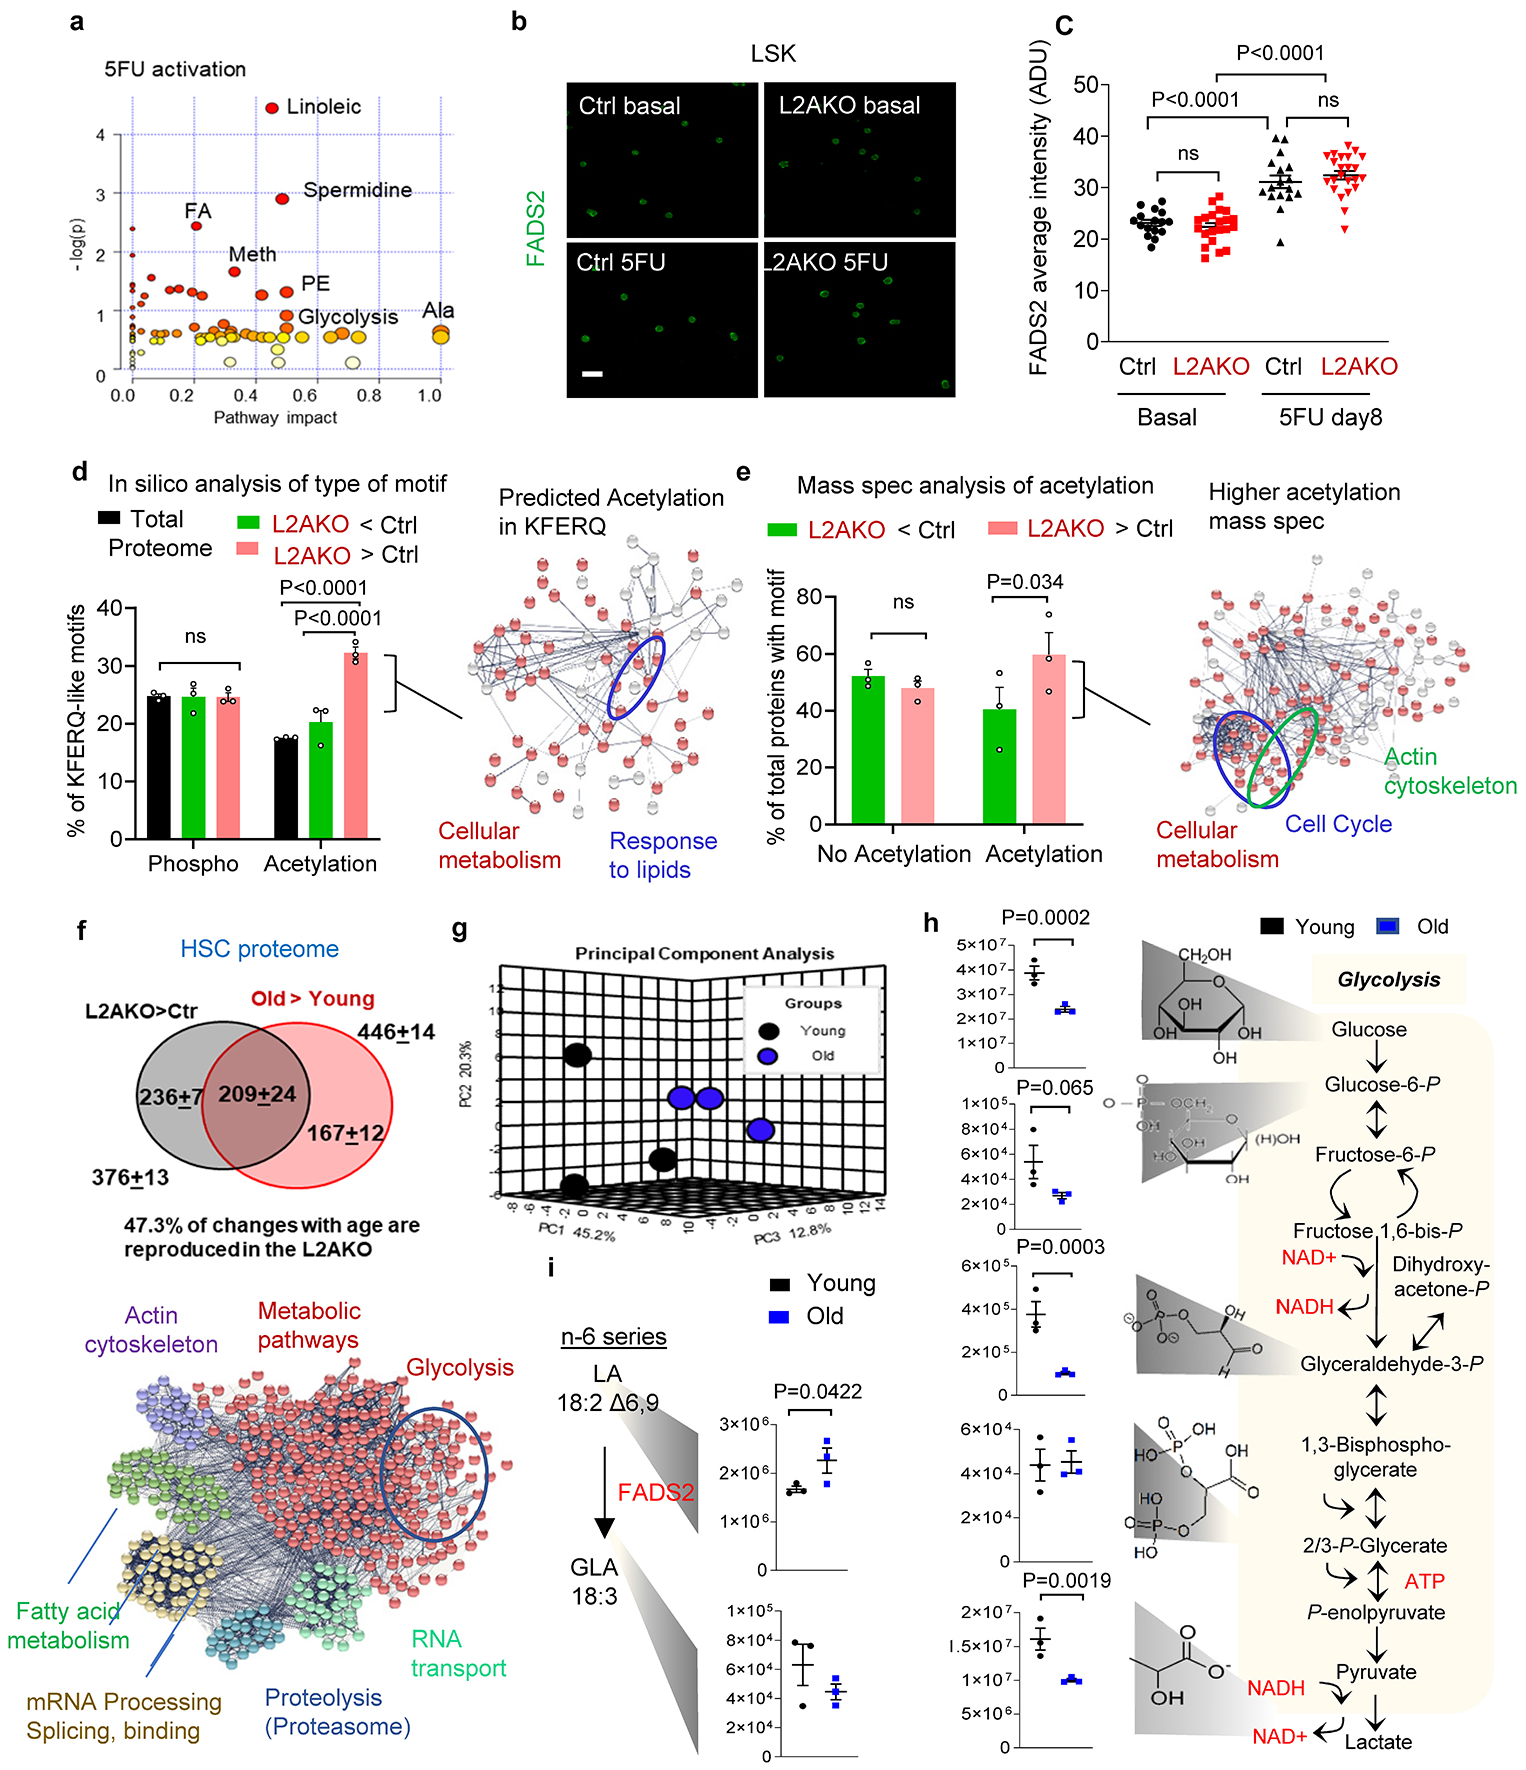
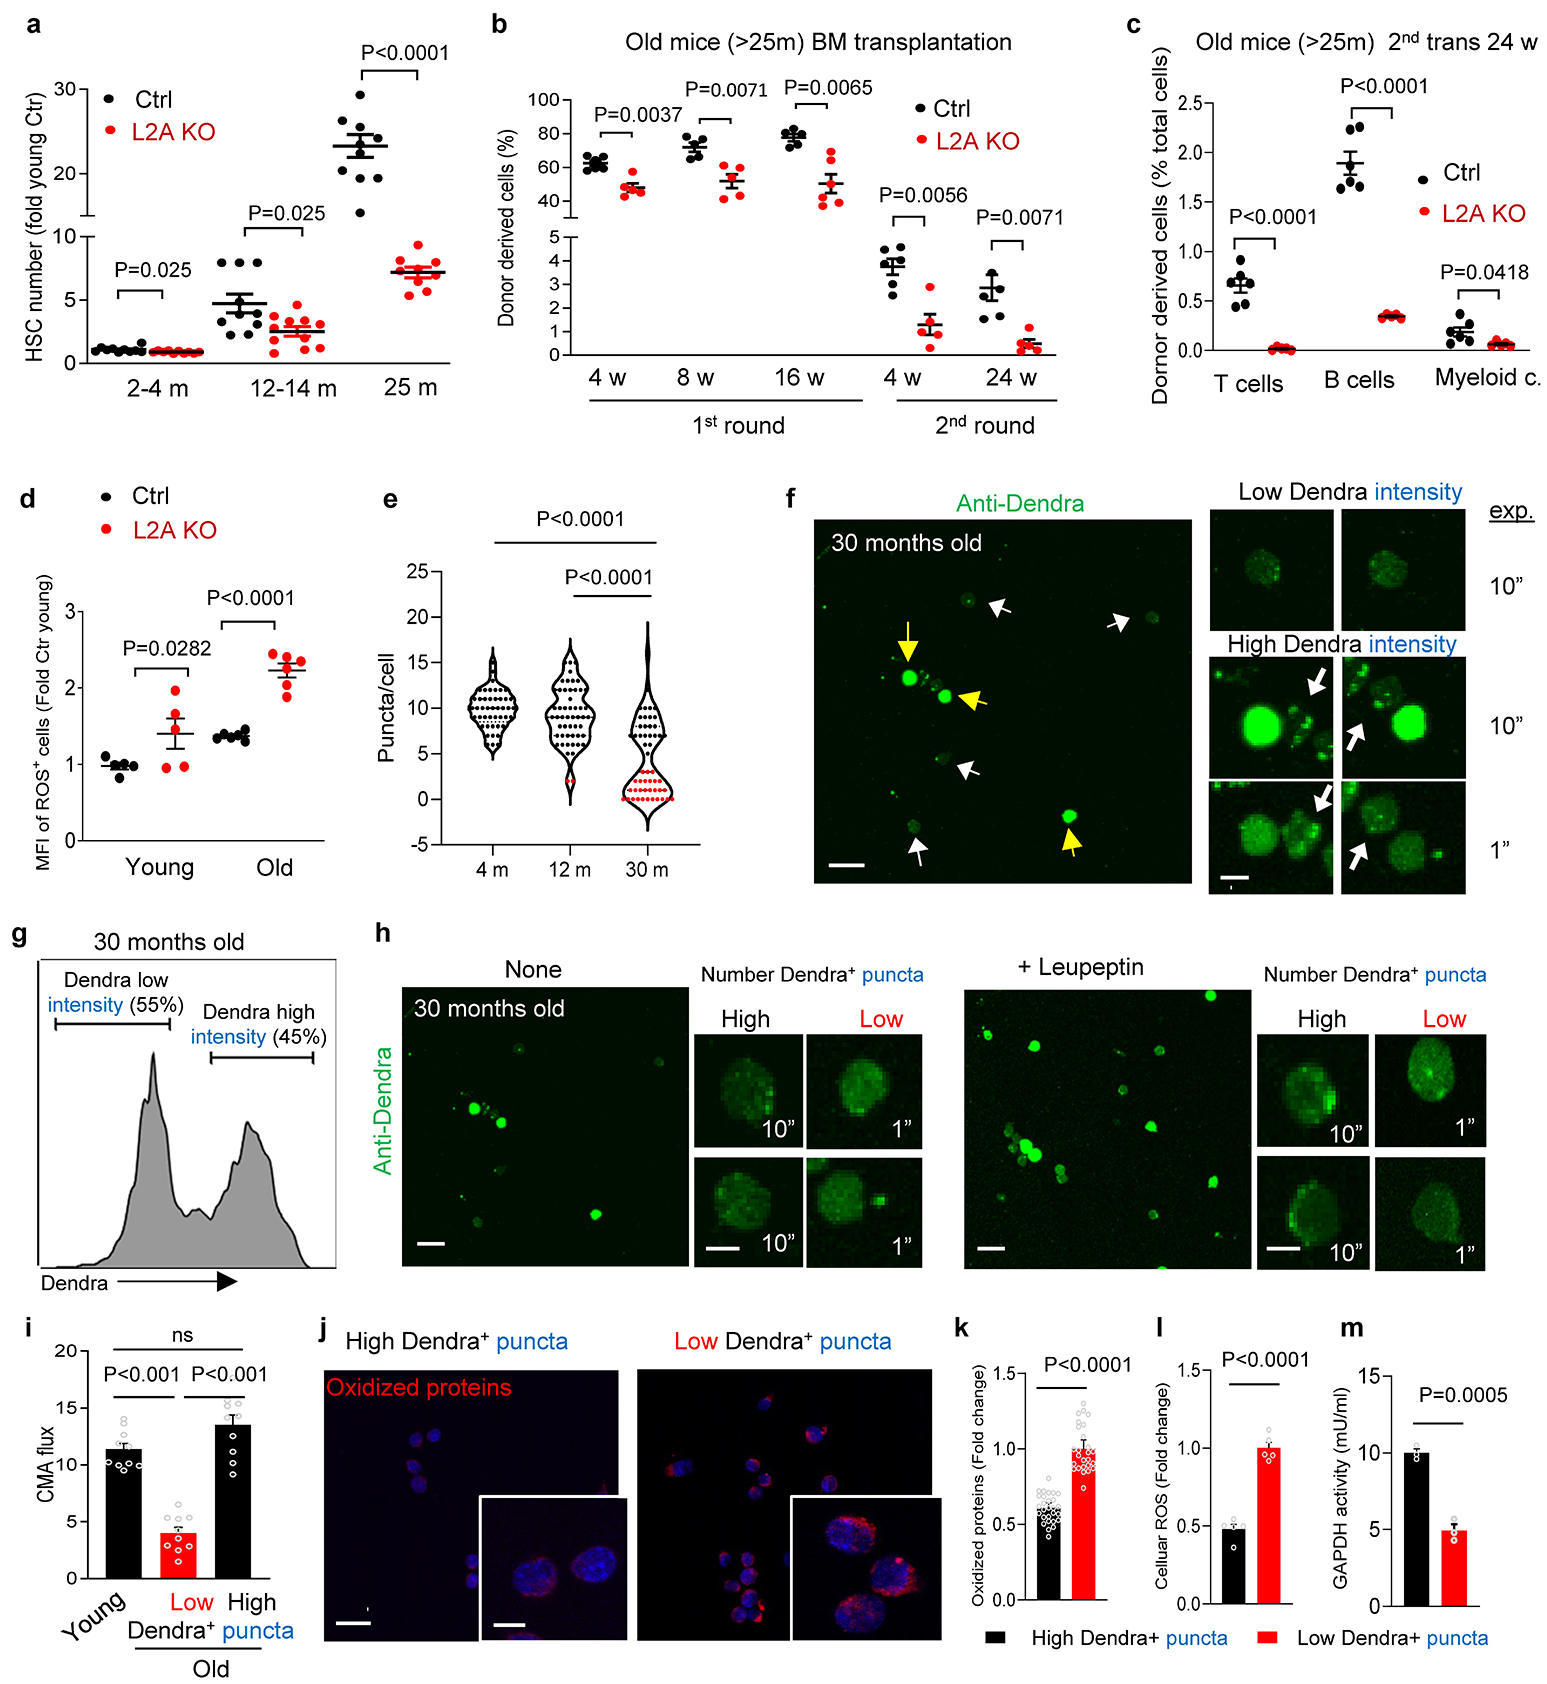
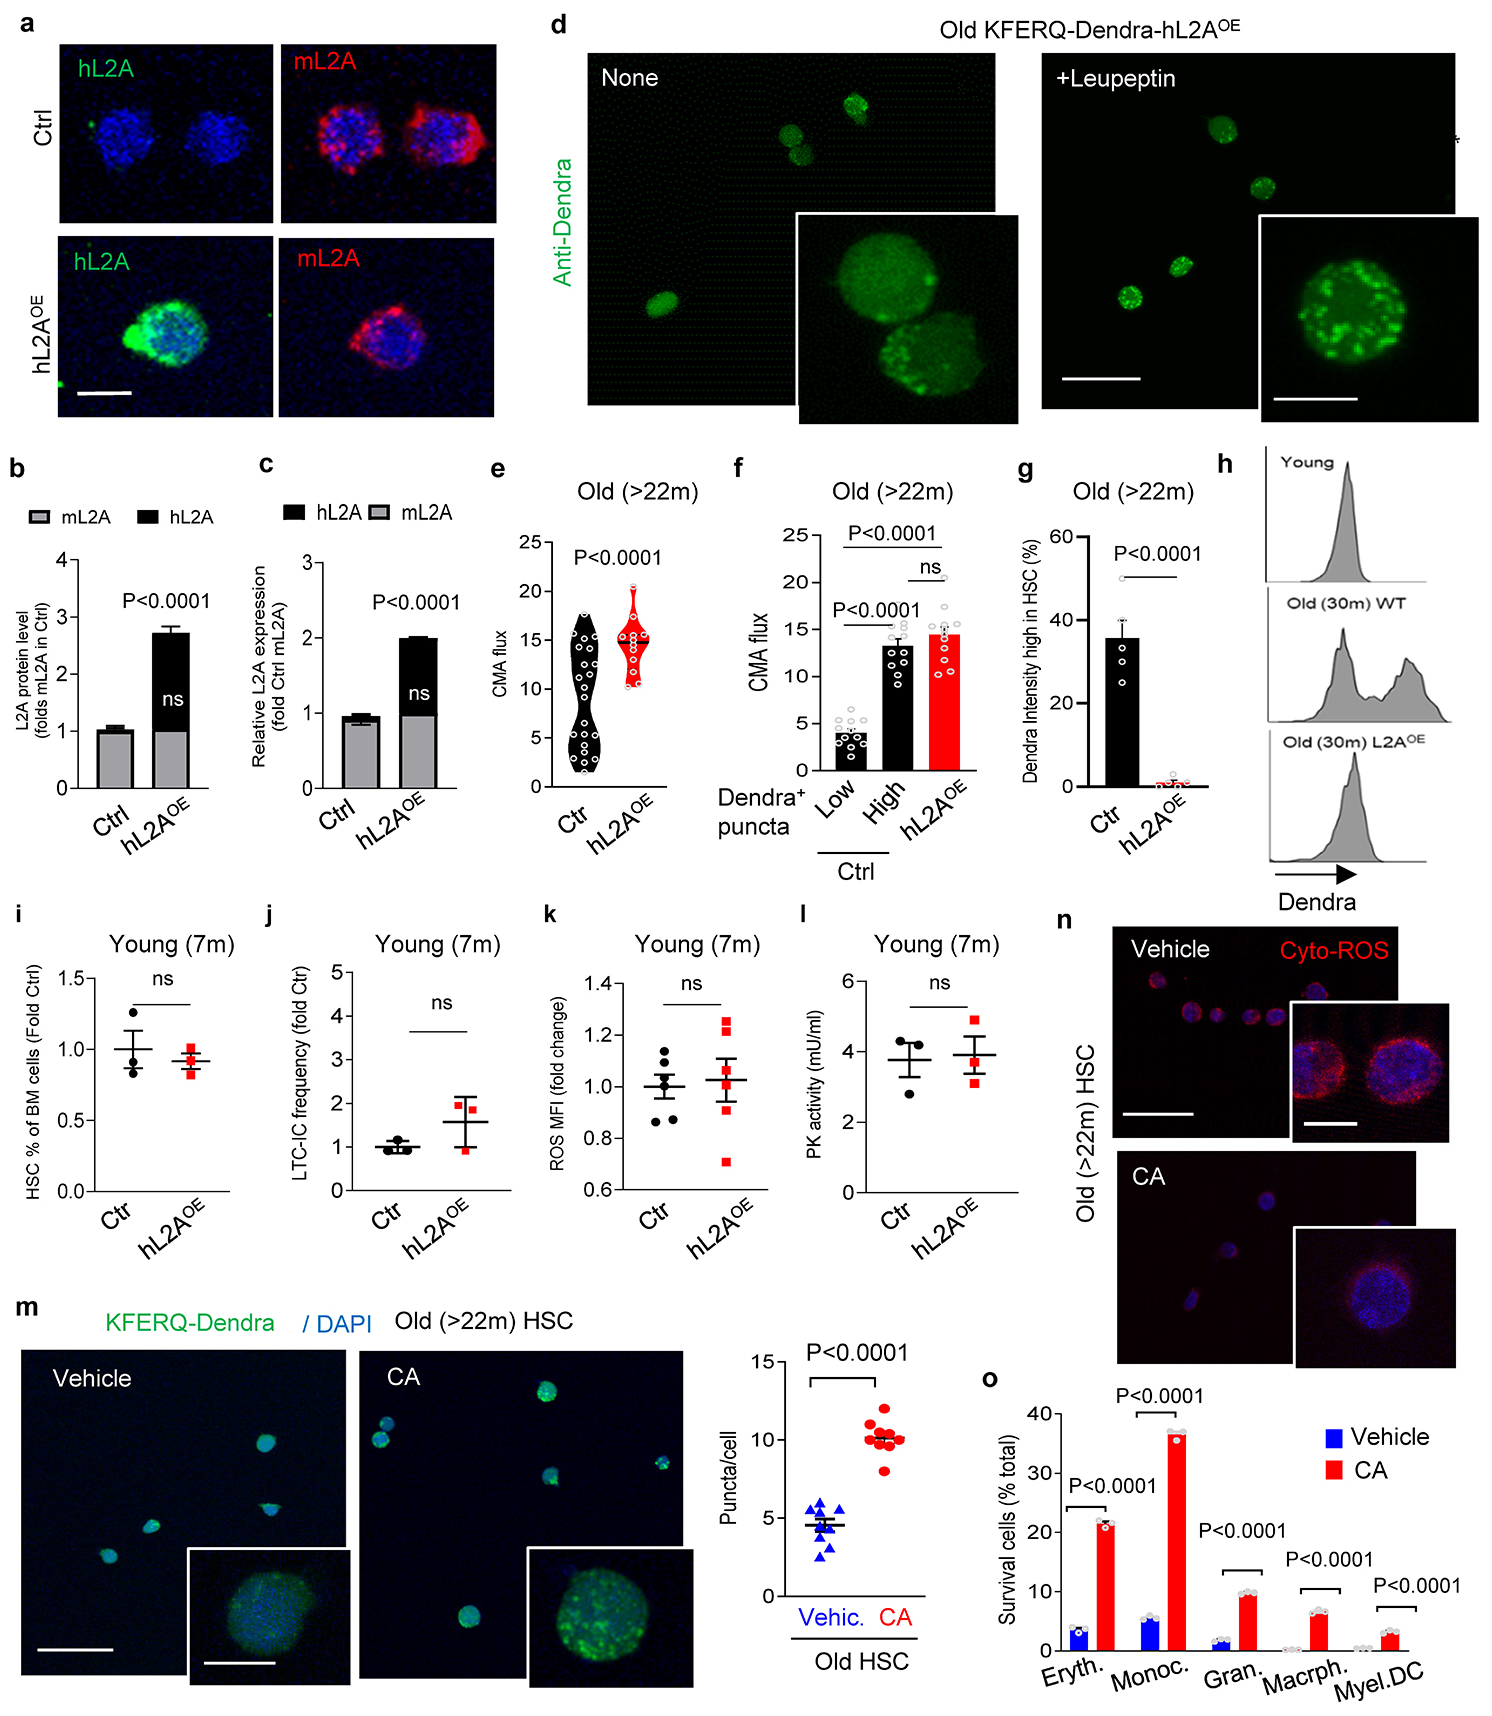
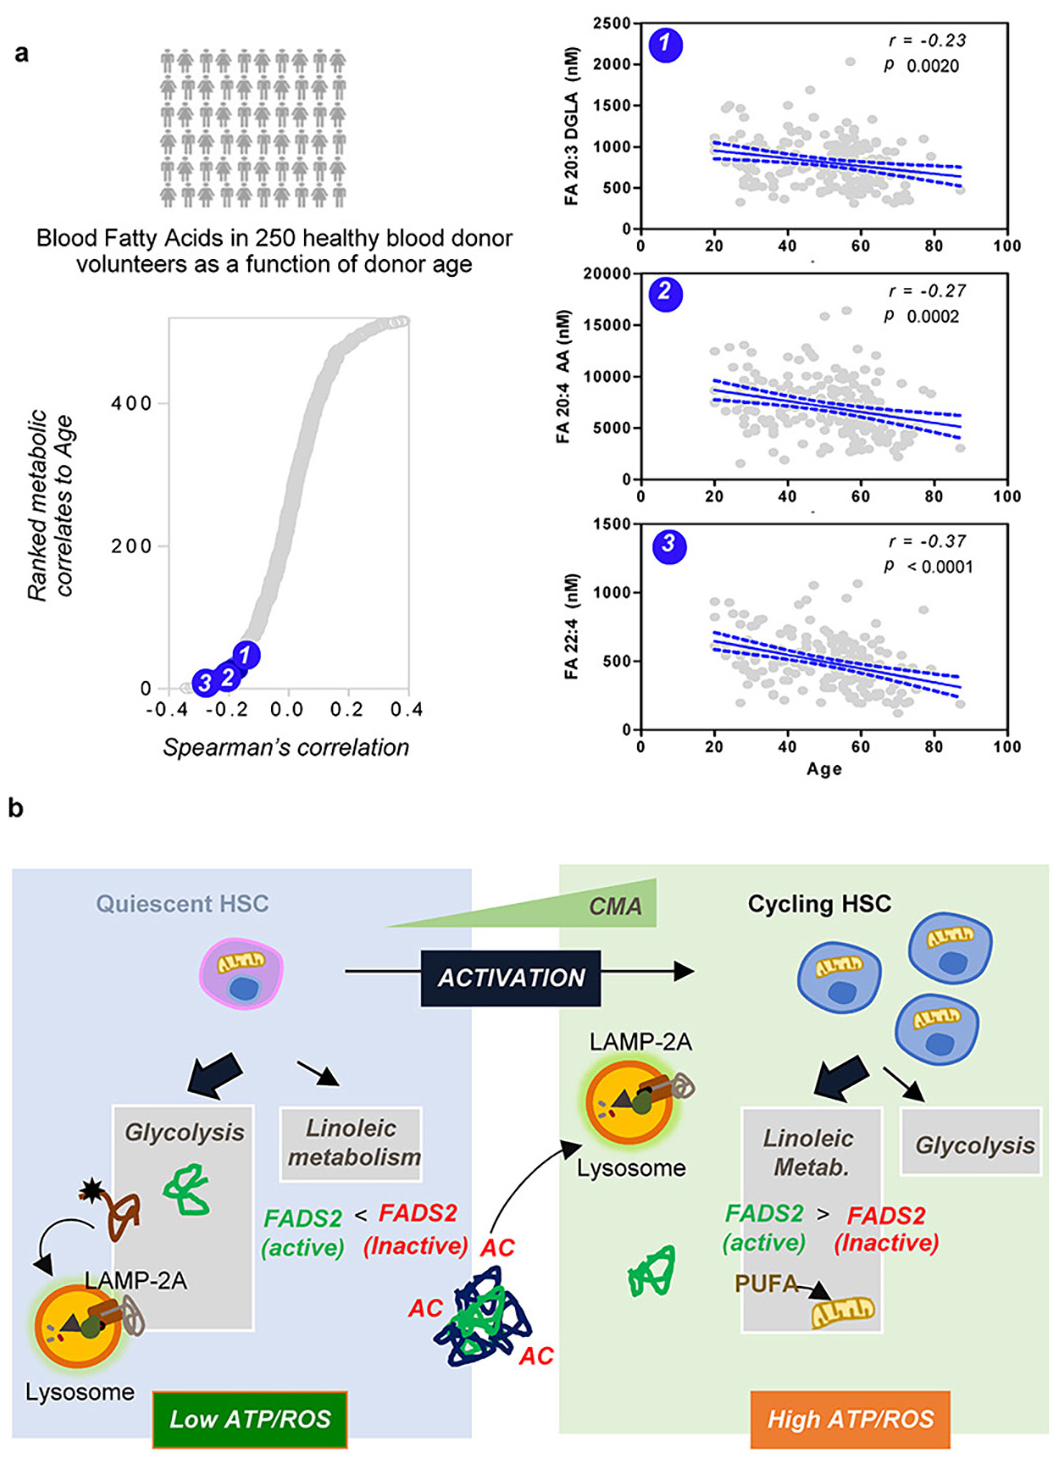
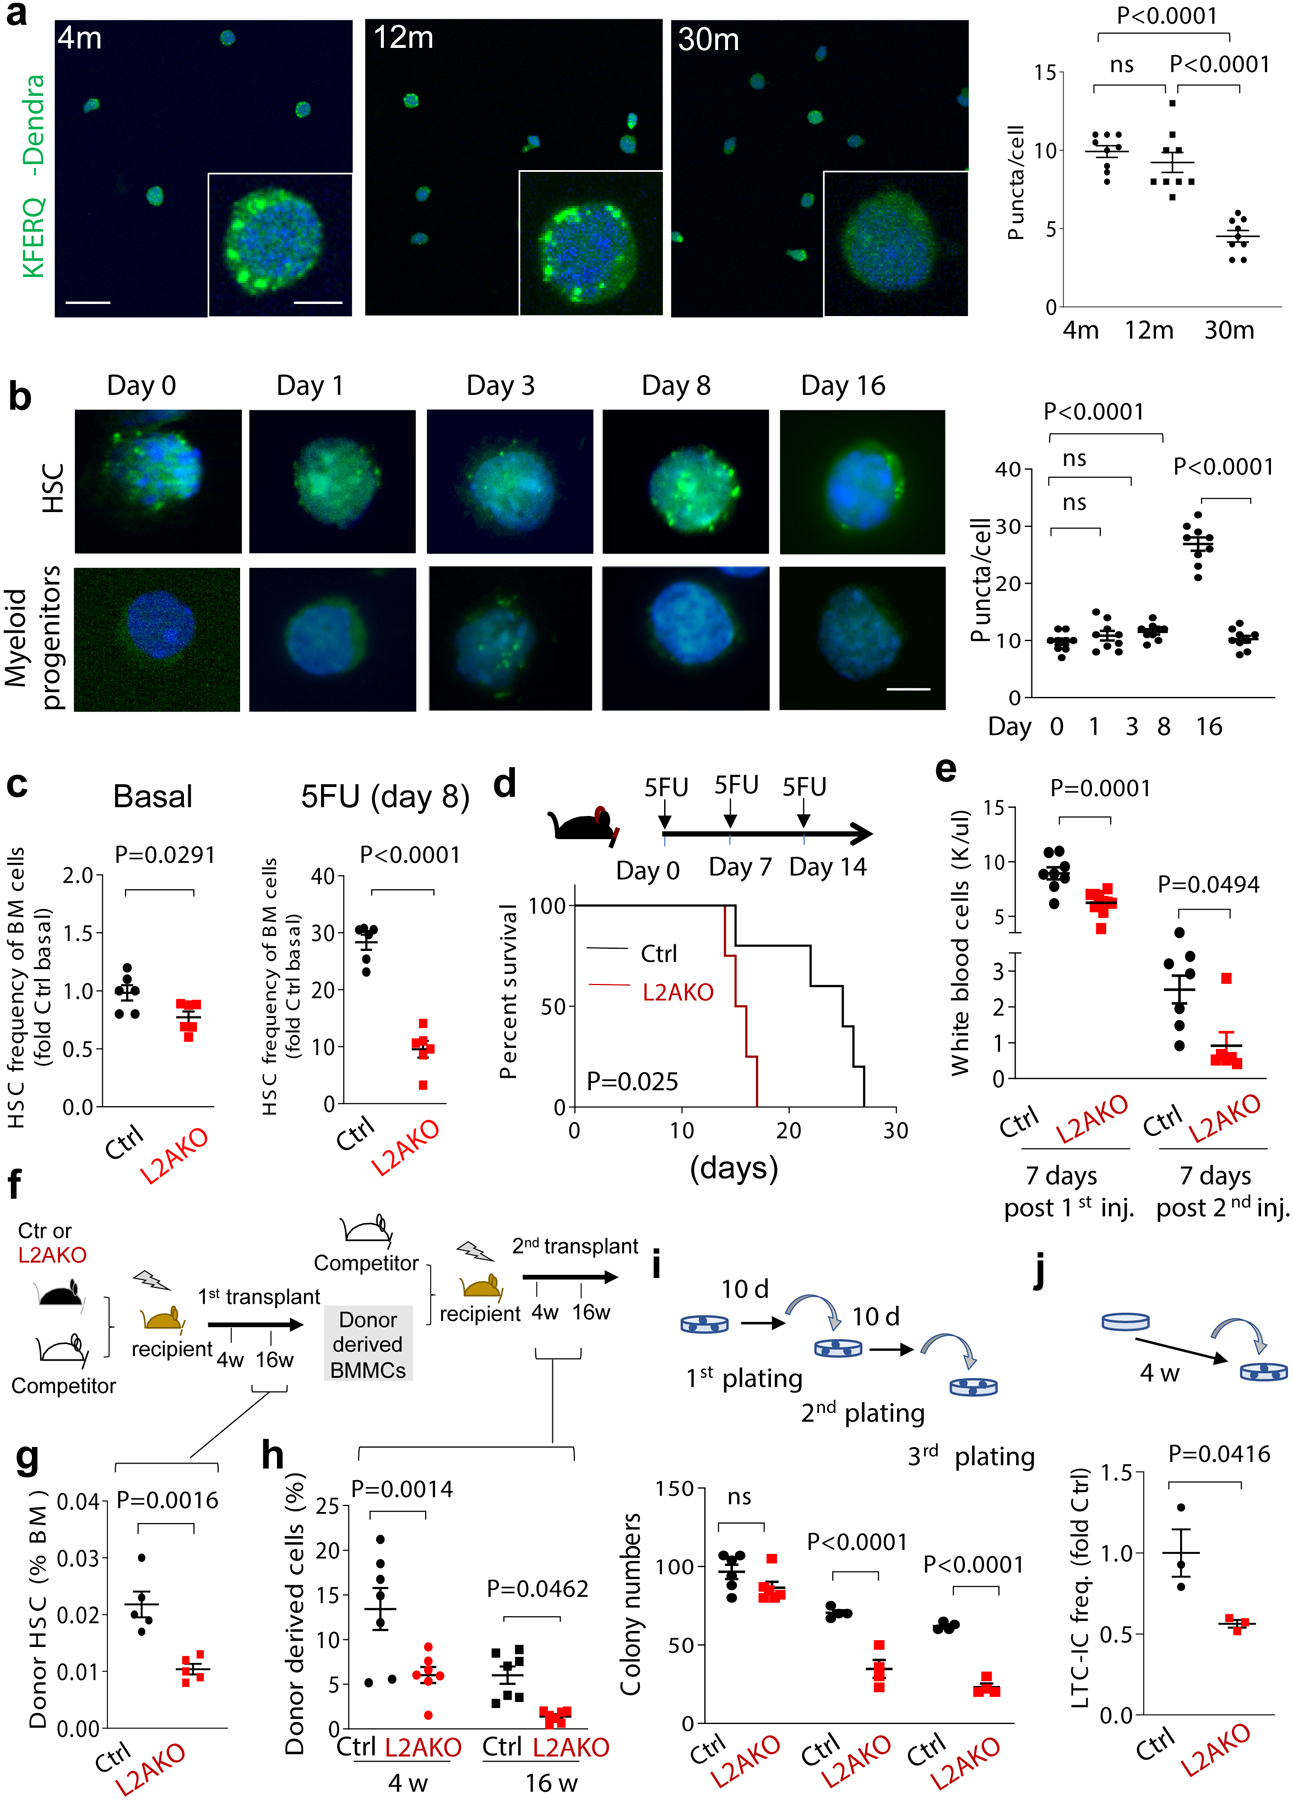
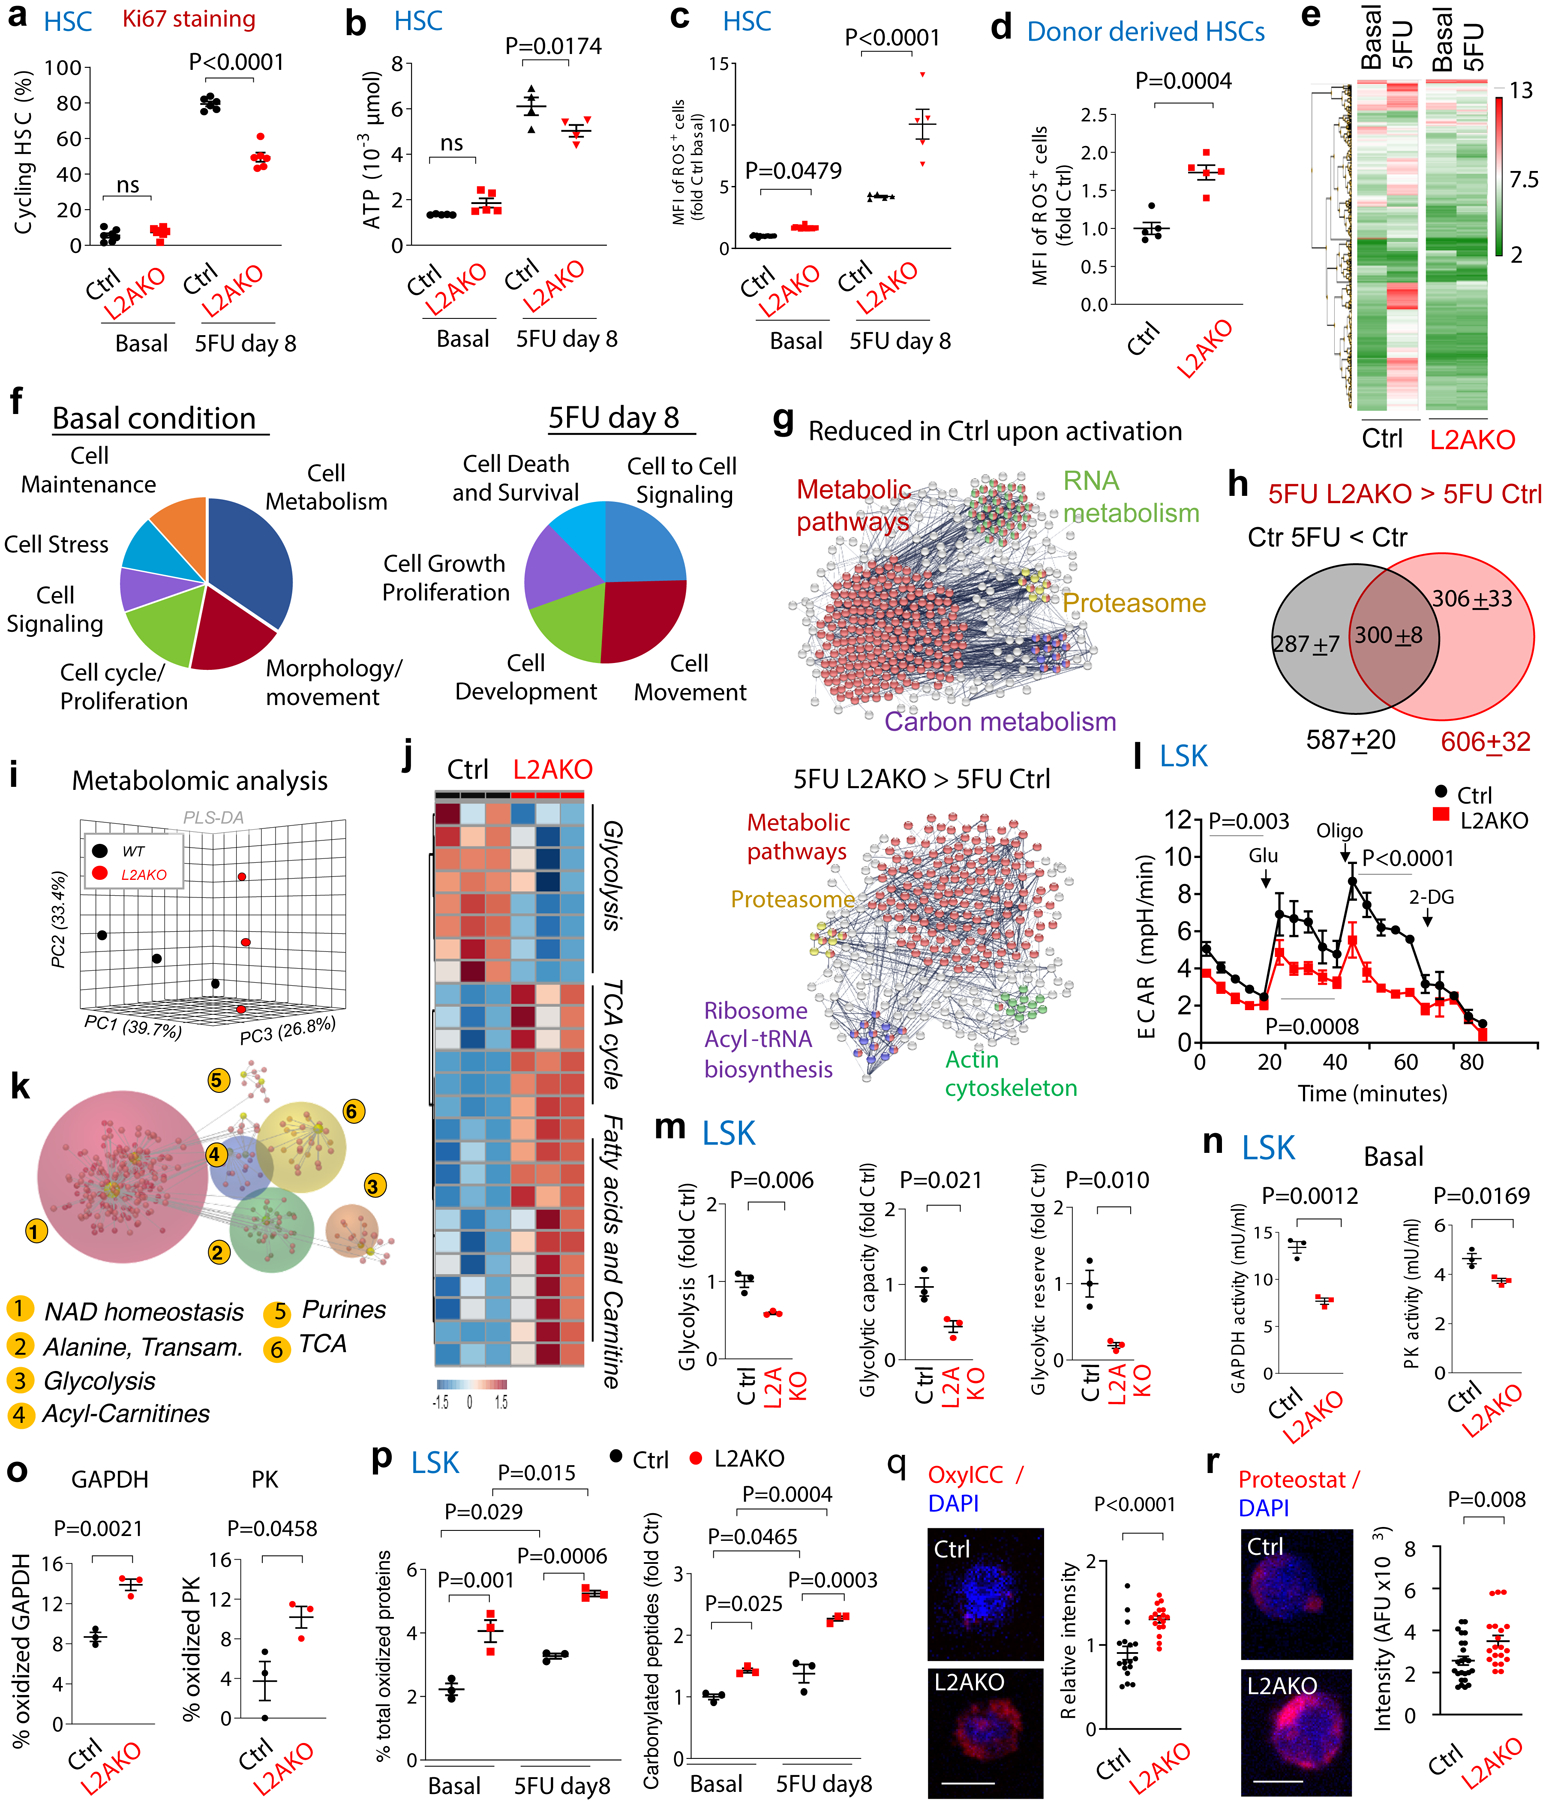
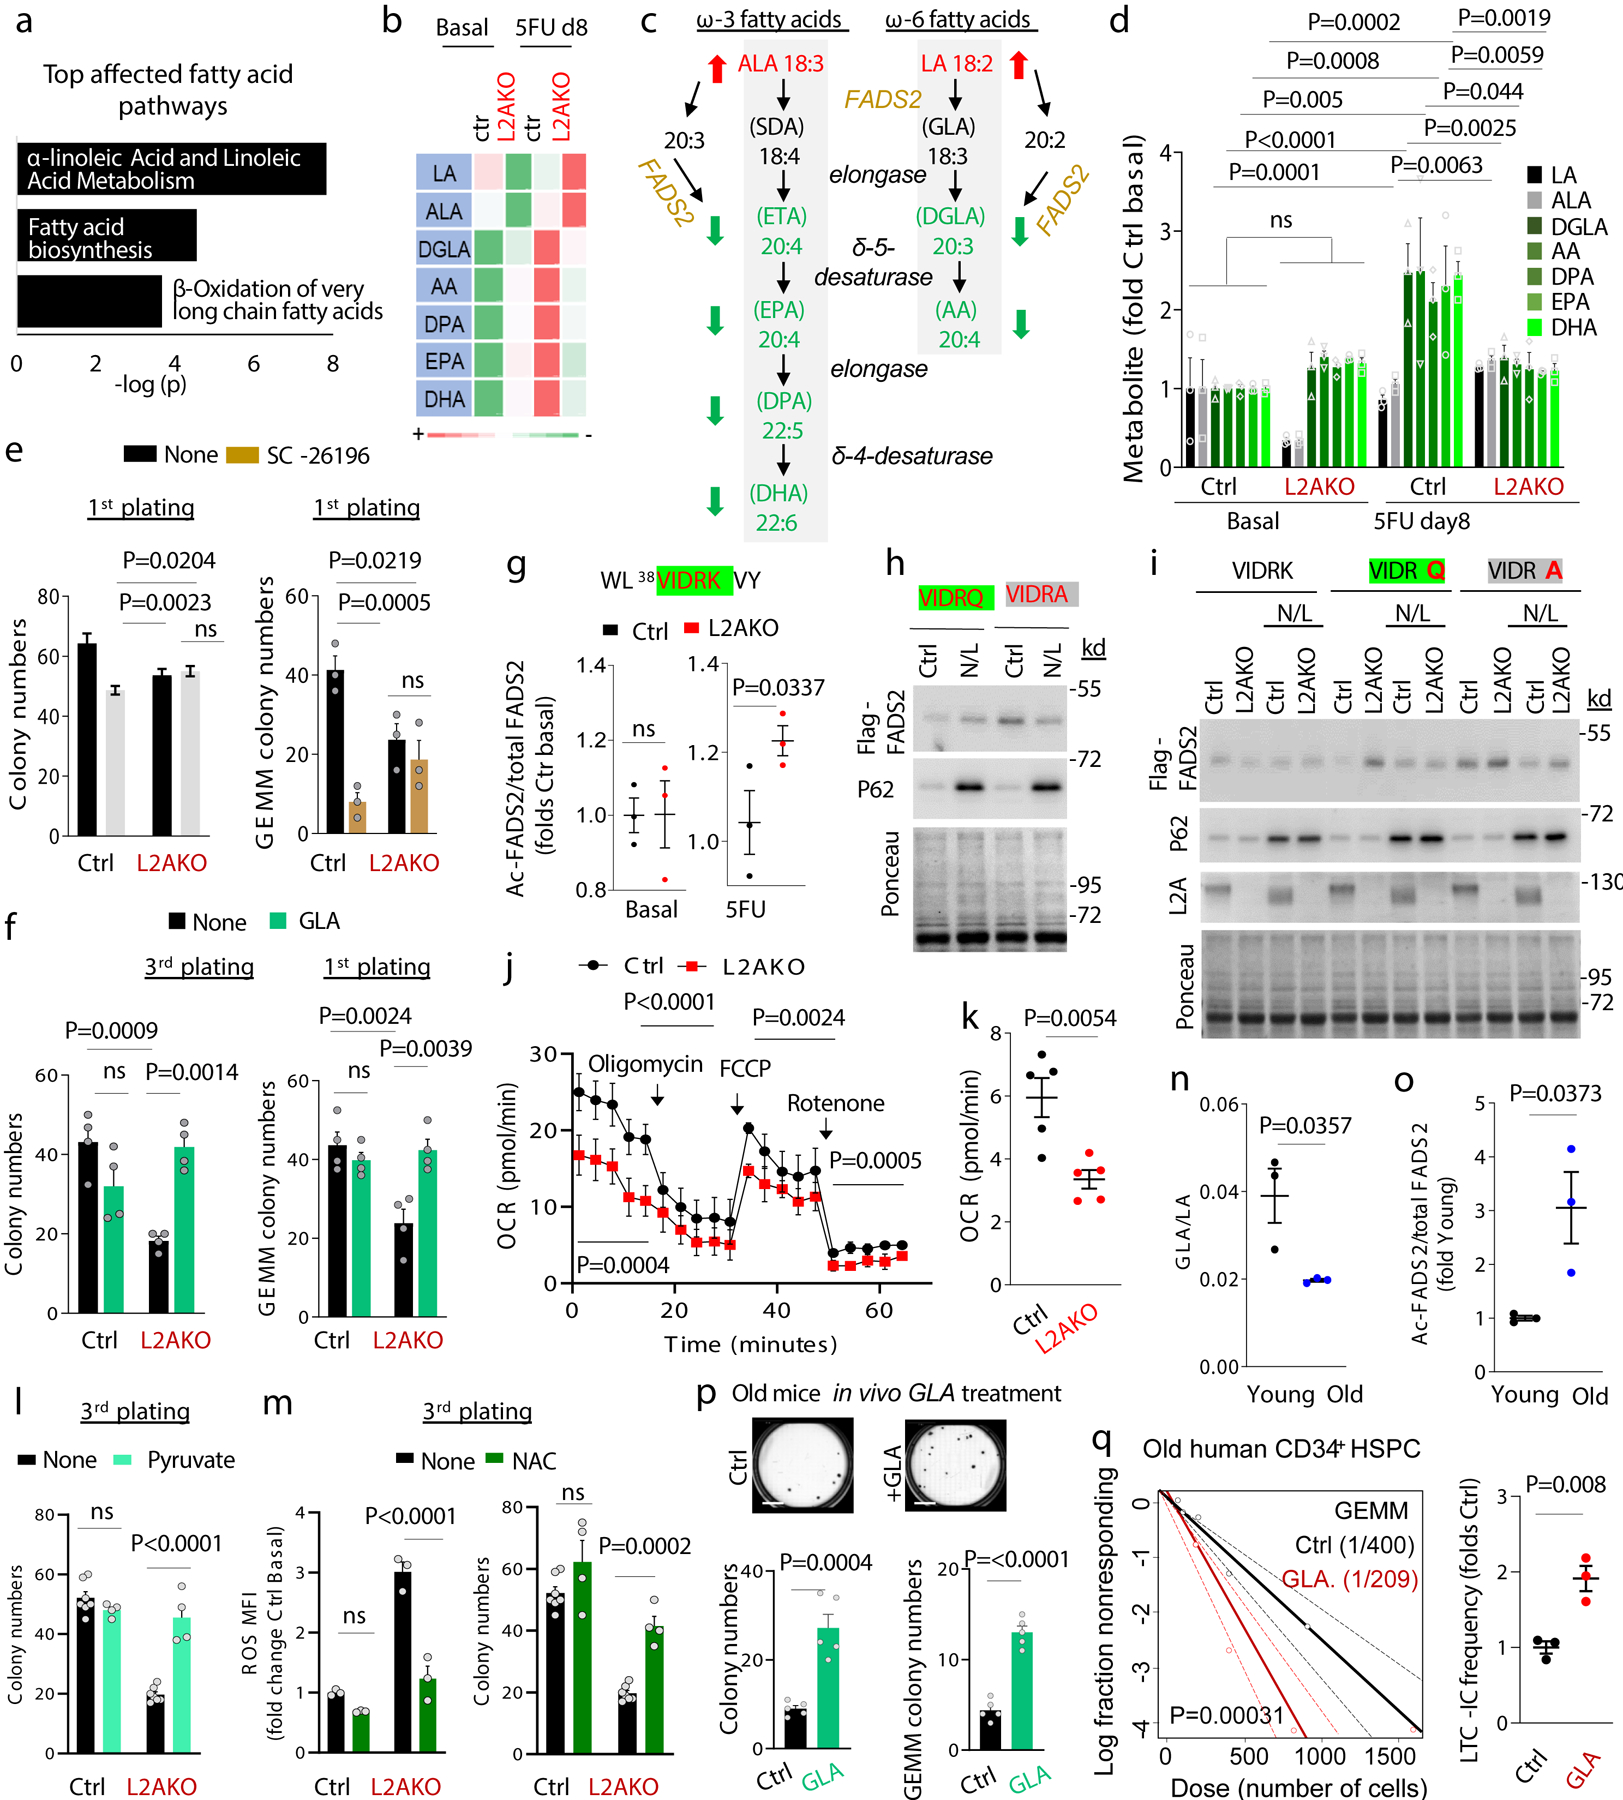
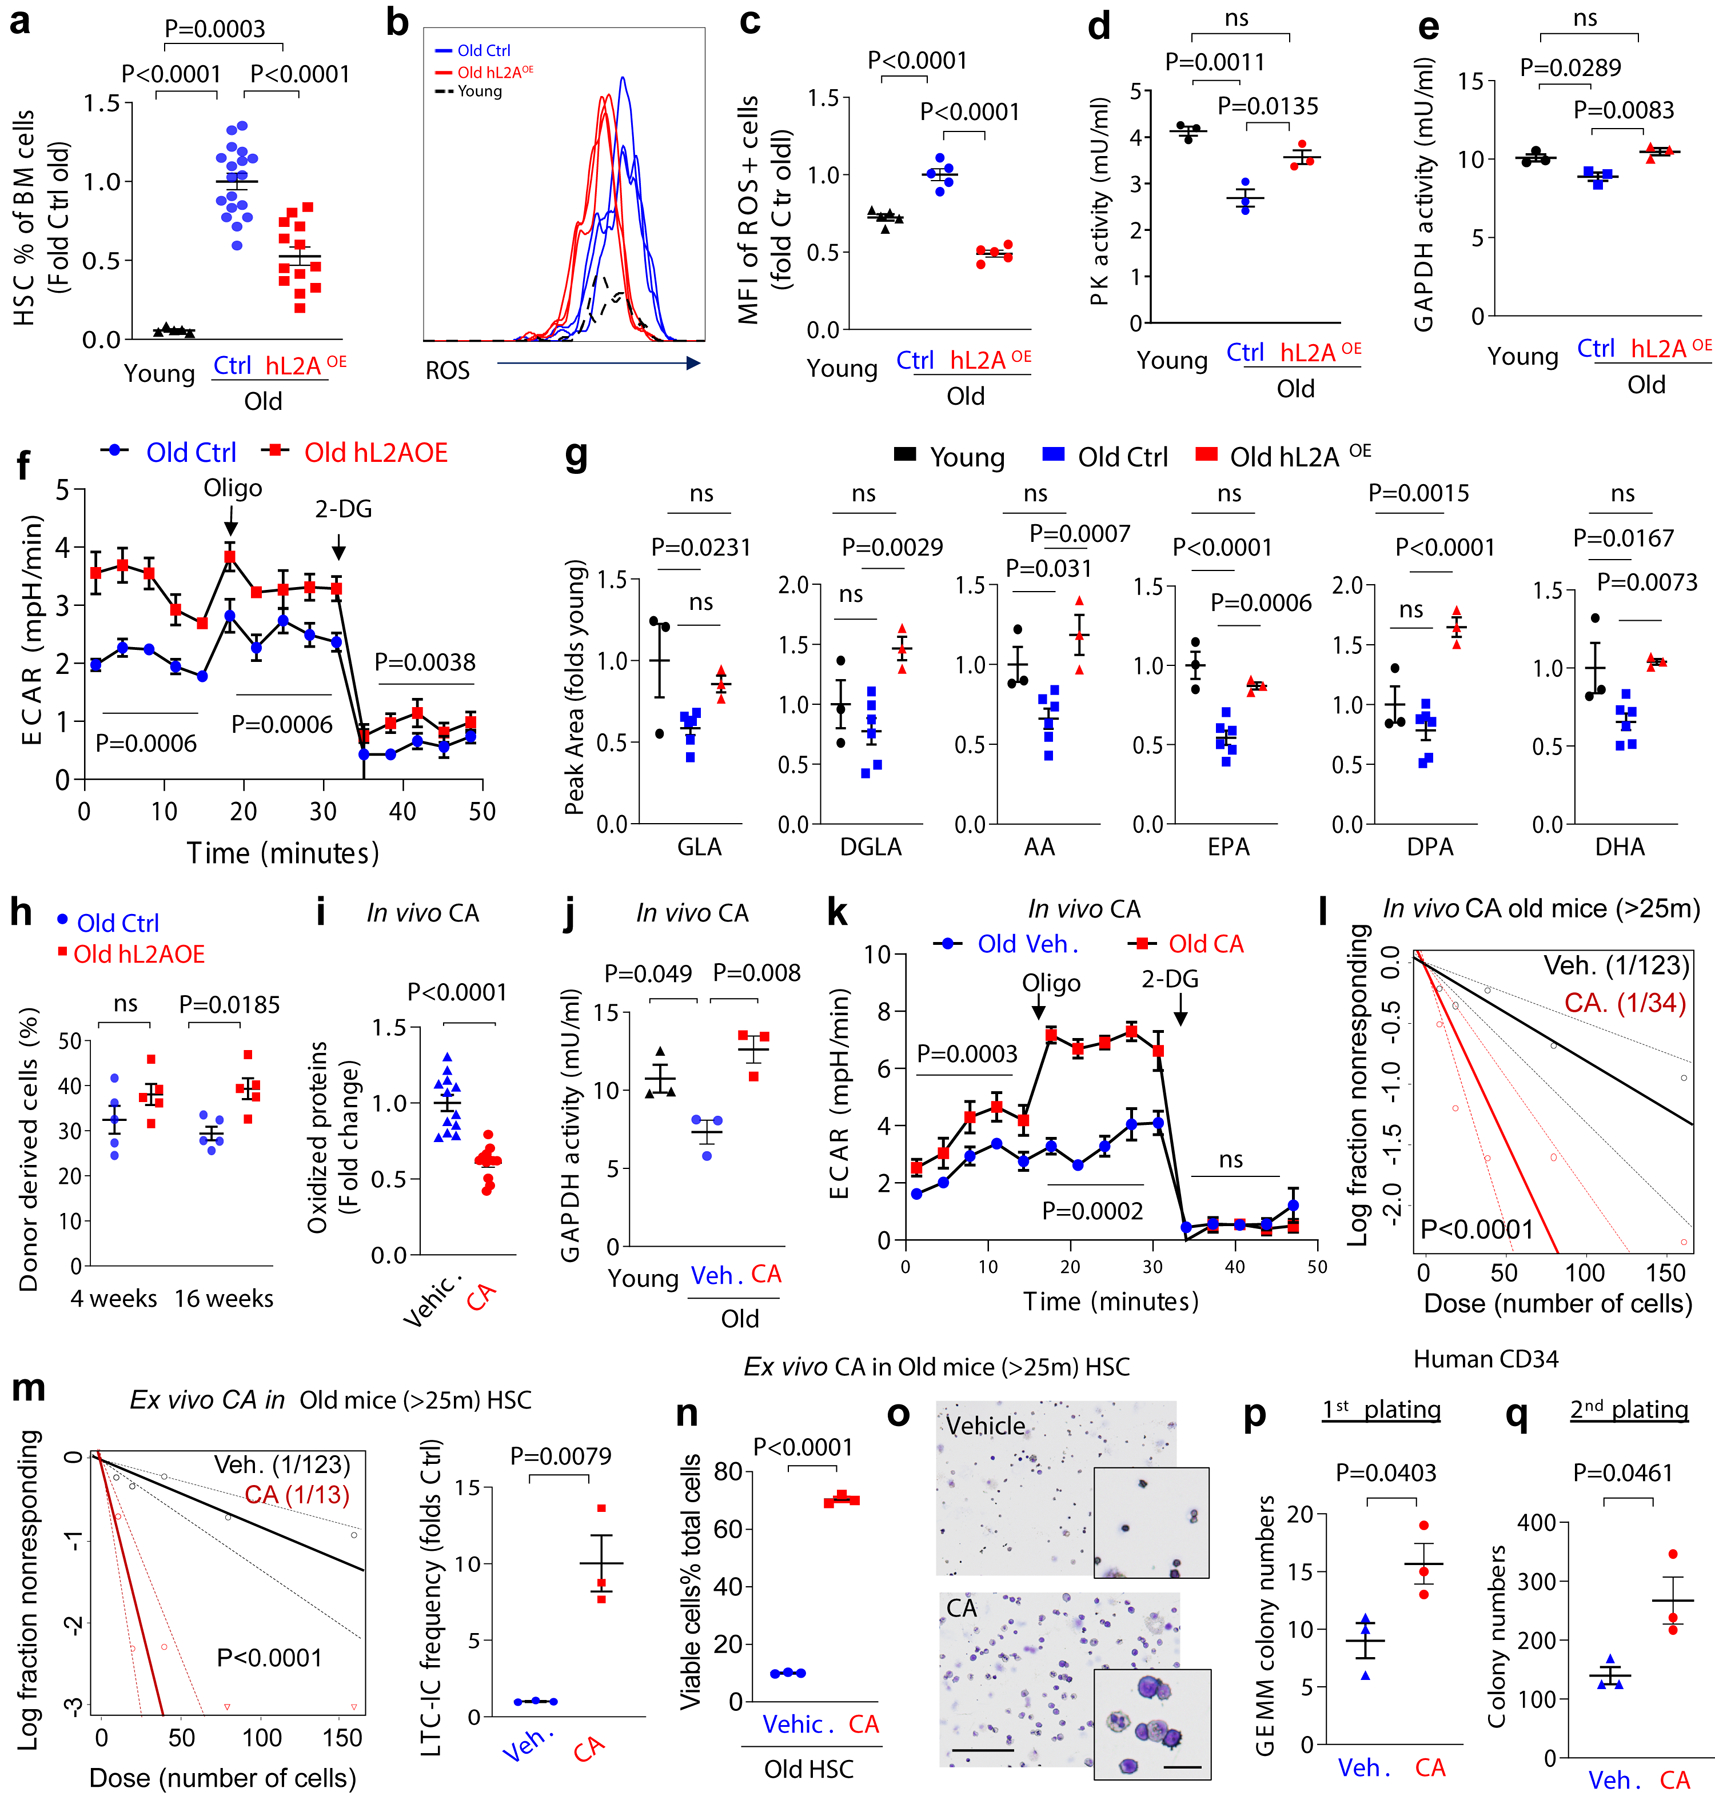
The activation of mostly quiescent haematopoietic stem cells (HSCs) is a prerequisite for life-long production of blood cells1. This process requires major molecular adaptations to allow HSCs to meet the regulatory and metabolic requirements for cell division2-4. The mechanisms that govern cellular reprograming upon stem-cell activation, and the subsequent return of stem cells to quiescence, have not been fully characterized. Here we show that chaperone-mediated autophagy (CMA)5, a selective form of lysosomal protein degradation, is involved in sustaining HSC function in adult mice. CMA is required for protein quality control in stem cells and for the upregulation of fatty acid metabolism upon HSC activation. We find that CMA activity in HSCs decreases with age and show that genetic or pharmacological activation of CMA can restore the functionality of old mouse and human HSCs. Together, our findings provide mechanistic insights into a role for CMA in sustaining quality control, appropriate energetics and overall long-term HSC function. Our work suggests that CMA may be a promising therapeutic target for enhancing HSC function in conditions such as ageing or stem-cell transplantation.


Conflict of interest statement

Competing interest

AMC and EG are cofounders of Selphagy Therapeutics (Boston, MA, USA).

Figures

Extended Data Fig. 1.
Extended Data Fig. 1.. CMA changes in HSC with age.
a, Scheme of the KFERQ-Dendra2 fluorescent CMA reporter. b, Percentage of HSC positive for Dendra puncta at the indicated ages. n=4 mice per group, individual points are fields . CMA+ cells = cells with >2 Dendra+ puncta. c, Dendra fluorescence in GMP cells from young and old KFERQ-Dendra mice. Left: Representative images and magnified cells. Right: Puncta per cell. n=8 fields from 3 mice per group, individual points show average puncta/field. d, Dendra fluorescence in HSC from young and old L2AKO-KFERQ-Dendra mice. Left: Representative images and magnified cells. Right: Puncta per cell. n=8 fields from 4 mice per group. e, Immunostaining for LAMP1 and LAMP2A in HSC from young and old mice. Top: Representative images and magnified cells. Bottom: Fluorescence intensity of each protein. n=8 (LAMP1), 11 (LAMP2A) fields from 3 mice per group, individual points shows average intensity/field. f, Proteins bearing KFERQ-like motifs in those at higher (O>Y) and lower (O<Y) abundance in old human BM HSC compared to young ones (data set in ref 31). Motif frequency in the total proteome is shown as reference. n=59 human subjects (45 male and 14 female) with age range 20–60 years (with median of 33.2 years). Only proteins displaying statistically significant changes with age (p<0.01) were included. g, STRING analysis of the proteins bearing CMA-targeting motifs that accumulate in old human BM HSC. Data shows individual values and mean ± SEM. One-way (b) or two-way (f) ANOVA with Tukey’s post-hoc test and unpaired two-tailed t test (c,d,e) were used. P values are shown and statistical analysis is in data source. ns: no statistical significance.
Extended Data Fig. 2.
Extended Data Fig. 2.. CMA upregulation during HSC activation.
a, Left: Full fields of the images shown at higher magnification in Fig. 1b. Right: HSC positive for Dendra puncta. n=4 mice per group. CMA+ cells = cells with >2 Dendra+ puncta. b, Lysosomal proteolysis of long-lived proteins in HSC untreated (Ctrl) and 8 days post 5FU injection. n=3 independent experiments. c, Immunostaining for LAMP2A, LAMP1 and LysoTracker in HSC from mice before and 1, 3 and 8 days after single 5FU injection. Top: Representative images. Bottom: Fluorescence intensity. n=16, 11, 7, 19 fields (LAMP2A), 9, 10, 7, 16 fields (LAMP1) and 10, 10, 6, 7 fields (LysoTracker) from 3 mice per group, individual points show average intensity/field. d,e, Dendra fluorescence in HSC from KFERQ-Dendra mice 48h post PolyI:C or vehicle injection (Basal). Representative images and magnified cells (d) and puncta per cell (e), n=3 mice. Individual points show average puncta/field. f,g, Full fields of the images shown at higher magnification in Fig. 1b (f) and number of Dendra+ puncta per cell (g) in myeloid progenitors from KFERQ-Dendra mice before and at the indicated days post 5FU injection. n=3 mice. h,i, Dendra fluorescence in myeloid progenitors from KFERQ-Dendra mice 48h post PolyI:C or vehicle injection (Basal). Representative images and magnified cells (h) and puncta per cell (i), n=3 mice. Data shows individual values and mean ± SEM. Unpaired two tailed t tests (b,e,i) and one-way ANOVA with Tukey’s post-hoc test (a,c,g) were used. P values are shown and statistical analysis is in data source. ns: no statistical significance.
Extended Data Fig. 3.
Extended Data Fig. 3.. Effect of CMA blockage on HSC and myeloid progenitor cells.
a, Quantitative PCR for the three lamp2 spliced variants in BM from Vav-iCreL2Af/f (L2AKO) and VaviCre (Ctrl) mice. n=3 independent experiments. b, Number of total BM cells of 2 femurs and tibias from Ctrl and L2AKO mice in basal and at day 8 post 5FU injection. n=5 mice. c, Percentage of T cells (CD3ε+), B cells (B220+), granulocytes (CD11b+ Gr1high) and monocytes (CD11b+ Gr1middle) in Ctrl and L2AKO mice BM in basal conditions. n=5 mice. d, Frequency of Lin- cells of 2 femurs and tibias from Ctrl and L2AKO mice in basal and day 8 post 5FU injection. n=6 (basal) and 4 (5FU) mice. e,f, Number of LSK cells (e) and HSC cells (f) in BM of Ctrl and L2AKO mice in basal and 5FU activated conditions. n=6 mice. g,h, Donor chimerism in peripheral blood (g) and donor derived Lin- population (h) in BM of recipients at the indicated weeks after the primary competitive transplantation using BM from 4m Ctrl and L2AKO mice. n=7 mice (g), n=5 mice (h). i-k, Donor lineage distribution in peripheral blood of recipients in the secondary competitive transplantation of Ctrl and L2AKO BM. Representative FACS plots (left) and quantification (right) are shown. n=7 mice. l, LTC-IC frequency for both Ctrl and L2AKO cells in the LTC-IC assay of Lin−Sca-1+c-Kit+ (LSK) cells from Ctrl and L2AKO mice. n=3 mice. Data shows individual values and mean ± SEM. Two way ANOVA with Sidak’s post-hoc test (b-d,g), unpaired two-tailed t tests (a,e,f,h-k) and Chi-square test (l) were used. P values are shown and statistical analysis is in data source. ns: no statistical significance.
Extended data Fig. 4.
Extended data Fig. 4.. Impact of CMA blockage in the cell cycle of HSC and myeloid progenitor cells.
a-c, Representative FACS plots of Hoechst and Ki67 staining (a) or Hoechst and BrdU staining (c) in HSC from control (Ctrl) and L2AKO mice untreated (basal) or 8 days post single 5FU injection. Quantification of FACS in a is shown in main Fig. 2a and quantification of FACS in c is shown in b. n=4 mice. d,e, Representative FACS plots of Ki67 and Hoechst staining (e) and quantification (d) of cycling HSC from Ctrl and L2AKO mice untreated (basal) or 16 days post single 5FU injection. n=4 mice. f,g, Percentage of cycling cells (f) and representative flow cytometry plots (g) of Ki67 and Hoechst stained myeloid progenitors from Ctrl and L2AKO mice in basal conditions (top) and 8 days after a single 5FU injection (bottom). n=7 mice per condition. h,i, ATP (h) and ROS levels (i) in myeloid progenitors from Ctrl and L2AKO mice in basal or after single 5FU injection. n=4 (basal) and 3 (5FU) mice for h, n=5 mice for i. Data shows individual values and mean ± SEM. Two-way ANOVA with Sidak’s post-hoc test (b,f,h,i) and unpaired two tailed t-test (d) were used. P values are shown and statistical analysis is in data source. ns: no statistical significance.
Extended data Fig. 5.
Extended data Fig. 5.. Characterization of macroautophagy in CMA-deficient HSC cells.
a, Immunostaining for endogenous LC3 in HSC from control (Ctr) and L2AKO mice in basal and cytokine starved conditions in presence or not of lysosomal inhibitors NH4Cl and leupeptin (N/L). Representative images of full fields and higher magnification cells (left) and LC3 flux (right) calculated as the increase in LC3+ puncta upon addition of N/L. n=9 fields from 3 mice, individual points show average puncta/field. b, Expression of genes in the TFEB-regulated transcriptional program in Ctrl and L2AKO LSK cells. Genes are grouped as: components of the macroautophagy machinery (top left), regulators of macroautophagy initiation (right) and genes involved in lysosome biogenesis (bottom left). c, Representative electron microscopy images of HSC (from 3 independent repeats). Top: whole fields and boxed areas at higher magnification to show examples of autophagosomes (APG, yellow arrows) and autolysosomes (AUT, red arrows). Bottom: representative images of ultrastructure of the endoplasmic reticulum (green arrows) in HSC under basal and 5FU (day8) activated conditions. d-f, Average number of APG, AUT (d) and mitochondrial number per cell (e) as well as cytoplasm and total cell area (f) from electron microscopy images in c. n=15 (Ctrl APG/AUT), 13 (L2AKO APG) and 12 (L2AKO AUT) fields (d), 11 fields (e) and 6 fields (f) from 3 independent samples. g, Average ER diameter in HSC under basal and 5FU (day8) activated conditions. n=11 (basal ctrl), 8 (basal L2AKO), 13 (5FU ctrl) and 10 (5FU L2AKO) fields. Data shows individual values and mean ± SEM. Two-way ANOVA with Tukey’s multiple post-hoc test (a) and unpaired two-tailed t test (d-g) were used. P values are shown and statistical analysis is in data source. ns: no statistical significance.
Extended data Fig. 6.
Extended data Fig. 6.. Metabolism-related changes in the transcriptome and proteome of CMA-deficient HSC.
a, Categories of metabolism-related top transcriptional changes in L2AKO HSC cells in basal conditions. b, STRING analysis of proteins more abundant in L2AKO LSK in basal conditions. c, Top categories of proteins related with overall metabolism (left) and break down of the proteins under enzyme category (right) found in the overlapped proteins in Fig. 2h. d, Scheme of glycolysis-related substrates and metabolites to highlight those significantly increased (red) or decreased (green) in L2AKO LSK. e,f, Extracellular acidification rate (ECAR) (e) and basal glycolysis, glycolytic capacity and glycolytic reserve (f) in myeloid progenitors. Glu: Glucose, Oligo: oligomycin, 2DG: 2-Deoxy-D-glucose, n=3 independent experiments. g, Full field images of HSC straining for OxyICC or Proteostat shown in Fig. 2q,r. Bottom panel shows full field and higher magnification inset of HSC 4-HNE staining. h, Intensity of 4-HNE staining shown in g. n=8 (Ctrl) and 11 (L2AKO) fields from 3 mice, individual points represent average intensity per field. i, Ingenuity pathway analysis of the top proteins with higher percentage of oxidation in activated L2AKO LSK cells compared with control. j,k, STRING analysis of proteins with higher percentage of oxidation in basal (j) and 5FU activated conditions (k). l, GAPDH and PK activity in 5FU-activated Ctrl and L2AKO LSK cells. n=3 independent experiments. Data shows individual values and mean ± SEM. Multiple t test by time segment (e) and unpaired two-tailed t tests (f,h,l) were used. P values are shown and statistical analysis is in data source. ns: no statistical significance.
Extended Data Fig. 7.
Extended Data Fig. 7.. Regulation of lipid metabolism by CMA during HSC activation.
a, Metabolic pathways different between Ctrl and L2AKO LSK 8 days post-5FU injection. n=9 mice in 3 independent experiments (ie). b,c, Immunostaining for FADS2 in LSK cells. Representative images (b) and average of intensity per cell (c). n=16 (basal Ctrl), 21 (basal L2AKO), 17 (5FU Ctrl) and 23 (5FU L2AKO) fields from 3 ie. d, In silico analysis of proteins bearing phosphorylation- or acetylation-generated KFERQ-like motifs in the total proteome, and in the group of proteins less/more abundant in L2AKO LSK cells post-5FU. Left: Percentage of proteins with KFERQ motif. Right: STRING analysis of proteins bearing acetylation-generated KFERQ motif in the L2AKO>Ctrl group. n=3 mice in 3 ie. e, Mass spectrometry analysis of acetylation-generated KFERQ motifs in proteins with lower and higher acetylation in L2AKO LSK post-5FU. Left: Percentage of proteins with or without acetylation generated KFERQ motifs. Right: STRING analysis of proteins with acetylation-generated motifs in the group of proteins with higher acetylation in L2AKO. n=9 mice in 3 ie. f, Venn diagram of proteins more abundant in L2AKO LSK than Ctrl and in old than young LSK. n=9 mice in 3 ie. Bottom: STRING analysis of proteins that accumulate in both L2AKO and old mice LSK. g-i. Metabolomic analysis in young (4m) and old (>25m) mice LSK in basal conditions. Unsupervised principal component analysis (g). Comparison of metabolites in glycolysis (h) and in the FADS2-catalyzed step in linoleic acid metabolism (i). Values are integrated peak areas (arbitrary units) for each metabolite. n=9 mice in 3 ie. Data shows individual values and mean ± SEM. Two-way ANOVA with Tukey’s (d,e) or Sidak’s (c) post-hoc test and unpaired two-tailed t tests (h,i) were used. P values are shown and statistical analysis is in data source. ns: no statistical significance.
Extended Data Fig. 8.
Extended Data Fig. 8.. CMA activity in hematopoietic stem cells from old mice.
a, HSC numbers in control (Ctrl) and L2AKO mice with age, n=10,10,11 (Ctrl) and 10,11,9 (L2AKO) mice per age. b, Donor chimerism in recipients’ peripheral blood after old Ctrl and L2AKO mice BM competitive transplantation. n= 6,5,5,6,6 (Ctrl) and 5,5,6,5,5 (L2AKO) mice per time point. c, Donor lineage distribution in peripheral blood after Ctrl and L2AKO mice BM second competitive transplantation, n=6 (Ctrl) and 5 (L2AKO) mice. d, HSC ROS levels (MFI: median fluorescence intensity). n=5 (young) and 6 (old) mice. e, Fluorescence puncta in HSC from KFERQ-Dendra mice. Each individual point represents a cell. n=45 (4m), 52 (12m) and 53 (30m) cells from 4 mice per group. Red points: cells with <5 puncta. f, Representative full-field and higher magnification images (from 3 independent experiments (ie)) of dendra immunostained HSC from 30m old mice. Exposure times are indicated. Arrows: high (yellow) and low (white) cytosolic Dendra intensity. g, Flow cytometry analysis of direct Dendra fluorescence of HSC from 30m old mice. Representative plot from n=4 mice. h, Representative full-field and higher magnification images (from 3 ie) of dendra immunostained LSK cells from 30m old mice incubated or not with leupeptin. Exposure time is shown. i, CMA flux (increase in puncta number after leupeptin), n=9 fields from 4 mice per group. j,k, Oxidized protein staining in 30m old mice HSC FACS sorted according to their cytosolic Dendra fluorescence intensity. Representative full-field and higher magnification images (j) and intensity of oxidized proteins (k), n=26 (high intensity) and 28 (low intensity) fields from 4 mice. l,m, Cellular ROS levels (l) and GAPDH activity (m) in the same FACS sorted HSC populations as in j. n=5 fields from 3 mice (l) and n=3 mice (m). Data shows individual values and mean ± SEM. Multiple two tailed t-test (a-c), two-way ANOVA with Sidak’s post-hoc test (d), one-way ANOVA with Bonferroni post-hoc test (e, i) and unpaired two-tailed t tests (k-m) were used. P values are shown and statistical analysis is in data source. ns: no statistical significance.
Extended Data Fig. 9.
Extended Data Fig. 9.. Characterization of HSC with genetic or pharmacological activation of CMA.
a,b, Immunostaining images for human and mouse L2A in HSC from Ctrl and hL2AOE mice (a) and average fluorescence intensity per cell relative to Ctrl (b), n=9 fields from 3 mice. c, Human and mouse L2A mRNA in HSC expressed as fold mL2A mRNA in Ctrl cells, n=3 independent experiments (ie). d, Images of Dendra immunostained HSC from 22–25m old KFERQ-Dendra-hL2AOE mice incubated or not with leupeptin, n=3 ie. e-g, CMA flux (increase in fluorescent puncta upon leupeptin) in HSC from old Ctrl (from Extended Fig. 8h) and KFERQ-Dendra-hL2AOE mice averaged (e) or separated by Dendra fluorescence intensity (f); fraction of cells with high cytosolic KFERQ-Dendra staining (g), n=12 fields from 4 mice. h, Flow cytometry plots (from 3 ie) of HSC sorted by their cytosolic KFERQ-Dendra fluorescence intensity. i-l, HSC frequency (i), LTC-IC frequency (j), levels of intracellular ROS (k) and PK activity (l) in HSC from 7m hL2AOE mice with upregulated L2A expression since 4m of age. n=3 (i,j,l) and 6 (k) mice/group. m, Direct fluorescence images (from 3 ie) of HSC from 22–25 months old KFERQ-Dendra mice ex vivo treated with vehicle or CMA activator (10 μM CA) for 4 weeks (left) and fluorescent puncta per cell (right). n=9 fields from 3 mice. n, Oxidized protein staining in HSC cells from 22–25 months old mice after 7 days of culture in presence of vehicle or CA (10 μM). Nuclei are stained with DAPI. Quantification is shown in Fig. 4i. o, Viability of cells recovered at the end of LTC-IC from LSK cells of 25m mice treated ex vivo with vehicle or CA. Data shows individual values and mean ± SEM. Two-way ANOVA with Sidak’s (b,o) or Tukey’s (c) post-hoc test, unpaired two-tailed t test (e,g, i-m) and one-way ANOVA with Tukey’s post-hoc test (f) were used. P values are shown and statistical analysis is in data source. ns: no statistical significance.
Extended Data Fig. 10.
Extended Data Fig. 10.. The effect of CMA on polyunsaturated fatty acid metabolism in HSC is the basis for the role of CMA in HSC function.
a, Polyunsaturated fatty acids that are generated by FADS2 activity decrease with age in human blood from healthy donor volunteers (n=250). Top metabolic changes positively and negatively correlating (Spearman’s correlation) with aging were determined (left) and placement of 3 products of FADS2 activity in the graph is marked by the blue circles as (1) for DGLA (Dihomo-γ-linolenic acid), (2) for AA (arachidonic acid) and (3) for DCA (Docosatetraenoic acid). Right shows levels of each of the three metabolites in 250 healthy individuals with age range 20–90 years. Pearson correlation was used for statistics. b, Scheme of the role of CMA in HSC function. Left: under basal conditions, functional CMA is required in HSC for protein quality control including that of enzymes involved in glucose metabolism. Failure of CMA leads to persistence of damaged enzymes and reduced glycolytic activity. Right: during HSC activation, CMA is required for increasing FADS2 activity the limiting enzyme in linoleic and α-linolenic metabolism, to activate this pathway and thus facilitate the metabolic switch from glucose to lipid metabolism. CMA changes the active/inactive enzyme ratio by selective removal of the inactive forms of FADS2. Acetylation of inactive forms of FADS2 during HSC activation completes a KFERQ-like motif in FADS2 that allows its recognition by hsc70 and subsequent targeting to lysosomes for degradation.
Fig. 1.
Fig. 1.. CMA activity is required for HSC self-renewal.
a, Dendra fluorescence in sorted HSC from 4m, 12m and 30m old KFERQ-Dendra mice. b, Quantification of Dendra puncta per cell in a. n=9 fields from 4 individual mice (individual points represent the average of approx. 7–10 cells per field). c, Dendra fluorescence in HSC and myeloid progenitors (LincKit+Sca-1) from KFERQ-Dendra mice before and at the indicated days after single injection of 5-fluorouracil (5FU). Right: quantification of Dendra+ puncta per cell in c. n=9 fields from 5 individual mice (individual points represent the average of 7–10 cells per field). d, HSC frequency in BM from Ctrl and L2AKO mice untreated (Basal) or 8 days after a single injection with 5-fluorouracil (5FU). n=6 mice. e, Survival curve of Ctrl and L2AKO mice after serial injections of 5FU 7 days apart. f, White blood cell counts 7 days after first (left) and second (right) 5FU injection. n=8 (Ctrl) and 10 (L2AKO) mice. g-i, Serial transplantation and competitive BM repopulation with Ctrl or L2AKO BM cells, experimental strategy (g); frequency of donor-derived HSC 16 weeks after the first competitive transplantation n=5 mice (h) and donor cell (from 3–4m CD45.2 mice) contribution in recipients’ peripheral blood 4 or 16 weeks after competitive secondary transplantation. n=7 mice (i). j, Serial colony formation assay with HSC from Ctrl or L2AKO mice. Number of colonies at day 10 after the indicated plating number is shown. n=6 (1st plating) and 4 (2nd and 3rd plating) mice. k, LTC-IC assay of LSK cells from 4m Ctrl and L2AKO mice. Fold change of LTC-IC frequency relative to Ctrl after 4 weeks of culture is shown, n=3 mice. One-way ANOVA test followed by Tukey’s multiple comparison post-hoc test (b,c) and two-way ANOVA test followed by Sidak’s multiple comparison post-hoc test (f,i,j), Log-rank (Mantel-Cox) test (e) and unpaired t-test (d,h,k) were used. P<0.05 (*), 0.01 (**), 0.0001(****). ns: no statistical significance.
Fig. 2.
Fig. 2.. Consequences of CMA blockage on HSC function.
a-c, Percentage of stem cells in active cell cycle (not in G0 by Ki67 and Hoechst staining) (a), ATP levels (b) and median fluorescence intensity (MFI) for cellular ROS (reactive oxygen species) (c) in HSC from control (Ctrl) and L2AKO mice untreated (basal) or at day 8 after a single 5FU injection. n= 6–7 mice (a), 4–5 mice (b), 5–15 (c) mice. Representative examples of FACS plots for Fig. 2a and cycling analysis by Brdu incorporation are shown in Extended Data Fig. 4a-c. d, ROS levels in Ctrl and L2AKO bone marrow (BM) derived HSC in transplanted recipients. n= 5 mice . e,f, Heat map of gene expression (e) and enrichment pathway analysis (f) in HSC cells from Ctrl and L2AKO mice untreated or 8 days post 5FU injection. g, STRING analysis of proteins whose levels decrease in control cells upon activation (top) and those at higher levels in L2AKO LSK than Ctrl LSK 8 days post-5FU (bottom). h, Number of proteins different and overlapping in the same two groups as in g. n=3 proteomic experiments with pool of 3 mice per group. i-k, Metabolic phenotypes of LSK cells from Ctrl and L2AKO mice. Unsupervised principal component analysis of the two groups (i), hierarchical clustering analysis of the top 25 significant metabolites by two-tailed t test (j) and Omicsnet analysis of the most significantly affected pathways in L2AKO cells (k). n=3 metabolomic experiments with pool of 3 mice per group. l, Extracellular acidification rates (ECAR) in Ctrl and L2AKO LSK cells and changes upon addition of glucose (Glu), oligomycin (Oligo) and 2-Deoxy-D-glucose (2DG). n=3 independent experiments. m, Basal glycolysis (left), glycolytic capacity (middle) and glycolytic reserve (right) in L2AKO LSK cells relative to control cells. n=3 independent experiments. n. GAPDH (left) and pyruvate kinase (PK) (right) activity in Ctrl and L2AKO LSK cells. n=3 independent experiments. o, Percentage of cellular oxidized GAPDH and PK detected by mass spec in Ctrl and L2AKO LSK cells under basal conditions. n=9 mice in 3 different experiments. p, Percentage of total cellular proteins that are oxidized (left) and fold changes in the number of carbonylated peptides (right) in LSK from Ctrl and L2AKO mice under basal conditions or 8 days after 5FU injection. n=9 mice in 3 independent experiments. q, r Oxidized proteins (q) and protein inclusions (r) in basal Ctrl and L2AKO HSC detected by staining with OxylCC and Proteostat, respectively. Representative images (left) and quantification of staining intensity (right) are shown. n=15 fields from 5 individual mice (individual points represent the average of 5–10 cells per field). Nuclei are highlighted with DAPI. Full field images for q and r as shown in Extended Data Fig. 6g. Two-way ANOVA test followed by Sidak’s (a-c) or Tukey’s (p) multiple comparison post-hoc test, Chi-square test (k), multiple time point paired t-test (l) and unpaired t-test (d,m-o,q, r) were used for the statistics. P<0.05 (*), 0.01 (**), 0.001(***), 0.0001 (****). ns: no statistical significance.
Fig. 3.
Fig. 3.. CMA increases linoleic acid metabolism upon HSC activation.
a, Top lipid metabolism pathways identified from enrichment analysis of metabolites as different between control and L2AKO LSK cells 8 days post 5FU injection. b, Heat map of substrate and metabolite abundance in the linoleic acid and α-linolenic metabolism in the indicated conditions. c, Scheme of linoleic and α-linolenic fatty acid metabolism pathway showing the increased (red arrow) and decreased (green arrow) metabolites in L2AKO LSK cells comparing with Ctrl cells in 5FU-activated conditions. d, Levels of substrates (black, gray) and downstream metabolites (green) of the linoleic acid and α-linolenic metabolism relative to those in unstimulated control cells. n= 9 mice in 3 different experiments. Significant differences with control untreated are marked with * and between L2AKO basal and 5FU treated with †. e, Total colony numbers (left) and number of immature, multipotent colony-forming unit-granulocyte/ erythroid/macrophage/megakaryocyte CFU-GEMM (right) in the first plating from Ctrl and L2AKO HSC treated or not with the FADS2 inhibitor SC-26196 (SC). n=3 independent experiments. f, Total colony numbers in the 3rd plating (left) or number of CFU-GEMM colonies in the first plating (right) from Ctrl and L2AKO HSC treated or not with γ-linolenic acid (GLA). n=4 independent experiments. g, Predicted CMA-targeting motif in FADS2 (green) generated by acetylation of 42K (g top) and analysis of the acetylation level of this peptide detected by mass spectrometry Ctrl and L2AKO LSK cells in basal and 5FU activated conditions (g bottom). n=3 mice. h,i, Immunoblot for Flag of Ctrl (h) and L2AKO (i) ex vivo expanded HSC expressing Flag-myc tagged FADS2 wild type (VIDRK) or mutated as indicated at the top (VIDRQ or VIDRA) treated or not with NH4Cl/Leupeptin (N/L). For gel source data, see supplementary Figure 1. j, Oxygen consumption rate (OCR) in Ctrl and L2AKO LSK cells at day 8 after 5FU injection. Responses to addition of oligomycin (Oligo), FCCP and rotenone (Roteno) are shown. n=5 independent experiments. k, Quantification of mitochondrial respiration from fatty acid β-oxidation (etomoxir-sensitive) in Ctrl and L2AKO LSK cells. n=5 independent experiments. l, Total colony numbers in 3rd plating from both Ctrl and L2AKO HSC treated or not with Methyl-pyruvate (5mM) starting from the 1st plating. n=7 (None) and 4 (Methyl-pyruvate) independent mice. m, Quantification of MFI of ROS+ cells (left) and total colony numbers (right) in the 3rd plating of Ctrl or L2AKO HSC untreated or supplemented with NAC from the 1st plating. n=7 (None) and 4 (NAC) mice. n, Ratio of γ-linolenic acid (GLA) and linoleic acid (LA) in LSK cells from young and old mice calculated from the metabolomics data. n= 9 mice in 3 different experiments. o, Ratio of K42 acetylated and total FADS2 peptide in LSK from young and old mice calculated from the mass spectrometry analysis. n= 9 mice in 3 different experiments. p, Total colony numbers (left) and number of CFU-GEMM colonies (right) in the colony formation assay with HSC cells from old (22m) mice daily injected with either saline or GLA (1mg/kg bw) for 7 weeks. Representative images of wells with Ctrl or GLA treated cells are shown on the top. n=5 mice per group. q, LTC-IC assay according to GEMM colonies from Ctrl and GLA treated human CD34+ cells from old (>65 year) multi-myeloma patients. n=2 patients. Two-way ANOVA test followed by Tukey’s (d,f) or Sidak (e,l,m) multiple comparison post-hoc test, unpaired t-tests (g,k,n,o,p), time point paired t-test (j), and Chi-square test (q) were used for the statistics. P<0.05 (*), 0.01 (**), 0.001(***), 0.0001(****). ns: no statistical significance.
Fig. 4.
Fig. 4.. Modulation of CMA restores old HSC function.
a, Changes in HSC numbers per femur and tibia in Ctrl and L2AKO mice with age. Values are relative to young control mice. n=9–11 mice. b, Donor chimerism at the indicated time points in peripheral blood of recipients after competitive transplantation of 25–30m Ctrl or L2AKO BM cells. n=5–6 mice. c, Donor lineage distribution in peripheral blood 24 weeks after second competitive transplantation of Ctrl or L2AKO BM cells. n=5–6 mice. d, ROS levels in HSC from 3–4m and >25m old Ctrl and L2AKO mice. Data is shown as median fluorescence intensity (MFI) per cell. n=5–6 mice. e, Percentage of HSC in BM of young, old control and old mice bearing an extra copy of human L2A (hL2AOE). n=5 (young), 18 (old ctrl) and 13 (old hL2AOE) mice. f,g, Representative FACS (f) and quantification (g) of ROS levels in HSC cells from young, old Ctrl and hL2AOE mice. Data is shown relative to old Ctrl mice. n=5 mice. h-j PK (h) and GAPDH (i) activity and extracellular acidification rates (ECAR) in basal conditions or after addition of oligomycin (Oligo) and 2-deoxy-D-glucose (2DG) (j) in LSK cells from old Ctrl and hL2AOE mice. n=3 mice. k. Levels of polyunsaturated fatty acids generated by FADS2 in old Ctrl and hL2AOE mice expressed as peak area relative to young mice. n= 9 (young), 18 (old), 9 (hL2AOE) mice in 3 independent experiments. l. Percentage of donor derived cells at the indicated times in mice transplanted with BM from old Ctrl and hL2AOE mice. n=5 mice. m-o, Levels of oxidized proteins (m), GAPDH activity (n) and ECAR in basal conditions or upon Oligo and 2DG addition (o) in HSC from old (>22m) mice 2 months after daily oral administration of a chemical activator of CMA (CA 20mg/Kg b.w.) or the corresponding vehicle (Veh.). Values in young mice are shown as reference in n. Representative images of cells used for quantification in m are in Extended Data Fig. 9n. n=12 fields from 4 and 3 mice for m and n, respectively. p. LTC-IC assay of LSK cells from BM of old mice administered daily for 2 months CA or vehicle. Scatter plot shows LTC-IC frequency for vehicle and CA treated old mice. n=4 mice. q,r LTC-IC assay of old LSK cells after ex vivo treatment with vehicle (DMSO) or a chemical activator of CMA (CA 10μM, daily for 4 weeks) (q) and viable cell percentage recovered from the colonies formed at the end of LTC-IC (r). Individual plot showing the fold change of LTC-IC frequency compared to old control cells (q left), scatter plot showing LTC-IC frequency for vehicle and CA treated old Ctrl cells (q right). n=3 mice. s. Representative images of Giemsa staining of the cells recovered at the end of the LTC-IC assay when cells were plated in presence of CA (10μM) or vehicle. n=3 experiments. t,u. Quantification of immature GEMM colonies in the 1st plating (t) and total colony numbers in the 2nd plating (u) of CD34+ enriched stem and progenitor cells from mobilized blood of multi-myeloma patients (59, 65, and 71 years old), when maintained in presence of CA (10μM) or vehicle starting from the 1st plating. n=3 patients. Multiple t-tests (a-c), unpaired t-tests (m,q left,r,t,u), time points paired t-test (j, o), two-way ANOVA test followed by Sidak’s multiple comparisons post-hoc test (d, l), one-way ANOVA tests followed by Tukey’s (e,g-i,n), Sidak’s (k) or Dunnett’s (n) multiple comparisons post-hoc test and Chi-square test (p,q right) were used for the statistics. P<0.05 (*), 0.01 (**), 0.001 (***), 0.001(****). ns: no statistical significance.

Comment in

References

    1. Suda T, Suda J & Ogawa M Single-cell origin of mouse hemopoietic colonies expressing multiple lineages in variable combinations. Proceedings of the National Academy of Sciences of the United States of America 80, 6689–6693 (1983). - PMC - PubMed
    1. Jordan CT & Lemischka IR Clonal and systemic analysis of long-term hematopoiesis in the mouse. Genes Dev 4, 220–232 (1990). - PubMed
    1. Ito K et al.Self-renewal of a purified Tie2+ hematopoietic stem cell population relies on mitochondrial clearance. Science (New York, N.Y.) 354, 1156–1160 (2016). - PMC - PubMed
    1. Cabezas-Wallscheid N et al.Identification of regulatory networks in HSCs and their immediate progeny via integrated proteome, transcriptome, and DNA methylome analysis. Cell Stem Cell 15, 507–522 (2014). - PubMed
    1. Arai F & Suda T Maintenance of quiescent hematopoietic stem cells in the osteoblastic niche. Ann N Y Acad Sci 1106, 41–53 (2007). - PubMed

Publication types

MeSH terms