[Preprint]. 2021 Jan 8:rs.3.rs-106579.
doi: 10.21203/rs.3.rs-106579/v1.

Lipidomic Signatures Align with Inflammatory Patterns and Outcomes in Critical Illness

Affiliations

Lipidomic Signatures Align with Inflammatory Patterns and Outcomes in Critical Illness

Junru Wu et al. Res Sq. .

Update in

  • Lipidomic signatures align with inflammatory patterns and outcomes in critical illness.
    Wu J, Cyr A, Gruen DS, Lovelace TC, Benos PV, Das J, Kar UK, Chen T, Guyette FX, Yazer MH, Daley BJ, Miller RS, Harbrecht BG, Claridge JA, Phelan HA, Zuckerbraun BS, Neal MD, Johansson PI, Stensballe J, Namas RA, Vodovotz Y, Sperry JL, Billiar TR; PAMPer study group. Wu J, et al. Nat Commun. 2022 Nov 10;13(1):6789. doi: 10.1038/s41467-022-34420-4. Nat Commun. 2022. PMID: 36357394 Free PMC article.

Abstract

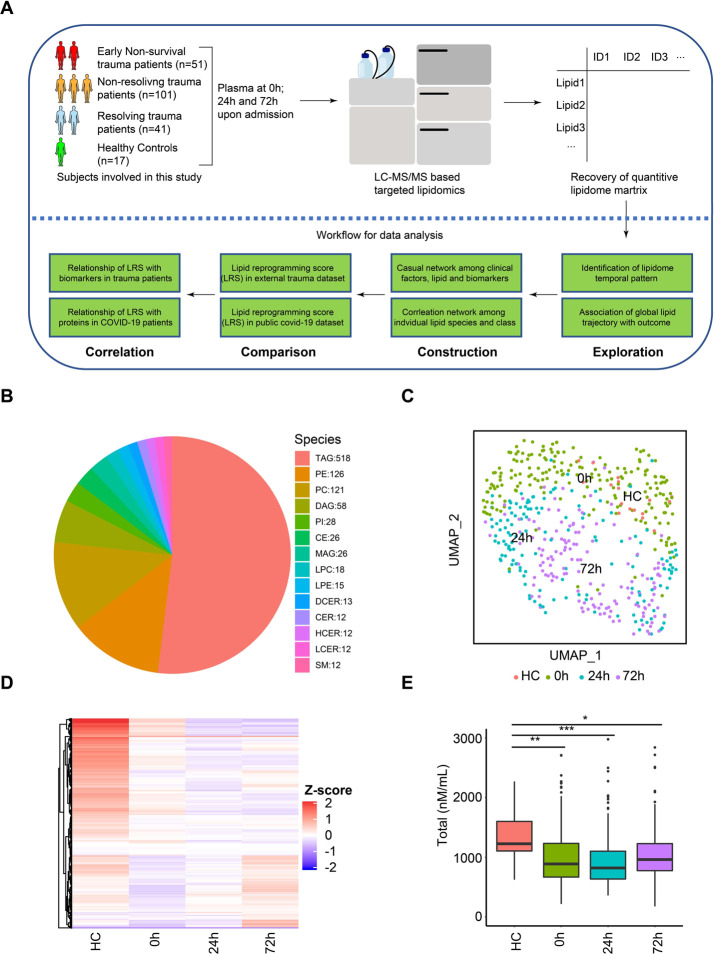
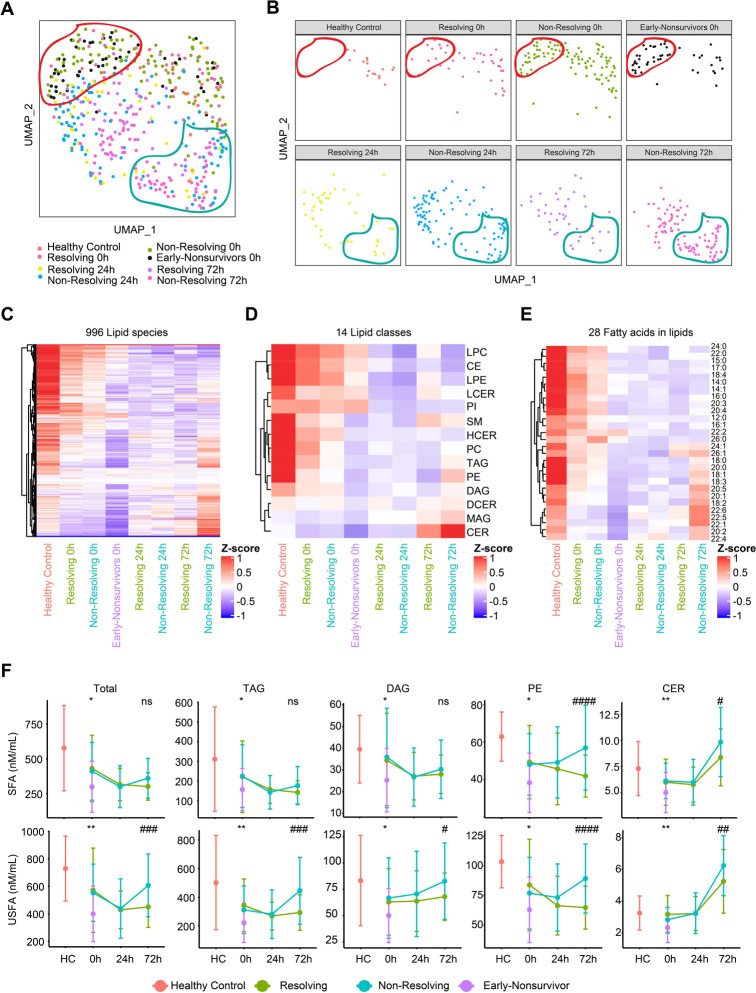
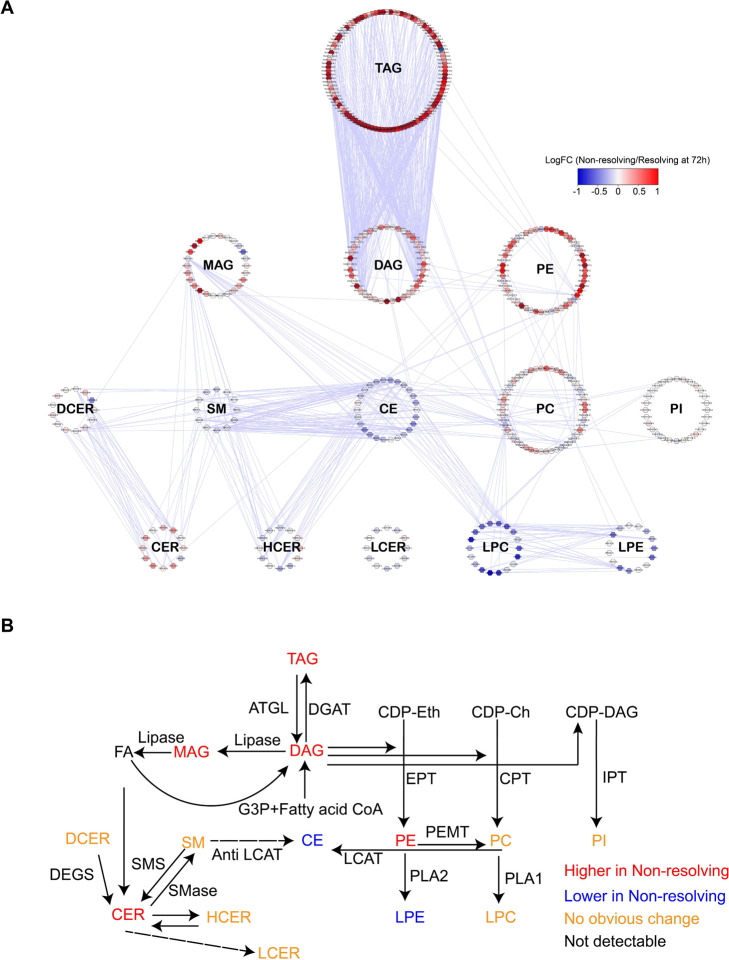
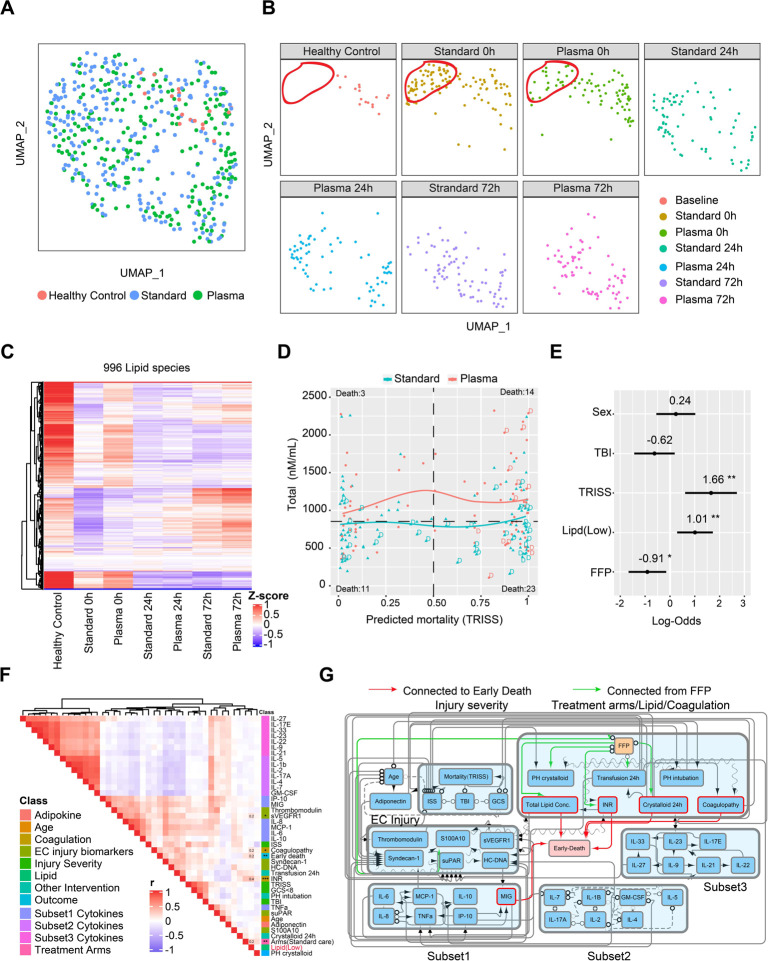
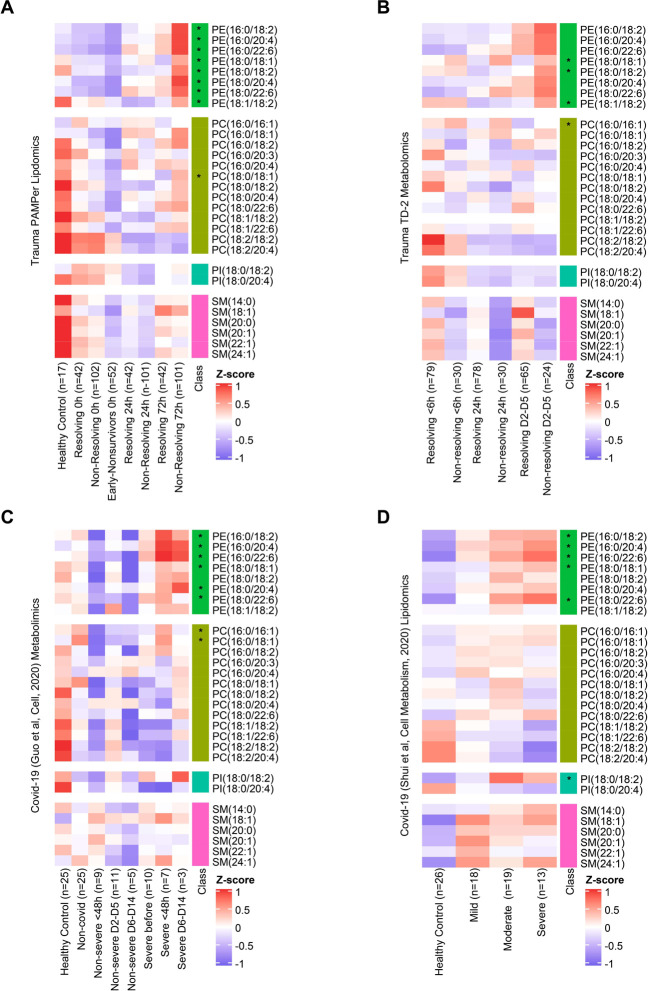
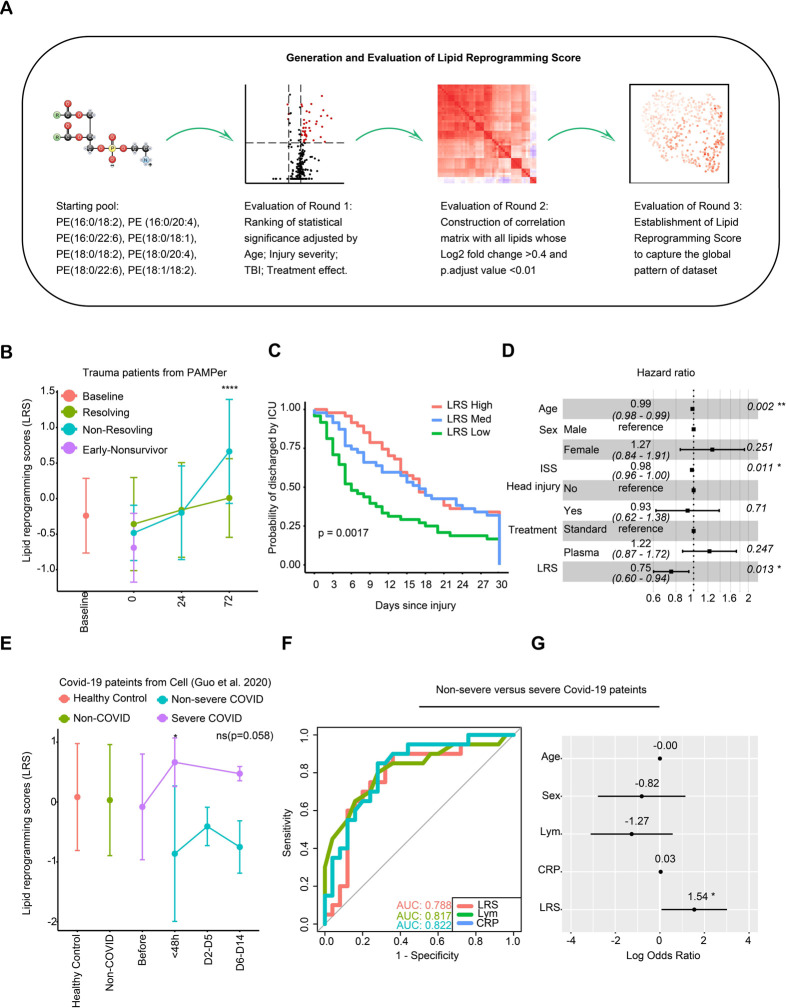
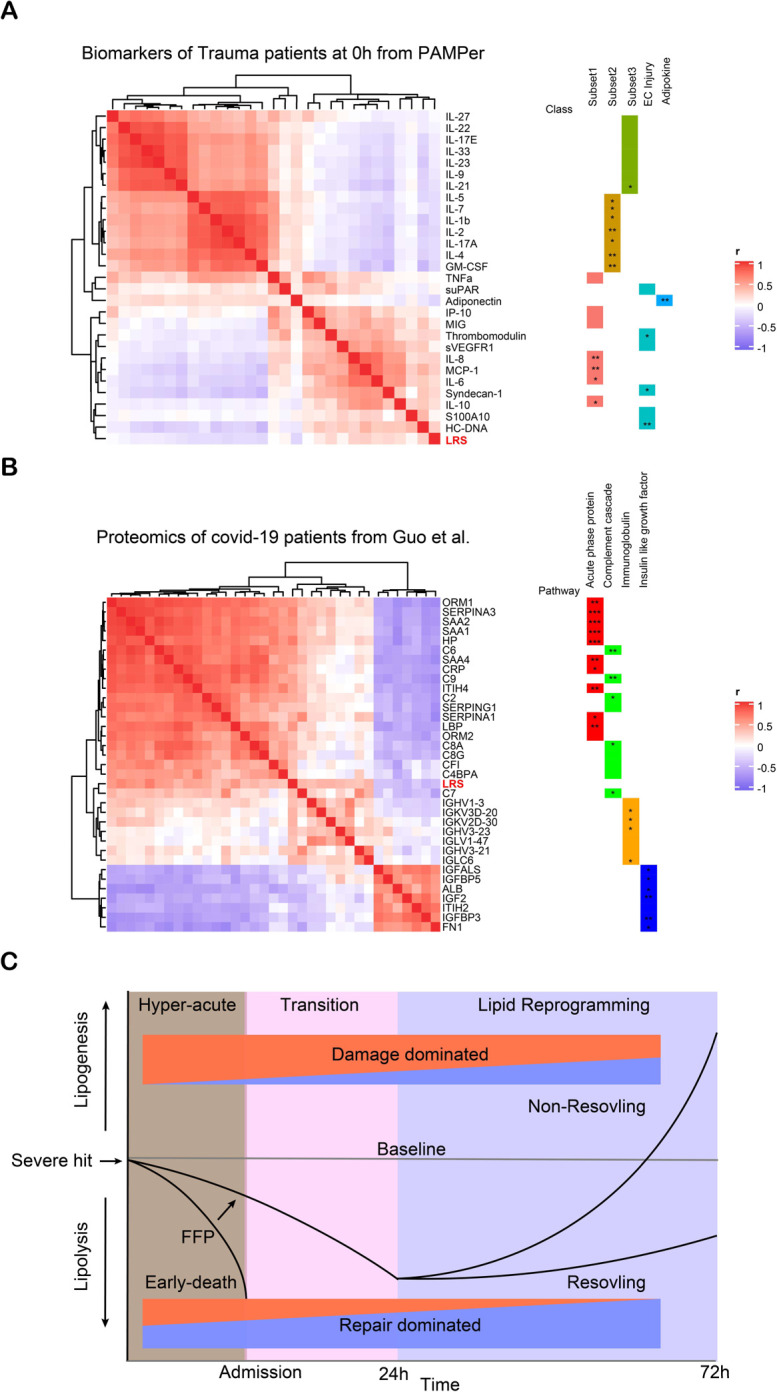
Alterations in lipid metabolism have the potential to be markers as well as drivers of the pathobiology of acute critical illness. Here, we took advantage of the temporal precision offered by trauma as a common cause of critical illness to identify the dynamic patterns in the circulating lipidome in critically ill humans. The major findings include an early loss of all classes of circulating lipids followed by a delayed and selective lipogenesis in patients destined to remain critically ill. Early in the clinical course, Fresh Frozen Plasma administration led to improved survival in association with preserved lipid levels that related to favorable changes in coagulation and inflammation biomarkers. Late over-representation of phosphatidylethanolamines with critical illness led to the validation of a Lipid Reprogramming Score that was prognostic not only in trauma but also severe COVID-19 patients. Our lipidomic findings provide a new paradigm for the lipid response underlying critical illness.


Conflict of interest statement

Declaration of Interests.

The authors declare no competing interests.

Figures

Figure 1.
Figure 1.. Temporal patterns in the circulating lipidome after severe trauma.
(A) Scheme of overall analysis strategy. (B) Representation of 996 lipid species detected in the lipidomic platform grouped by classes. (C) Uniform Manifold Approximation and Projection (UMAP) plot shows the distribution of healthy subjects (n=17) and patients with trauma (n=193), grouped by sampling timepoints (0h, 24h, 72h after admission). (D) Heatmap shows relative levels of 996 lipid species for healthy subjects and trauma patients, grouped by sampling timepoints using z-score normalized concentrations. Lipid species are clustered by Hierarchical clustering. (E) Quantitative comparison of circulating total lipid concentration among healthy controls (HC) and trauma patients, grouped by sampling timepoints. Asterisks indicate statistical significance based on Kruskal-wallis test with post-hoc analysis of Dunn test. The p value was adjusted by the Benjamini-Hochberg method: *, < 0.05; **, < 0.01; ***, < 0.001. Box and whisker plots represent mean value, standard deviation, maximum and minimum values. Abbreviations: TAG, triacylglycerol; DAG, diacylglycerols; MAG, monoacylglycerols; PE, phosphatidylethanolamine; PC, phosphatidylcholine; PI, phosphatidylinositol; LPE, Lysophosphatidylethanolamine; LPC, Lysophosphatidylcholine; CER, Ceramides; HCER, hexosylceramides; LCER, lactosylceramide; DCER, dihydroceramides; CE, cholesterol ester.
Figure 2.
Figure 2.. Association between temporal patterns of the circulating lipidome and outcome
(A-B) Uniform Manifold Approximation and Projection (UMAP) plot shows the distribution of healthy control subjects (n=17) and trauma patients (n=193), grouped together (A) and separated (B) by outcome and sampling timepoints. (C-E) Heatmaps show relative levels of 996 lipid species (C); 14 lipid classes (D) and 28 fatty acids labeled by carbon number: double bonds (E) for healthy subjects and trauma patients, grouped by outcome and sampling timepoints. z-score represents normalized concentrations. Rows are clustered by method of hierarchical clustering. (F) Quantitative comparison of circulating total lipid concentrations among healthy controls (HC) and trauma patients. Lipids are grouped by classes and fatty acids (saturated or unsaturated) identified as the acyl chains in the lipid classes. Patients are grouped by outcome and sampling timepoints. Center dots and error bars represent median value and median absolute deviation, respectively. SFA: saturated fatty acid; USFA: unsaturated fatty acid. Asterisks indicate statistical significance based on Kruskal-wallis test among 3 groups at 0h with post-hoc analysis of Dunn test. The P value was adjusted by Benjamini-Hochberg method: *, < 0.05; **, < 0.01. Number sign indicates statistical significance based on 2-way AVOVA test of time-series analysis of resolving and non-resolving groups. Pairwise Comparisons were conducted by Estimated Marginal Means test. The P value was adjusted by Benjamini-Hochberg method: #, < 0.05; ##, < 0.01; ###, < 0.001, #### < 0.0001.
Figure 3.
Figure 3.. Lipidome network in non-resolving trauma patients at 72h
(A) Correlation network among 412 lipids from 14 classes represented in the lipidomic dataset. Each dot indicates a lipid and is depicted in a circle if it belongs to one class. Highly correlated (Pearson coefficient > 0.7) lipids are represented by edges. Only inter-class correlations are shown. Relative levels are color coded for each lipid species between non-resolving and resolving trauma patients at 72h after admission. (B) Synthesis pathways for the 14 lipid classes summarized from published literature. Colored by differential levels of each lipid class between non-resolving and resolving trauma patients at 72h admission. Abbreviations: ATGL, Adipose Triglyceride Lipase; DAGT, diacylglycerol acyltransferase; G3P, glycerol-3-phosphate; CDP-Eth, Cytidine diphosphate-Ethanolamine; CDP-Ch, Cytidine diphosphate-Choline, CDP-DAG, Cytidine diphosphate-diacylglycerol, EPT, Ethanolamine phosphotransferase; CPT, Choline phosphotransferase; IPT, inositol phosphatidyltransferase. PLA, phospholipase A; PEMT, Phosphatidylethanolamine N-methyltransferase; LCAT, cholesterol acyltransferase; SMS, Sphingomyelin Synthase; SMase, Sphingomyelin phosphodiesterase; DEGS, dihydroceramide desaturase.
Figure 4.
Figure 4.. Potential casual effect for fresh frozen plasma (FFP), Lipid concentration and early mortality
(A-B) Uniform Manifold Approximation and Projection (UMAP) plot shows the distribution of healthy subjects (n=17) and patients with trauma (n=193) (A), separated by treatment arms with sampling timepoints (B). (C) Heatmap show relative levels of 996 lipid species for healthy subjects and trauma patients, grouping by treatment arms and sampling timepoints. Exp, z-score normalized concentration. Rows are clustered by hierarchical clustering. (D) Relationship of predicted mortality and total lipid concentration at 0h upon admission. Trauma patients are grouped by treatment arms; tendency lines are modeled by loess methods for 2 groups separately, dash line in the x-axis means 0.5 and y-axis means the median concentration. D indicates patients who died less than 72h after admission. (E) Forest plot showing log odds ratios from logistical regression of clinical factors; Lipid concentration; FFP effect for early-nonsurvivors versus others. (F) Correlation heatmap showing correlation among cytokines, biomarkers, clinical variables, total lipid concentration and outcome. r: Spearman correlation coefficient. (G) Casual network among factors in (E) constructed by FCI (see also methods). The presence of “edges” or connections between nodes in the graph correspond to conditional dependencies relationships. Orientations in the causal network indicate what can be inferred about the cause-effect relationships between variables in the dataset. A directed edge A --> B indicates that A is a cause of B (i.e., a change in A is expected to affect a change in B). A bidirected edge A <-> B indicates that there is unmeasured confounder affecting both A and B. A partially directed edge A o-> B indicates that B is not a cause of A, but it is unclear whether A is a cause of B or if there is a latent confounder that causes both A and B. An undirected edge A o-o B indicates that we cannot make inferences about the causal orientation of that edge. Abbreviations: TRISS, Trauma and injury severity score; FFP, Fresh frozen plasma; TBI, traumatic brain injury; ISS, injury severity score; GCS, Glasgow coma score; PH; Prehospital; INR, international normalized ratio. Asterisks in (E) indicate statistical significance in multi-variable logistic regression model: *, < 0.05; **, < 0.01. Asterisks in (F) indicate statistical significance for correlation coefficient. P-values are approximated by using the t distributions: *, < 0.05; **, < 0.01; ***, <0.001.
Figure 5.
Figure 5.. Comparison of temporal patterns of common lipids for patients with trauma or COVID-19
(A-D) Heatmaps show the relative levels of 29 common lipid species from four major classes across patients. Data comes from trauma patients from PAMPer lipidomics dataset (A) and TD-2 untargeted metabolomics dataset (B); COVID-19 patients from untargeted metabolomics dataset (Guo et al Cell, 2020) (C) and lipidomics dataset (Shui et al, Cell metabolism, 2020) (D). Patients are grouped by outcome and sampling timepoint (except for D). Asterisks indicate lipids with statistical significance (p value <0.05) and log2 fold change >0.4 by Wilcoxon Rank Sum test between non-resolving and resolving trauma patients at 72h (A); non-resolving and resolving trauma patients at D2–D5 (B); severe and non-severe Covid-19 patients (C); severe and mild Covid-19 patients (D).
Figure 6.
Figure 6.. Lipid Reprogramming Score (LRS) is an independent risk factor for outcome after trauma or COVID-19
(A) Graphical scheme of generation and evaluation of LRS. (B) Comparison of LRS from patients with trauma. Patients are grouped by outcome and sampling timepoint. Center dots and error bars represent median value and median absolute deviation, respectively. (C) Recovery probability (defined as discharged from intensive care unit) of different LRS groups across days after injury revealed by K-M curve. LRS groups are based on tertiles at 72h after admission for each patient. (D) Forest plot showing hazard ratio of clinical factors and LRS score for recovery using a Cox regression model. (E) Comparison of LRS for patients with COVID-19. Patients are grouped with diseases outcome and sampling timepoint. Center dots and error bars represent median value and median absolute deviation, respectively. (F) Comparison of predictive value of LRS, lymphocyte count, and CRP for Non-severe versus Severe outcome for the COVID-19 cohort from Guo et al by ROC curve. (G) Forest plot showing log odds ratio of clinical factors from logistical regression and LRS score for Non-severe versus Severe COVID-19 patients. Abbreviations: ISS, injury severity score; Lym, lymphocyte count; CRP, C-reaction protein. Asterisks in (B) indicate statistical significance in based on 2-way AVOVA test of time-series analysis of resolving and non-resolving groups. Pairwise Comparisons was conducted by Estimated Marginal Means test. The P value was adjusted by Benjamini-Hochberg method: **** < 0.0001. Asterisks in (E) indicate statistical significance based on Kruskal-wallis test among 6 groups of COVID-19 patients with post-hoc analysis of Dunn test. The P value was adjusted by Benjamini-Hochberg method: *, < 0.05. Asterisks in (D&G) indicate statistical significance in multi-variable regression model: *, < 0.05; **, < 0.01.
Figure 7.
Figure 7.. Association between LRS and circulating biomarkers
(A) Heatmap showing correlation of LRS and circulating biomarkers in 0h upon admission in trauma patients, measured by Spearman correlation coefficients. (B) Heatmap showing correlation of LRS and circulating proteins in COVID-19 patients, measured by Spearman correlation coefficients. (C) Schematic of proposed paradigm showing the relationship between circulating lipid levels and outcomes after severe injury. Early loss of circulating lipids correlates with adverse outcomes while failure to resolve critical illness is associated with the selective increase in glycerolipids and PE. Asterisks in (A&B) indicate statistical significance for correlation coefficient. P-values are approximated by using the t distributions: *, < 0.05; **, < 0.01; ***, <0.001.

References

    1. Davidson G. H. et al. Long-term survival of adult trauma patients. JAMA 305, 1001–1007 (2011). - PubMed
    1. Delano M. J. & Ward P. A. The immune system’s role in sepsis progression, resolution, and long-term outcome. Immunol. Rev. 274, 330–353 (2016). - PMC - PubMed
    1. GBD 2016 Causes of Death Collaborators. Global, regional, and national age-sex specific mortality for 264 causes of death, 1980–2016: a systematic analysis for the Global Burden of Disease Study 2016. Lancet 390, 1151–1210 (2017). - PMC - PubMed
    1. Cummings M. J. et al. Epidemiology, clinical course, and outcomes of critically ill adults with COVID-19 in New York City: a prospective cohort study. Lancet 395, 1763–1770 (2020). - PMC - PubMed
    1. Xiao W. et al. A genomic storm in critically injured humans. J. Exp. Med. 208, 2581–2590 (2011). - PMC - PubMed

Publication types

LinkOut - more resources