[Preprint]. 2021 Jan 7:2021.01.07.425621.
doi: 10.1101/2021.01.07.425621.

Molecular dynamics simulations and functional studies reveal that hBD-2 binds SARS-CoV-2 spike RBD and blocks viral entry into ACE2 expressing cells

Affiliations

Molecular dynamics simulations and functional studies reveal that hBD-2 binds SARS-CoV-2 spike RBD and blocks viral entry into ACE2 expressing cells

Liqun Zhang et al. bioRxiv. .

Abstract

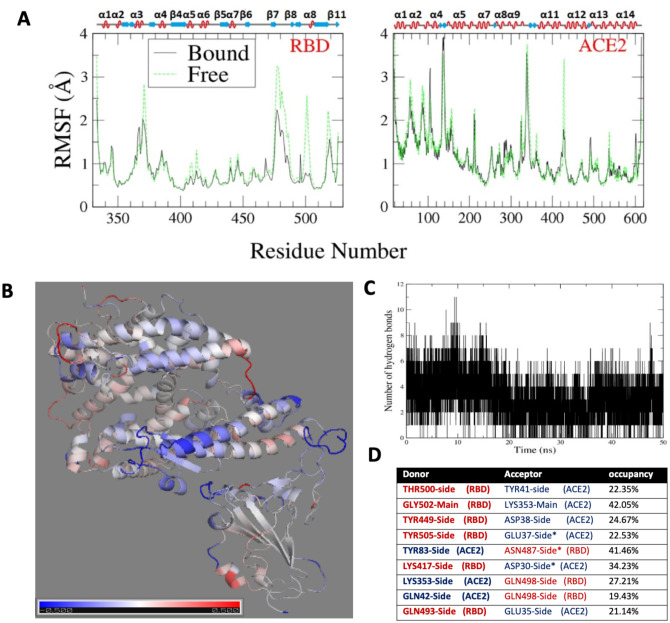
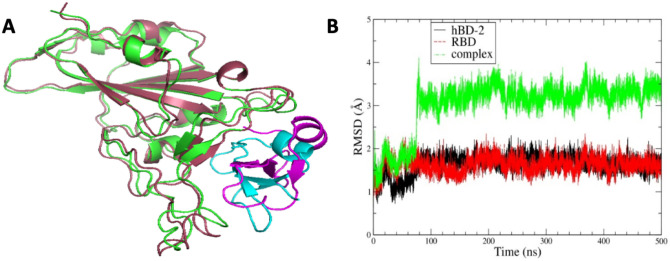
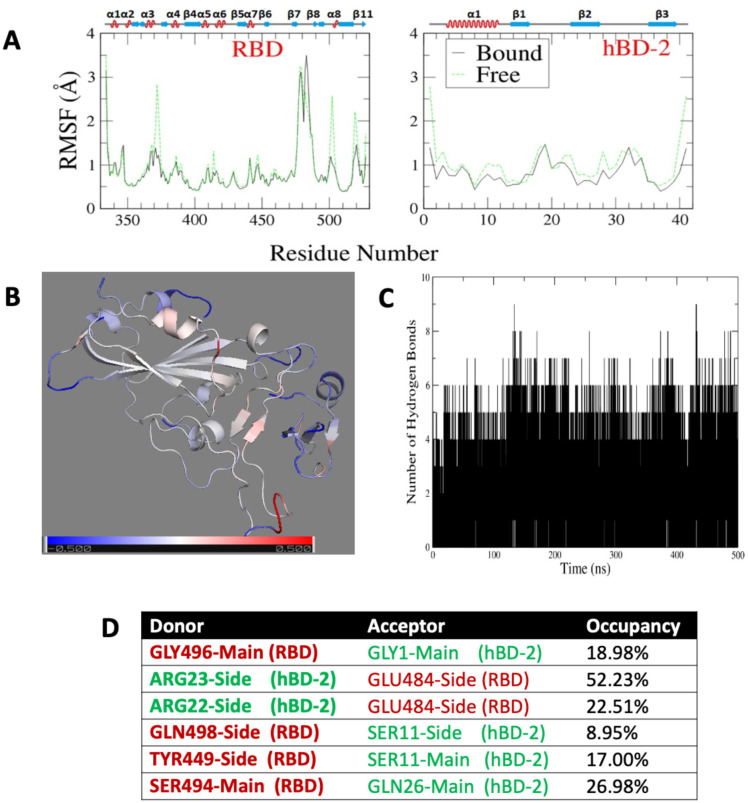
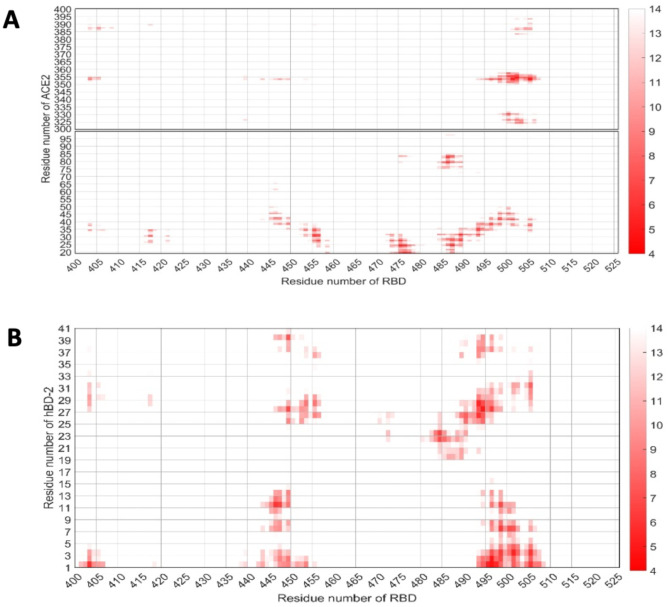
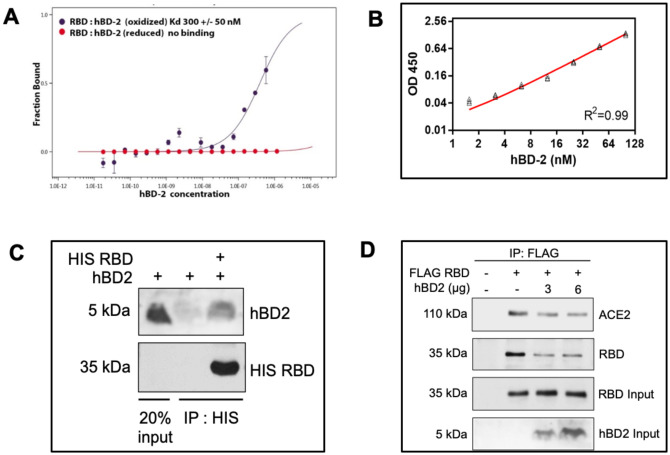
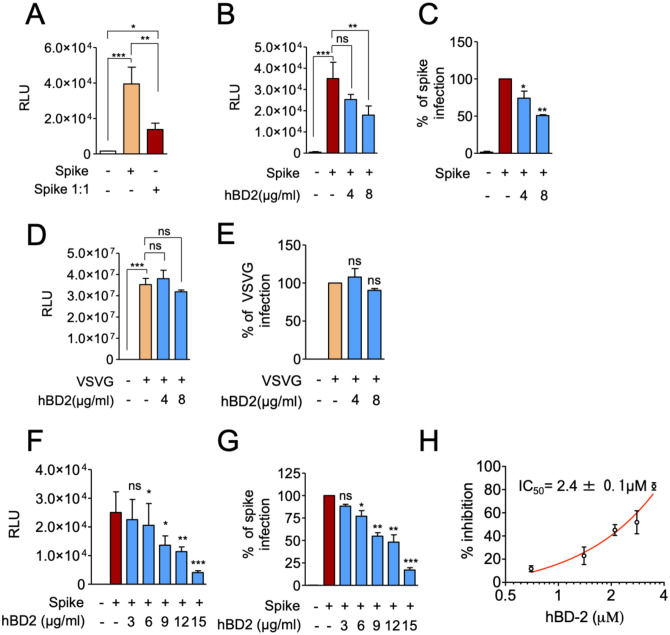
New approaches to complement vaccination are needed to combat the spread of SARS-CoV-2 and stop COVID-19 related deaths and long-term medical complications. Human beta defensin 2 (hBD-2) is a naturally occurring epithelial cell derived host defense peptide that has antiviral properties. Our comprehensive in-silico studies demonstrate that hBD-2 binds the site on the CoV-2-RBD that docks with the ACE2 receptor. Biophysical and biochemical assays confirm that hBD-2 indeed binds to the CoV-2-receptor binding domain (RBD) (KD ~ 300 nM), preventing it from binding to ACE2 expressing cells. Importantly, hBD-2 shows specificity by blocking CoV-2/spike pseudoviral infection, but not VSV-G mediated infection, of ACE2 expressing human cells with an IC50 of 2.4± 0.1 μM. These promising findings offer opportunities to develop hBD-2 and/or its derivatives and mimetics to safely and effectively use as novel agents to prevent SARS-CoV-2 infection.

Keywords: ACE2 receptor; COVID-19; Human beta defensin-2 (hBD-2); SARS-CoV-2; receptor binding domain (RBD).


Conflict of interest statement

DECLARATION OF INTERESTS: None to declare

Figures

Figure 1.
Figure 1.. Molecular dynamics simulations of RBD:ACE2 (as a reference) show protein complex is stable.
(A) RMSF of RBD (left) and ACE2 (right) in the complex over 50 ns in comparison with values for the unbound (free) proteins; the secondary structure of ACE2 and RBD are indicated. (B) Difference in RMSF between bound and free proteins. The data are mapped to the cartoon representation of the complex with color bar (Bottom) indicating the range of -0.5 Å (in blue) to 0.5 Å (in red) (C) Number of hydrogen bonds for the RBD bound to ACE2 over the course of the simulation. (D) Table of most prominent h-bonds and their occupancy
Figure 2.
Figure 2.. Cartoon representation of RBD:hBD-2.
(A) Comparison of the initial and last structure after 500 ns simulation (shown in cyan for hBD-2 and green for RBD and shown in magenta for hBD-2 and raspberry for RBD respectively) after 500 ns all-atom MD simulations for the RBD:hBD2 complex (B) RMSD of proteins in the complex and of the complex itself.
Figure 3.
Figure 3.. The RBD and hBD-2 proteins retain considerable dynamics as a complex.
(A) RMSF of RBD (left) and hBD-2 (right) in the complex over 500 ns in comparison with values for the unbound (free) proteins; the secondary structure of ACE2 and RBD are indicated (B) Difference in RMSF between bound and free proteins. The data are mapped to the cartoon representation of the complex with color bar (Bottom) indicating the range of -0.5 Å (in blue) to 0.5 Å (in red) (C) Number of hydrogen bonds for the RBD bound to hBD-2 over the simulation. (D) Table of most prominent h-bonds and their occupancy.
Figure 4.
Figure 4.. Similar regions/residues are involved in RBD contact with ACE2 as with hBD-2.
(A) Distance map of inter-protein contacts in (A) the RBD:ACE2 complex and (B) the RBD:hBD-2 complex with distances color coded by average proximity over the length of the simulations (see color scale, right).
Figure 5.
Figure 5.. Biophysical and biological assays demonstrating hBD-2 binding to RBD.
(A) Concentration dependent binding of recombinant hBD-2 (rhBD-2) to fluorescently labeled recombinant RBD (rRBD), as measured by miscroscale thermophoresis. HBD-2 was used under oxidizing (black data points) and under reducing conditions (red). (B) Functional ELISA assay showing that rhBD-2 binds to immobilized rRBD with a linear range of concentrations (1.5 to 100nM). (C) Recombinant His-RBD (5 μg) and hBD-2 (7.5 μg) were incubated as described in Methods and precipitated with Ni-NTA beads to pulldown His-tagged-RBD. Co-precipitation of hBD-2 was assessed by Western blotting. Lane 1 shows 20% input of hBD-2 and lane 2 shows Ni-NTA precipitation to examine background binding of hBD-2 to the beads. Data is representative of three independent experiments. (D) ACE2 HEK 293T cells were incubated with FLAG-RBD, with and without hBD-2 at indicated concentrations. Anti-FLAG immunoprecipitation was performed to precipitate ACE2 bound to FLAG-RBD and to assess the effect on hBD-2 addition of RBD:ACE2 binding. Data is representative of two biological replicates.
Figure 6.
Figure 6.. HBD2 inhibits CoV-2 spike-pseudotyped virus entry into ACE2 293T cells.
(A) ACE2 HEK 293T cells were infected with CoV-2 Spike-pseudotyped virus and luciferase activity was assessed at 48 hours post infection. (B) Effect of hBD2 on CoV-2 Spike-pseudotyped virus cell entry was assessed as in A. (C) Percentage infection was calculated from the RLU values in (B) taking spike alone group as 100%. (D) Effect of hBD2 on VSVG-pseudotyped virus entry was assessed as in (A). (E) Percentage infection was calculated from the RLU values in (D) taking VSVG alone group as 100%. (F) Titration of hBD2 concentration (0–15 μg/ml) on spike-mediated pseudovirus entry and luciferase activity. (G) Percentage of spike infection was calculated from the RLU values in (F) taking spike alone group as 100%. (H) hBD2-mediated percent inhibition of spike-viral entry and IC50 was calculated by plotting hBD2 concentration (in μM) against % inhibition observed. Values given are Mean ± SEM of two independent experiments done in triplicates. ***p < 0.001, **p < 0.01, *p < 0.05, and ns (non-significant) against CoV-2 spike-pseudotyped virus alone treated group.

Similar articles

References

    1. Alcayaga-Miranda F., Cuenca J., and Khoury M. (2017). Antimicrobial Activity of Mesenchymal Stem Cells: Current Status and New Perspectives of Antimicrobial Peptide-Based Therapies. Front Immunol 8, 339. - PMC - PubMed
    1. Amaro R.E., and Mulholland A.J. (2020). Biomolecular Simulations in the Time of COVID19, and After. Comput Sci Eng 22, 30–36. - PMC - PubMed
    1. Barros E.P., Casalino L., Gaieb Z., Dommer A.C., Wang Y., Fallon L., Raguette L., Belfon K., Simmerling C., and Amaro R.E. (2020). The Flexibility of ACE2 in the Context of SARS-CoV-2 Infection. Biophys J. - PMC - PubMed
    1. Bensch K.W., Raida M., Mägert H.J., Schulz-Knappe P., and Forssmann W.G. (1995). hBD-1: a novel beta-defensin from human plasma. FEBS Lett 368, 331–335. - PubMed
    1. Brielle E.S., Schneidman-Duhovny D., and Linial M. (2020). The SARS-CoV-2 Exerts a Distinctive Strategy for Interacting with the ACE2 Human Receptor. Viruses 12. - PMC - PubMed

Publication types

LinkOut - more resources