. 2021 Apr;19(4):623-635.
doi: 10.1158/1541-7786.MCR-20-0949. Epub 2020 Dec 18.

Genomic Alterations during the In Situ to Invasive Ductal Breast Carcinoma Transition Shaped by the Immune System

Affiliations

Genomic Alterations during the In Situ to Invasive Ductal Breast Carcinoma Transition Shaped by the Immune System

Anne Trinh et al. Mol Cancer Res. 2021 Apr.

Abstract

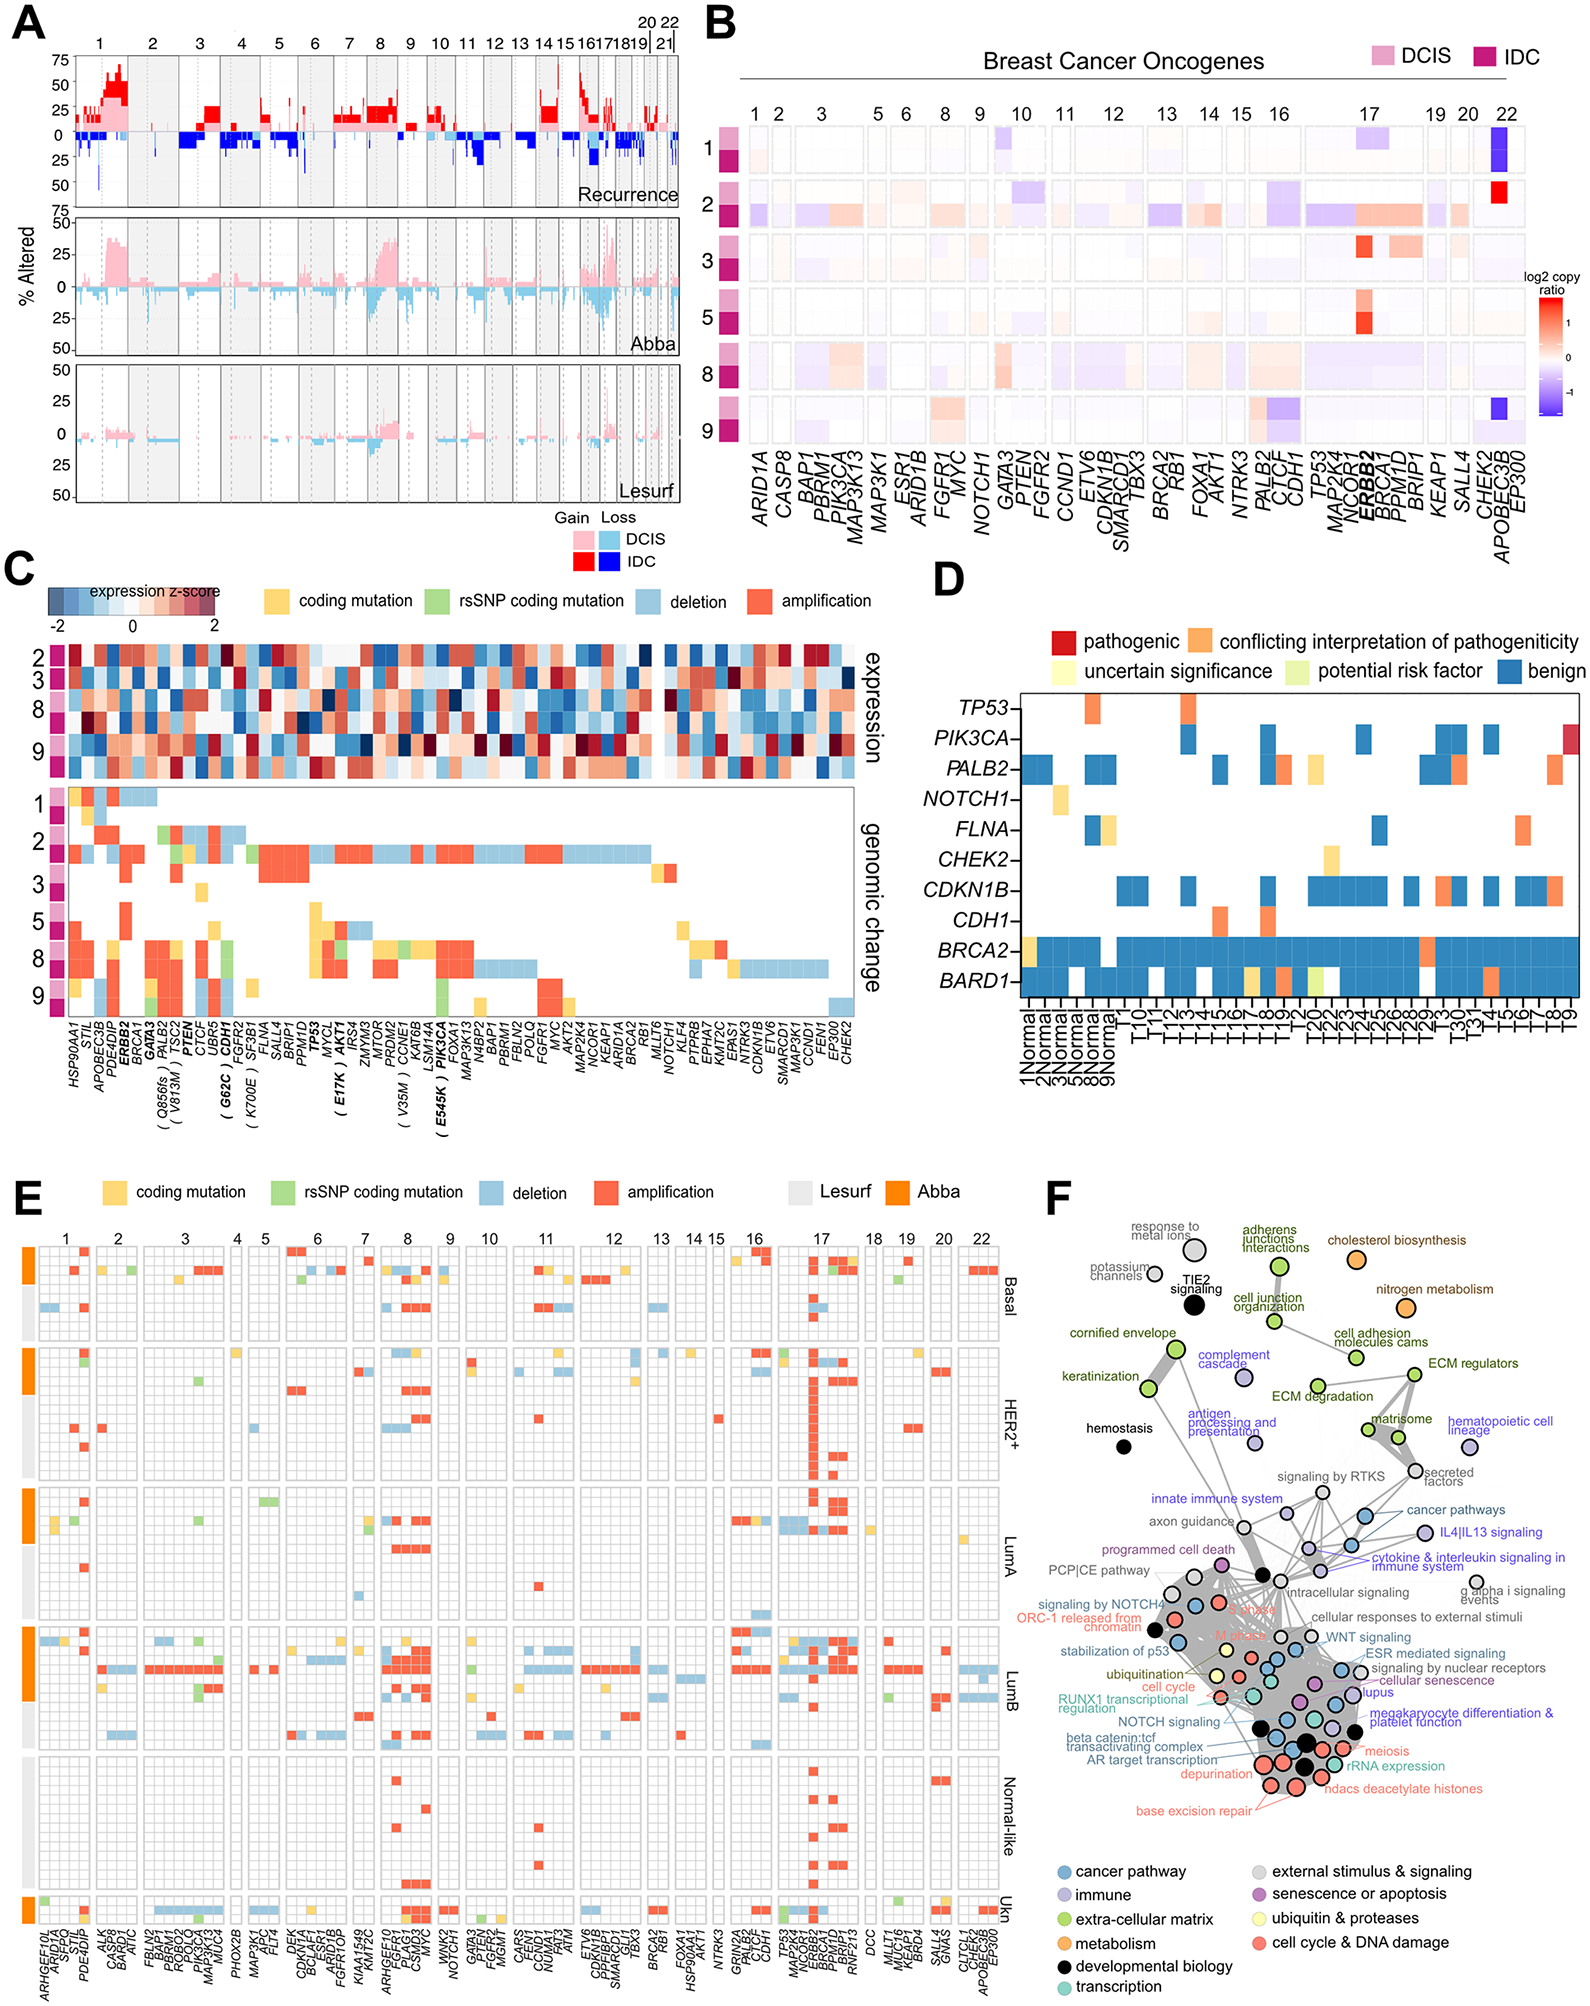
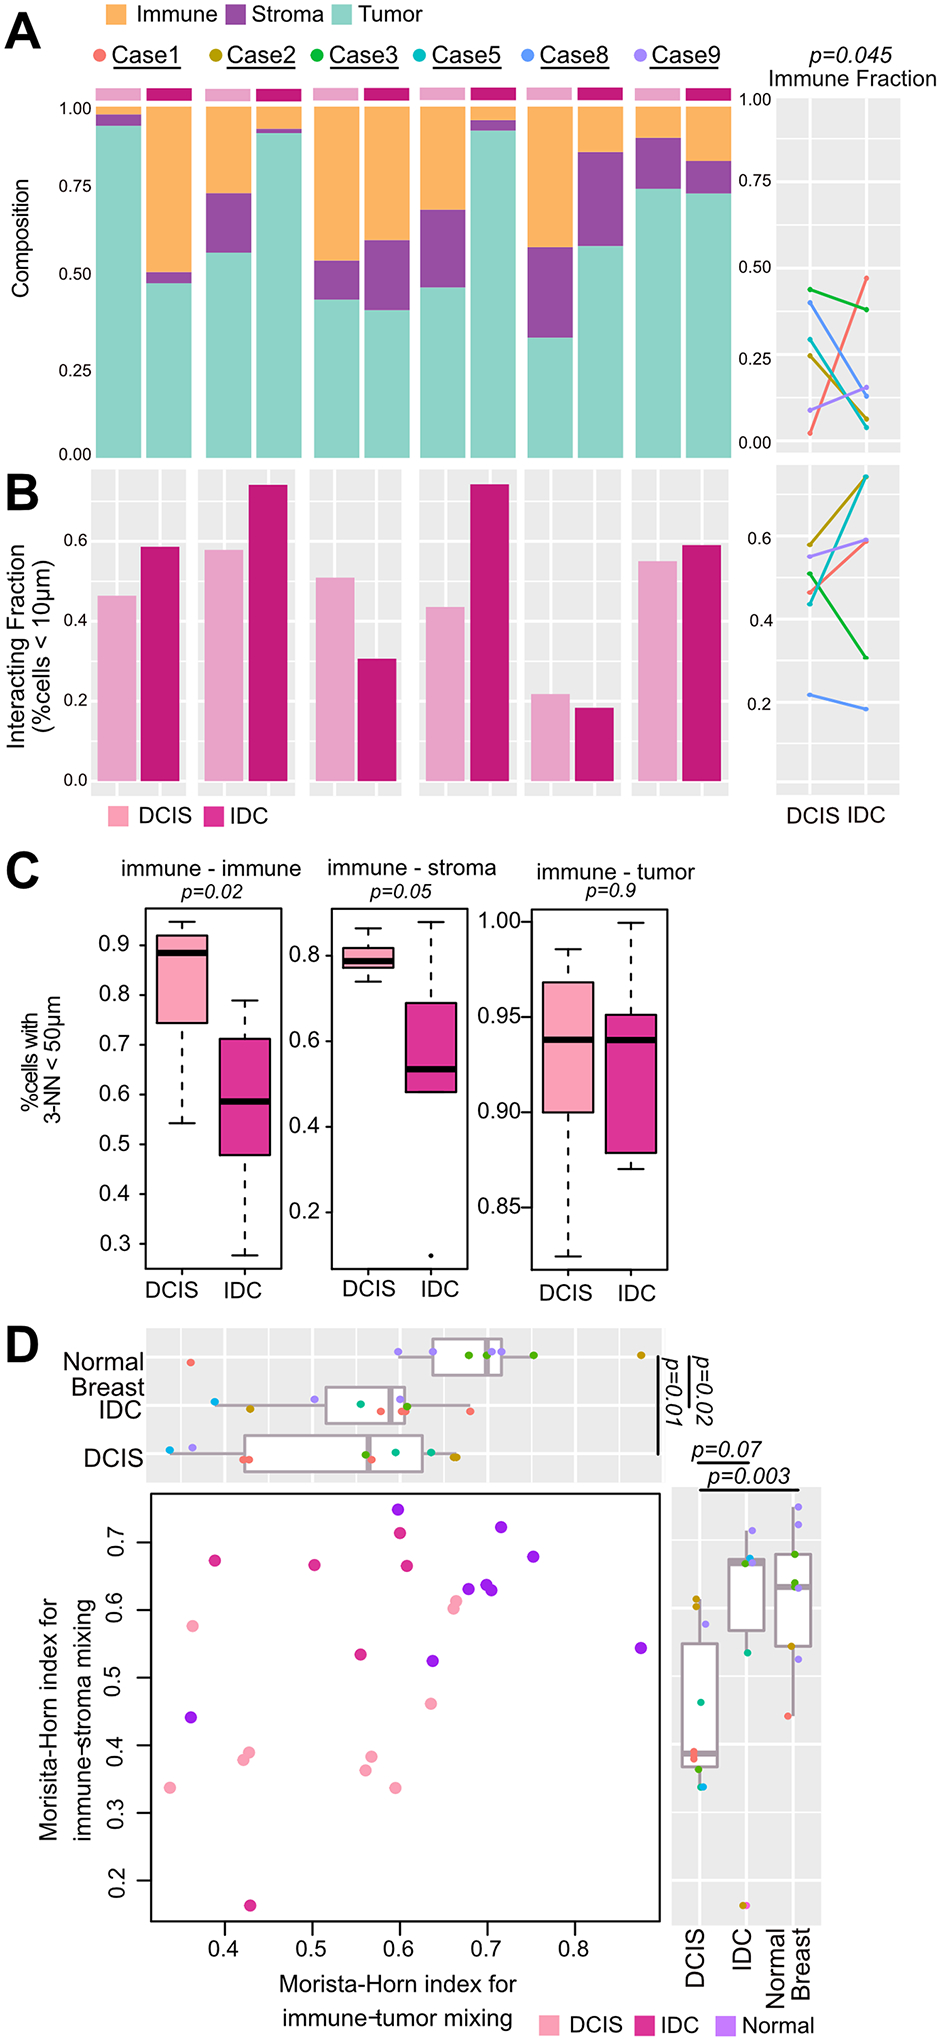
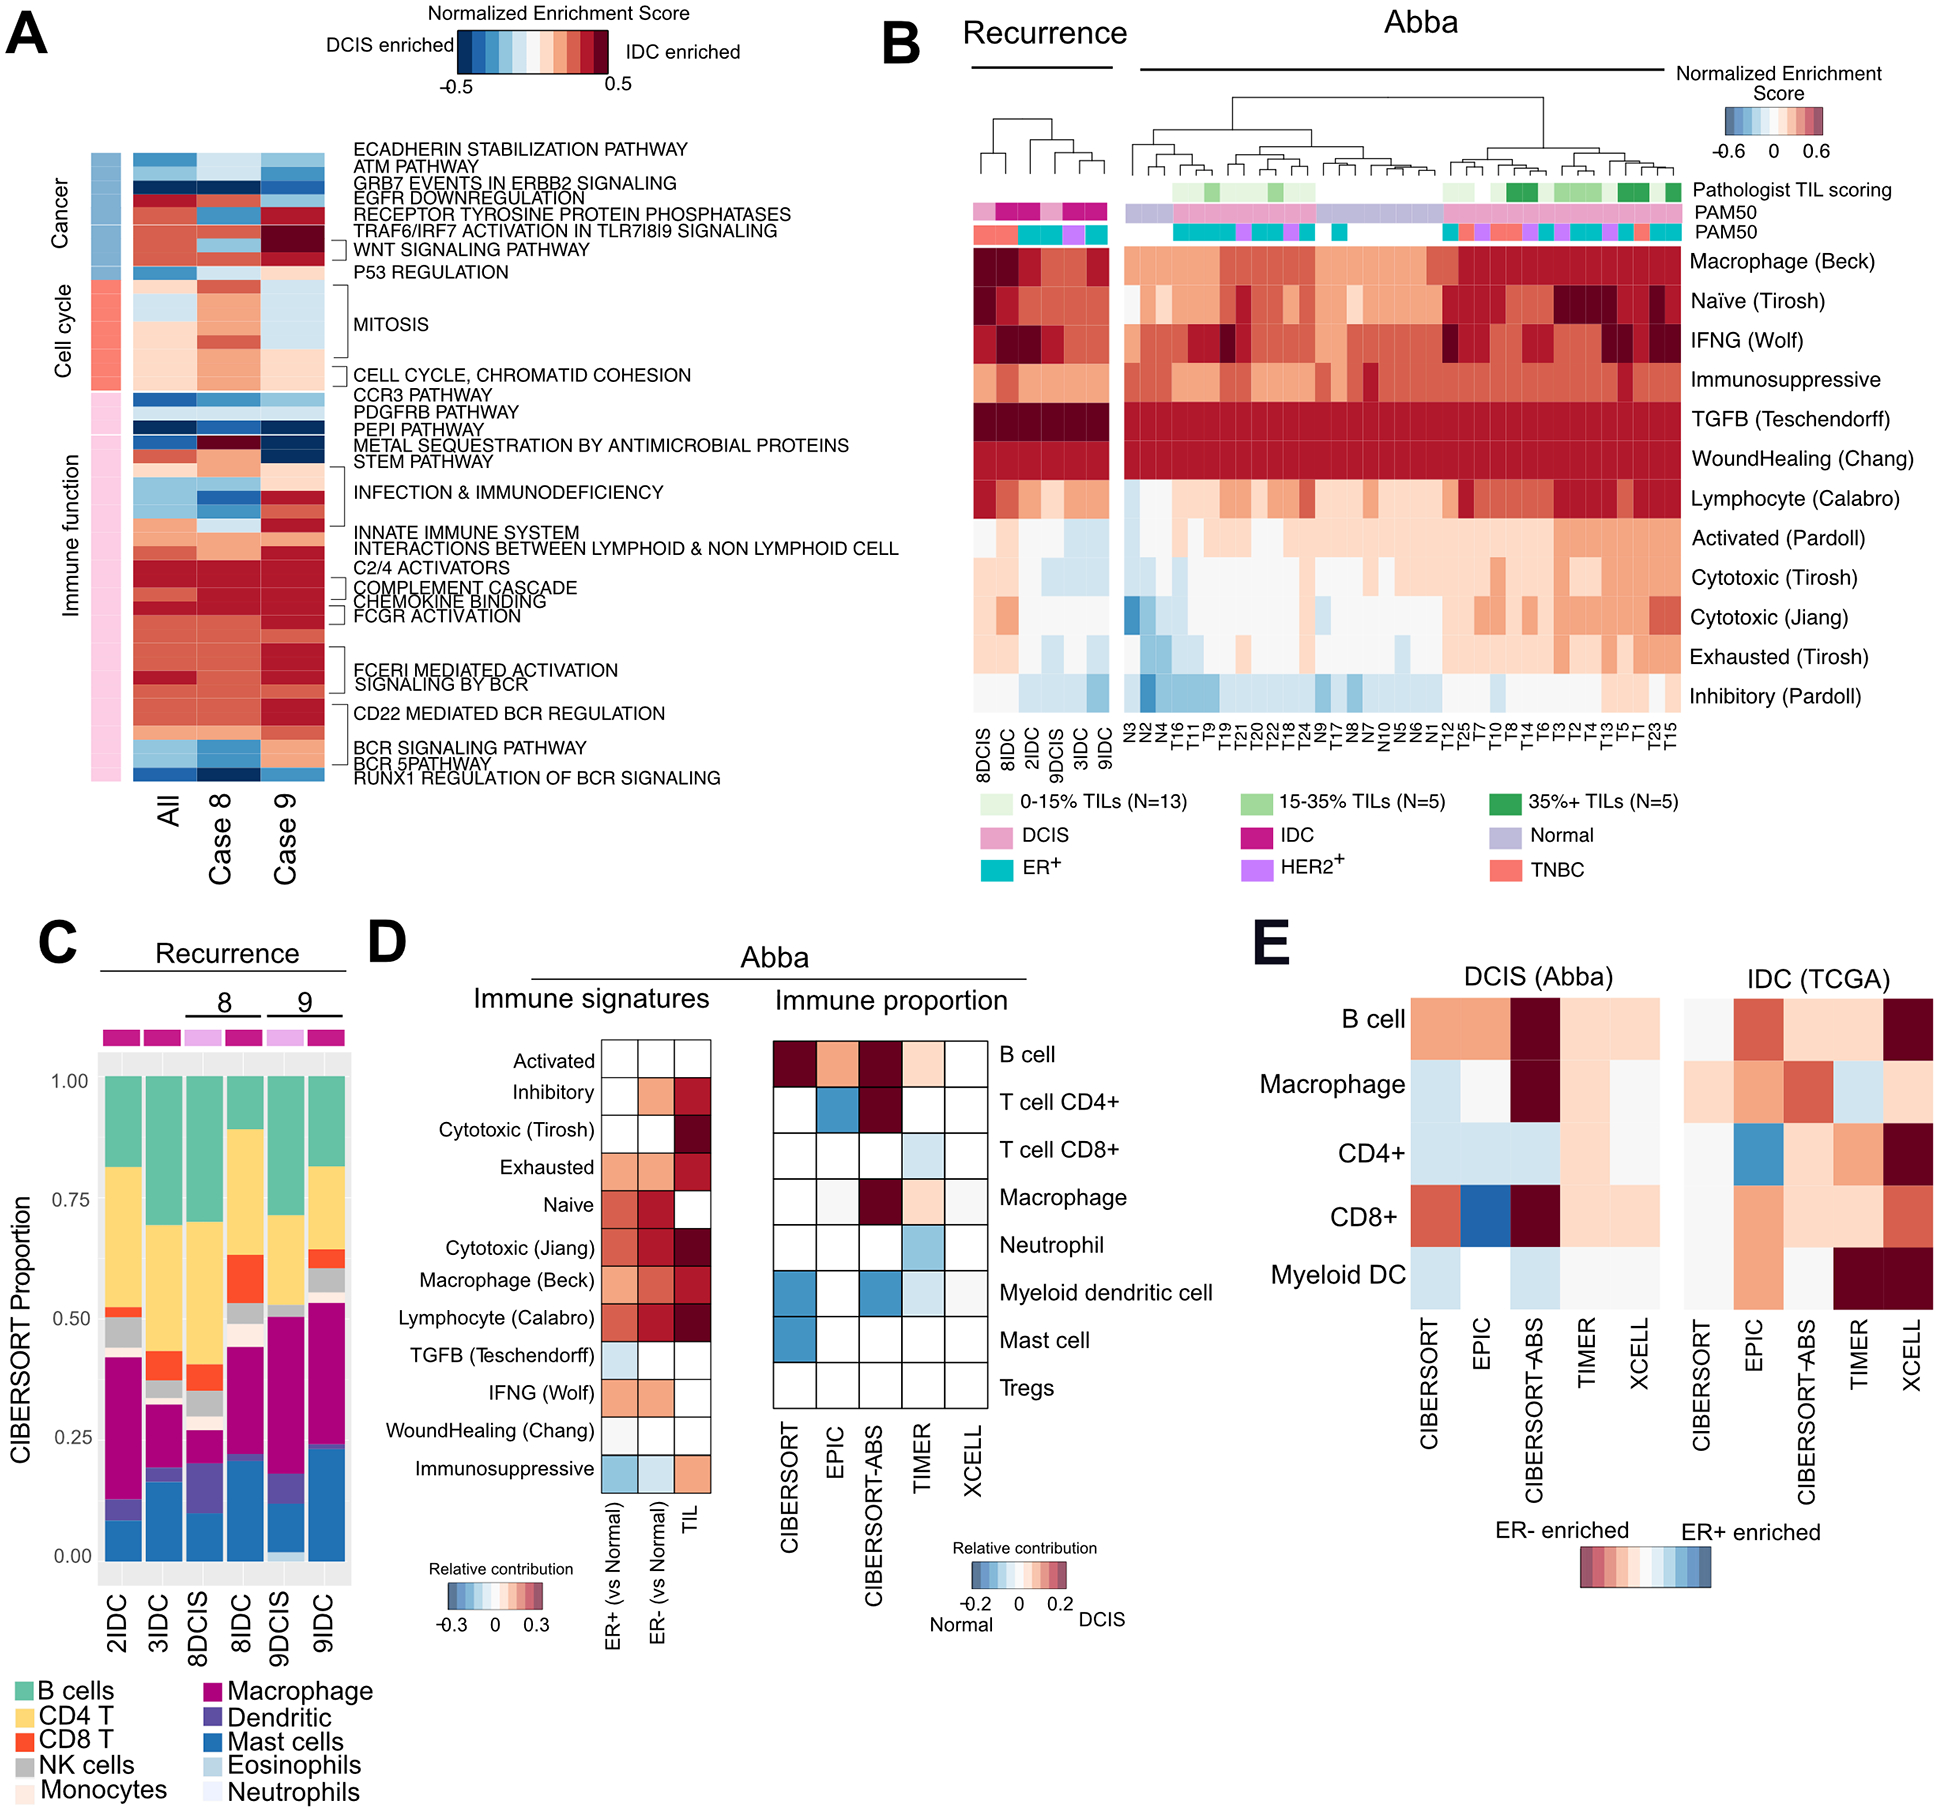
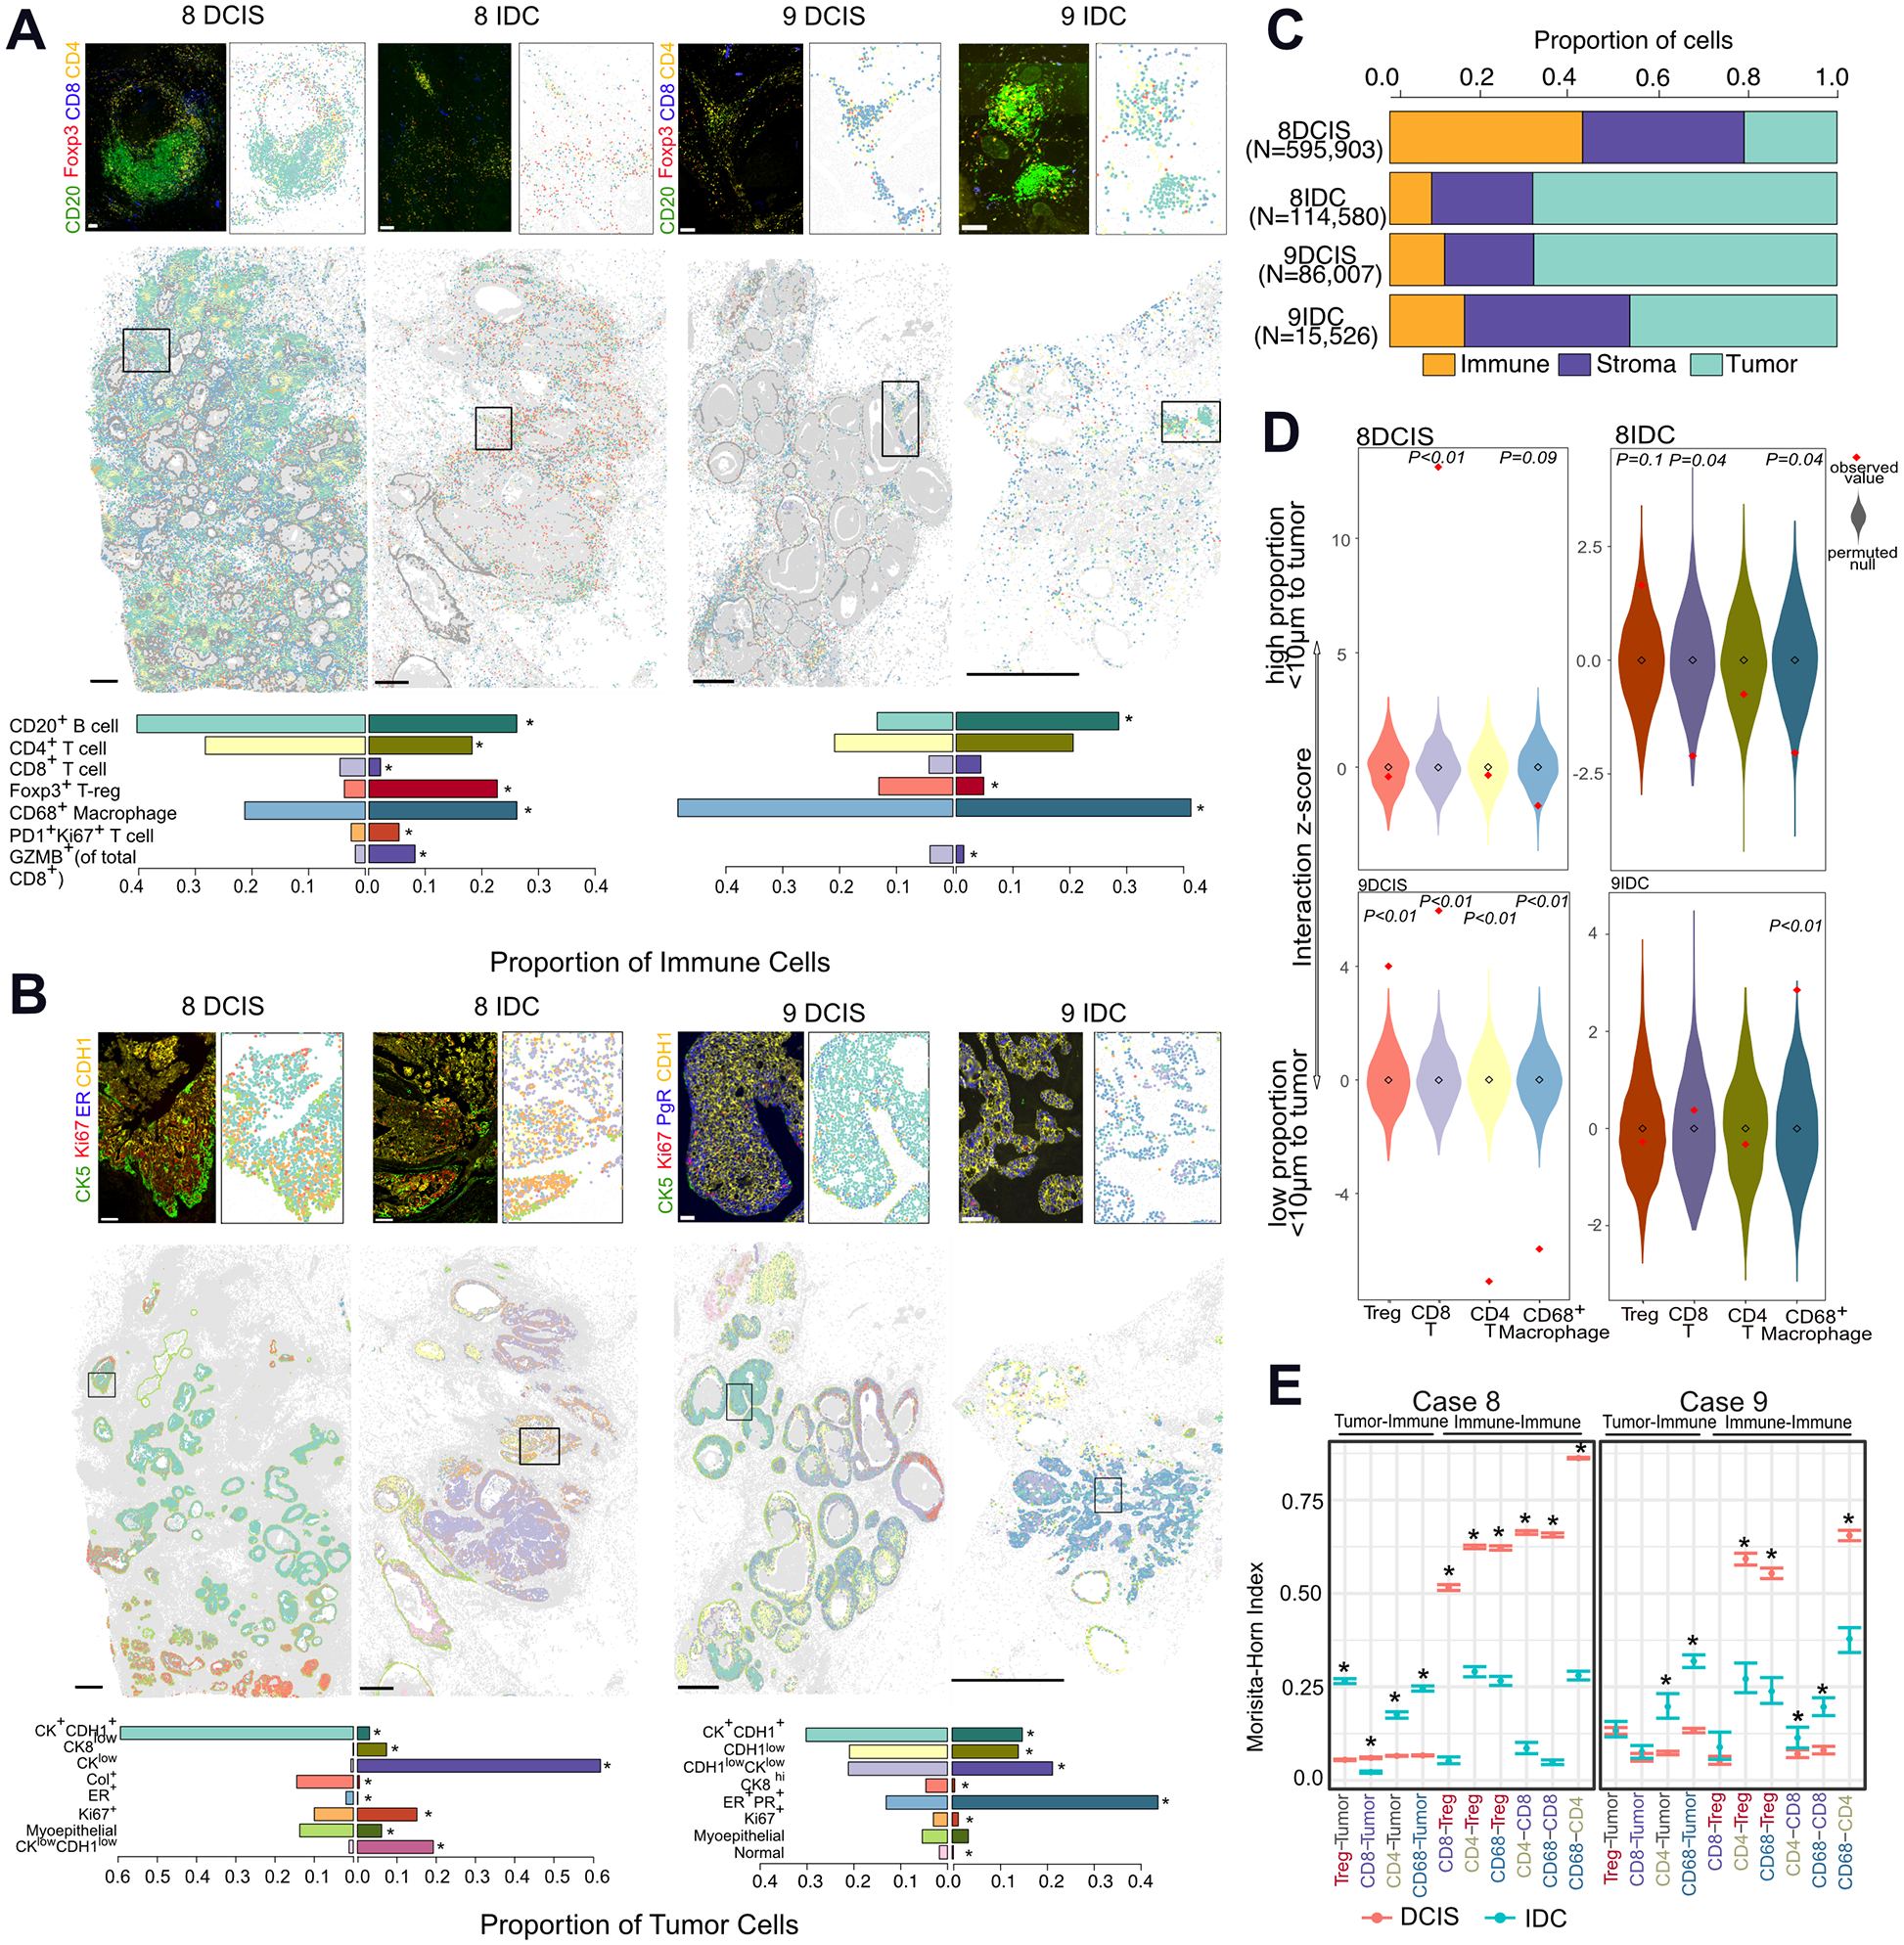
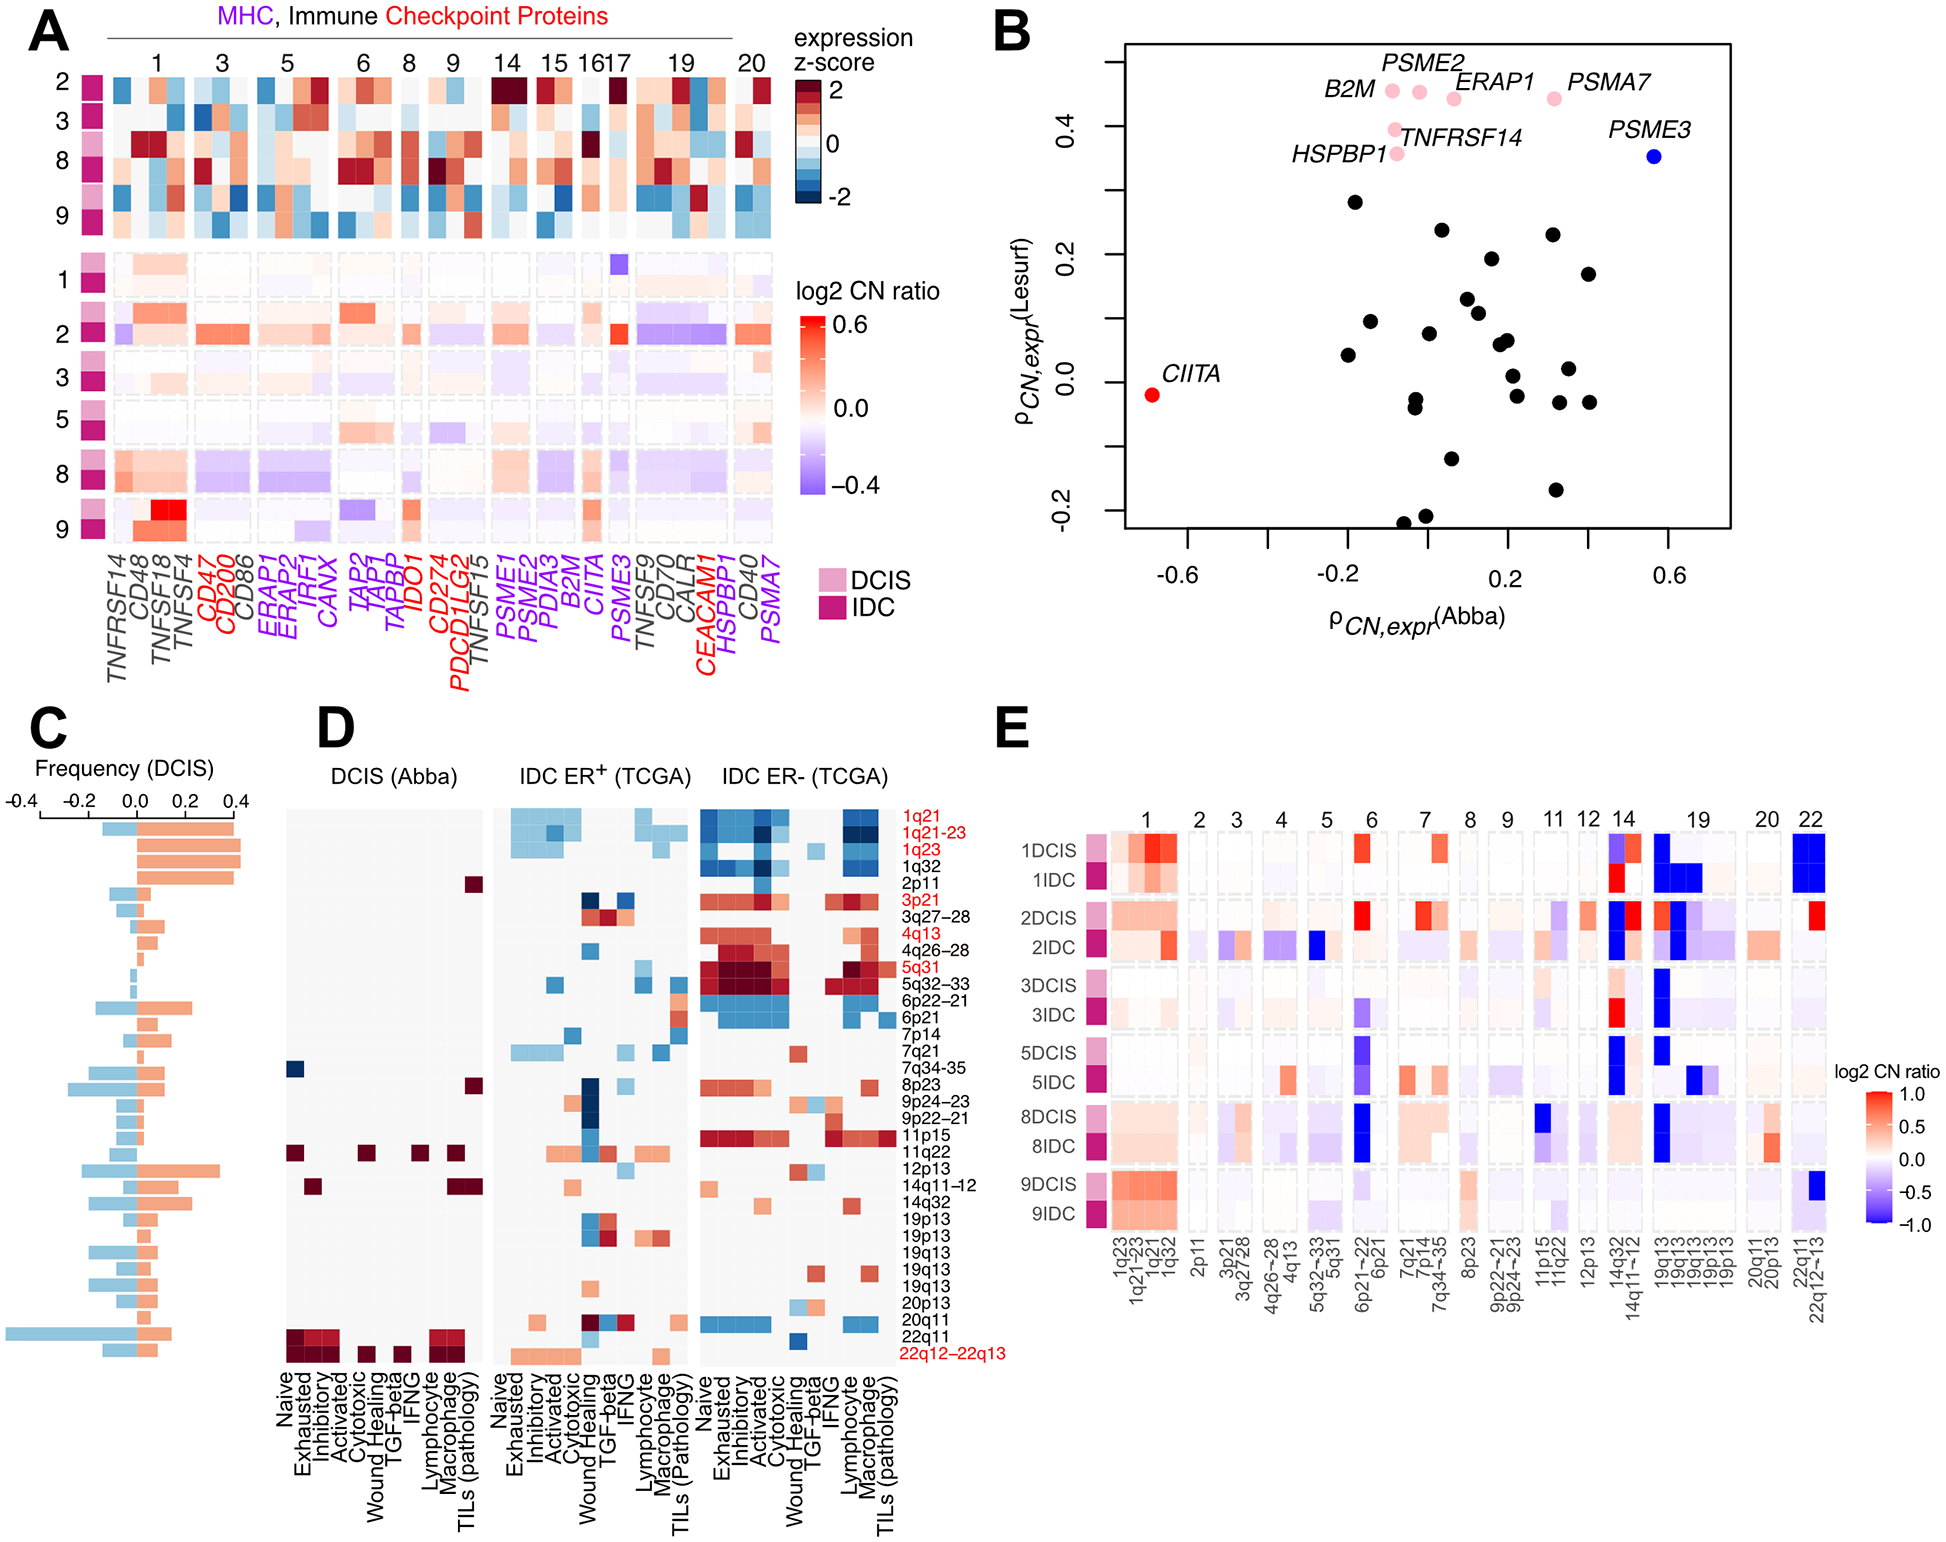
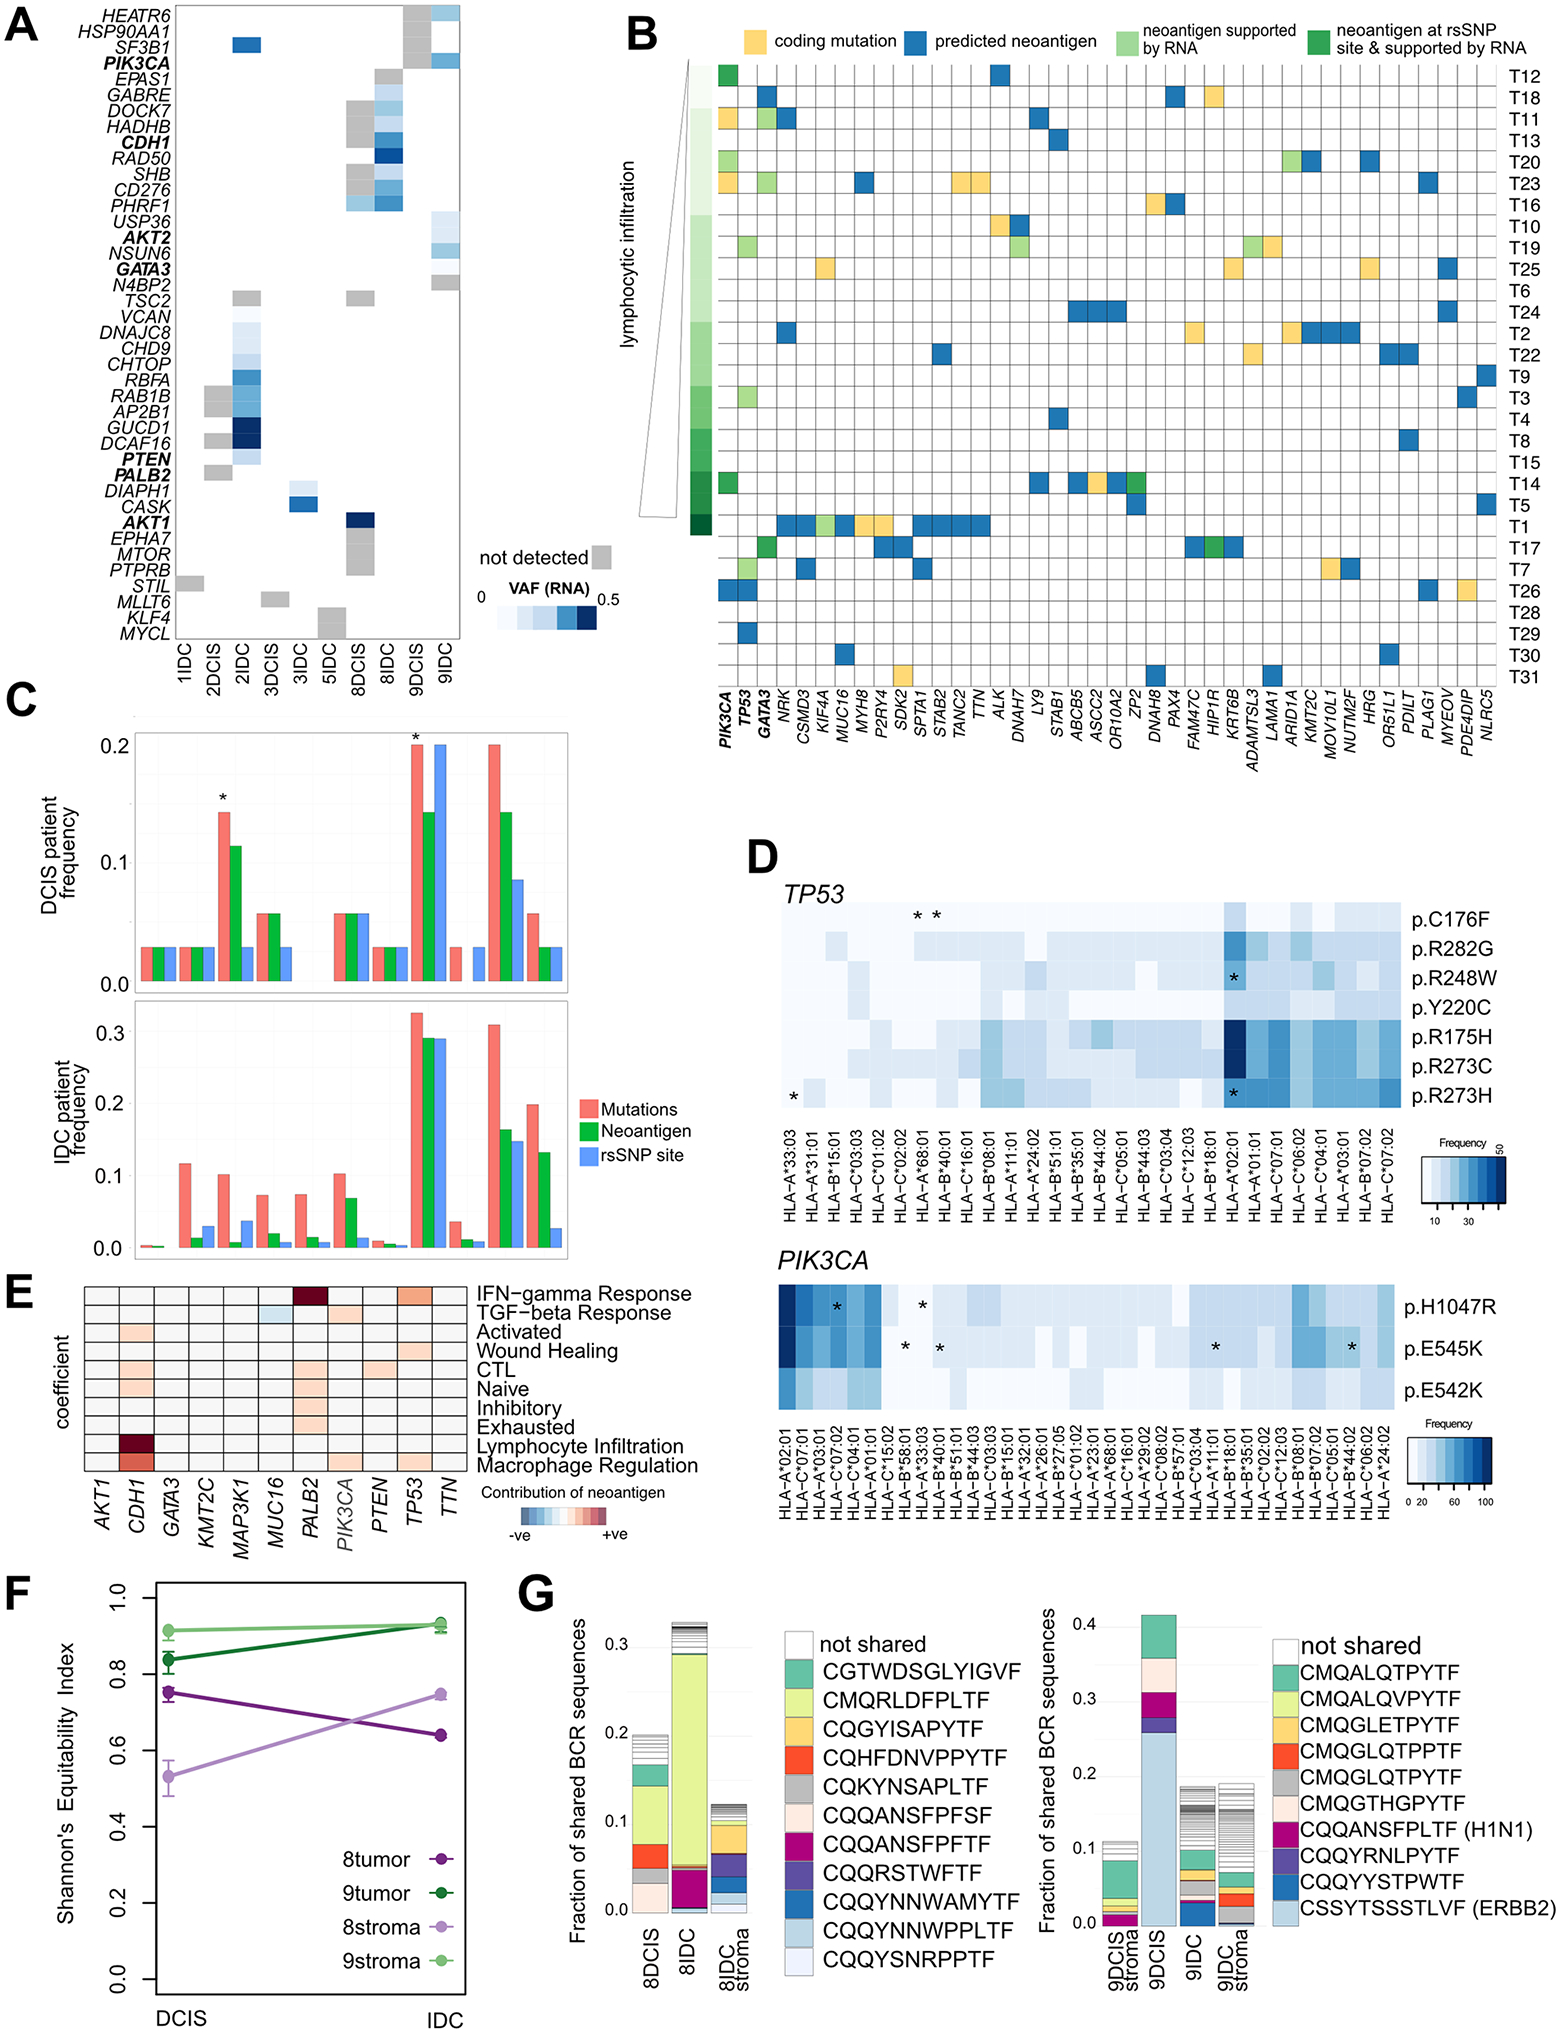
The drivers of ductal carcinoma in situ (DCIS) to invasive ductal carcinoma (IDC) transition are poorly understood. Here, we conducted an integrated genomic, transcriptomic, and whole-slide image analysis to evaluate changes in copy-number profiles, mutational profiles, expression, neoantigen load, and topology in 6 cases of matched pure DCIS and recurrent IDC. We demonstrate through combined copy-number and mutational analysis that recurrent IDC can be genetically related to its pure DCIS despite long latency periods and therapeutic interventions. Immune "hot" and "cold" tumors can arise as early as DCIS and are subtype-specific. Topologic analysis showed a similar degree of pan-leukocyte-tumor mixing in both DCIS and IDC but differ when assessing specific immune subpopulations such as CD4 T cells and CD68 macrophages. Tumor-specific copy-number aberrations in MHC-I presentation machinery and losses in 3p, 4q, and 5p are associated with differences in immune signaling in estrogen receptor (ER)-negative IDC. Common oncogenic hotspot mutations in genes including TP53 and PIK3CA are predicted to be neoantigens yet are paradoxically conserved during the DCIS-to-IDC transition, and are associated with differences in immune signaling. We highlight both tumor and immune-specific changes in the transition of pure DCIS to IDC, including genetic changes in tumor cells that may have a role in modulating immune function and assist in immune escape, driving the transition to IDC. IMPLICATIONS: We demonstrate that the in situ to IDC evolutionary bottleneck is shaped by both tumor and immune cells.


Conflict of interest statement

Conflicts of Interest Statement: C.J.W. is a cofounder of Neon Therapeutics, and a member of its scientific advisory board. K.P. is a member of the scientific advisory board of Acrivon Therapeutics and Scorpion Therapeutics, has equity positions in Scorpion Therapeutics, and is a consultant to twoXAR Pharmaceuticals. S.A.S. had previously served as a paid consultant for Neon Therapeutics and owns equity in Agenus Inc., Agios Pharmaceuticals, Breakbio Corp., Bristol-Myers Squibb, and NewLink Genetics. J.W.G. has licensed technologies to Abbott Diagnostics and Danaher and has equity positions in PDX Pharmaceuticals and Convergent Genomics. J.W.G. serves as an advisor to New Leaf Ventures and KromaTid. J.W.G receives research funding or other support from Zeiss, ThermoFisher (FEI), Danaher (Cepheid), Micron Technology, Inc, Miltenyi Biotec, PDX Pharmaceuticals, and Quantitative Imaging (Qi).

Figures

Figure 1.
Figure 1.. Copy number alterations and somatic mutations in the DCIS-to-IDC transition.
A, Genome-wide summary of proportion of patients with observed CNAs in the Recurrence (our data), Abba (5), and Lesurf (16) cohorts. A z-score of 2 in GATK CNV was set to call gains and losses in the recurrence and Abba cohorts (exome-seq), and a threshold of ±0.3 in the Lesurf set (aCGH). Both DCIS and IDC samples are shown in the recurrence cohort. B, Summary of CNAs in breast cancer-associated oncogenes and tumor suppressors in the recurrence cohort. C, Summary of cancer-related CNAs and coding mutations in the recurrence cohort, and corresponding gene expression profiles. D, variants found in adjacent normal mammary tissue. E, Summary of cancer-related CNAs and mutations in the Abba and Lesurf cohorts grouped by PAM50 subtype. F, Pathways implicated by genetic changes in all three cohorts and by RNA-expression in the Abba cohort comparing DCIS to normal. Circle size reflective of the average enrichment score and line width reflective of the number of common genes in two pathways.
Figure 2.
Figure 2.. Immune composition and spatial distribution in DCIS and IDC.
A-C, Compositional and spatial features in the recurrence set based on whole slide H&E images. A, Cellular composition. Significance computed using a beta-regression for bounded fractions (P=0.009) and by paired one-tailed t-test (P=0.045). B, Proportion of immune cells within 10μm of an epithelial cell within digitally macrodissected DCIS, IDC or normal regions. C, Proportion of cells with k-Nearest neighbor (k=3) distances less than 50μm. Significance computed using Wilcoxon rank sum test and beta-regression for bounded fractions (PImmune-Immune=0.003, PImmune-Stroma=0.02). D, Morisita-Horn index of tumor-lymphocyte and stroma-lymphocyte mixing in digitally macrodissected DCIS, IDC or normal regions. Significance between groups computed using Wilcoxon rank sum test.
Figure 3.
Figure 3.. Immune expression signature analysis in DCIS and IDC.
A, Enriched pathways in DCIS compared to IDC across all cases, case 8 and case 9 (FDR<0.1). B, Heatmap of single-sample GSEA scores for published immune signatures in the recurrence and Abba cohort. C, Immune composition of tumors inferred by CIBERSORT in the recurrence cohort D, Heatmap showing relative contribution of ER status and TILs to immune signatures, and the enrichment of immune cell types in normal compared to DCIS using several deconvolution methods. Only significant contributors are shown (P<0.05, Wilcoxon rank sum test for enrichment scores, beta-regression for proportion data). E, Comparison of enriched immune subsets in ER+ and ER DCIS and IDC. Only significant contributors are shown (P<0.05, Wilcoxon rank sum test for enrichment scores, beta-regression for proportion data).
Fig. 4.
Fig. 4.. Cyclic immunofluorescence in DCIS-to-IDC.
A, Whole slide image of classified immune cells in cases 8 and 9, representative image, and relative proportions of immune cells in each sample. Scale bar whole slide image: 1mm, insert: 100μm. Differences were computed using proportionality test, *P <0.05. B, Whole slide image of classified tumor cells in cases 8 and 9, representative image, and relative proportions of tumor cells in each sample. Scale bar whole slide image: 1mm, insert: 100μm. C, Cellular composition in each sample. D, Z-score of the interacting fraction of immune cells to tumor cells. Null distribution was calculated from 1000 permutations of immune cell labels E, Morisita-Horn index of spatial correlation of two interacting-cell populations, *P <0.05.
Figure 5.
Figure 5.. CNAs associated with immune changes.
A, CNAs and RNA-expression of in MHC-I presentation and immune checkpoint proteins. In purple are genes involved in MHC-I presentation and in red are immune checkpoint proteins. B, Association between copy-number and gene-expression in the Abba and Lesurf cohorts of the genes shown in (A). Colored genes show a spearman correlation P < 0.1, blue indicates significance in both sets. C, Frequency of CNAs at immune-enriched loci in the Abba cohort. Significant enrichment defined by hypergeometric testing FDR < 0.1. D, Heatmaps of associations between immune signatures and copy number at loci shown in (C) in DCIS (Abba cohort), ER+ IDC (TCGA) and ER IDC (TCGA) determined by generalized linear models. (Significantly associated beta-scores are shown, P < 0.05). E, CNAs of the regions highlighted in C in the recurrence cohort.
Figure 6.
Figure 6.. Neoantigen prediction in DCIS and IDC.
(A-B), Predicted neoantigens supported by expression of the mutation in RNA-seq data in (A) Recurrence cohort and (B) Abba cohort. C, Frequency of mutation, neoantigen and rsSNP sites in the most commonly mutated genes in breast cancer in DCIS (Abba and recurrence cohorts) compared to IDC (TCGA cohort). Differences computed using proportion test *P<0.05. D, HLAs predicted to bind to the most common TP53 and PIK3CA mutant peptides in the TCGA cohort. Asterisked are HLAs predicted to recognize these peptides in the Recurrence/Abba cohort. E, Heatmap showing relative contribution of specific neoantigen to immune signaling pathways in TCGA ER+ patients using a generalized linear model (P< 0.1 shown). F, Changes in BCR repertoire diversity in DCIS and IDC in case 8 and 9. G, Changes in BCR repertoire. Only clonotypes appearing at frequency > 1% are shown, and colored clonotypes are shared between samples.

References

    1. Cowell CF, Weigelt B, Sakr RA, Ng CK, Hicks J, King TA, et al. Progression from ductal carcinoma in situ to invasive breast cancer: revisited. Molecular oncology 2013;7:859–69. - PMC - PubMed
    1. Elshof LE, Schaapveld M, Schmidt MK, Rutgers EJ, van Leeuwen FE, Wesseling J. Subsequent risk of ipsilateral and contralateral invasive breast cancer after treatment for ductal carcinoma in situ: incidence and the effect of radiotherapy in a population-based cohort of 10,090 women. Breast Cancer Res Treat 2016;159:553–63. - PMC - PubMed
    1. Gorringe KL, Hunter SM, Pang J-M, Opeskin K, Hill P, Rowley SM, et al. Copy number analysis of ductal carcinoma in situ with and without recurrence. Modern Pathology 2015;28:1174–84. - PubMed
    1. Casasent AK, Schalck A, Gao R, Sei E, Long A, Pangburn W, et al. Multiclonal Invasion in Breast Tumors Identified by Topographic Single Cell Sequencing. Cell 2018;172:205–17 e12. - PMC - PubMed
    1. Abba MC, Gong T, Lu Y, Lee J, Zhong Y, Lacunza E, et al. A Molecular Portrait of High-Grade Ductal Carcinoma In Situ. Cancer Res 2015;75:3980–90. - PMC - PubMed

Publication types

MeSH terms