. 2021 Jan 5;118(1):e2006476118.
doi: 10.1073/pnas.2006476118.

The Parkinson's disease-associated gene ITPKB protects against α-synuclein aggregation by regulating ER-to-mitochondria calcium release

Affiliations

The Parkinson's disease-associated gene ITPKB protects against α-synuclein aggregation by regulating ER-to-mitochondria calcium release

Daniel J Apicco et al. Proc Natl Acad Sci U S A. .

Abstract

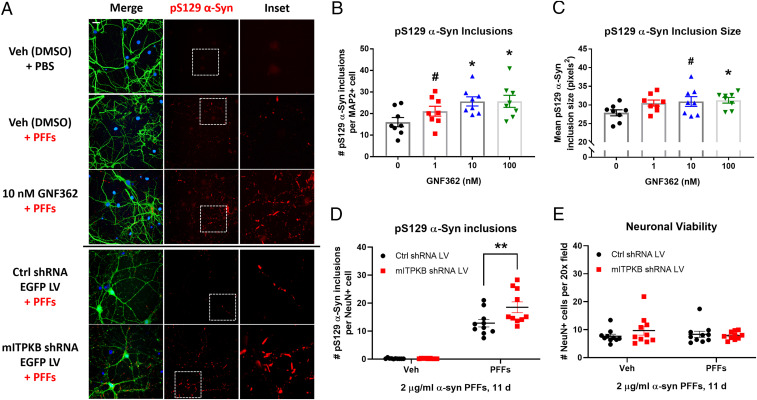
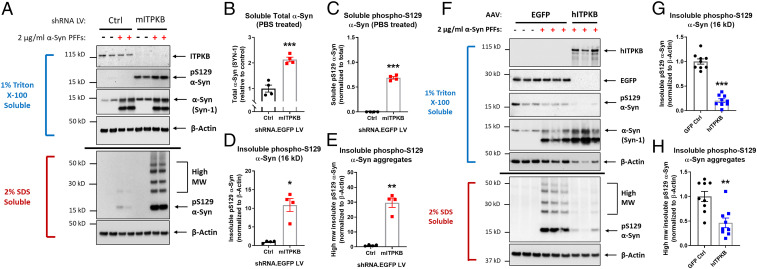
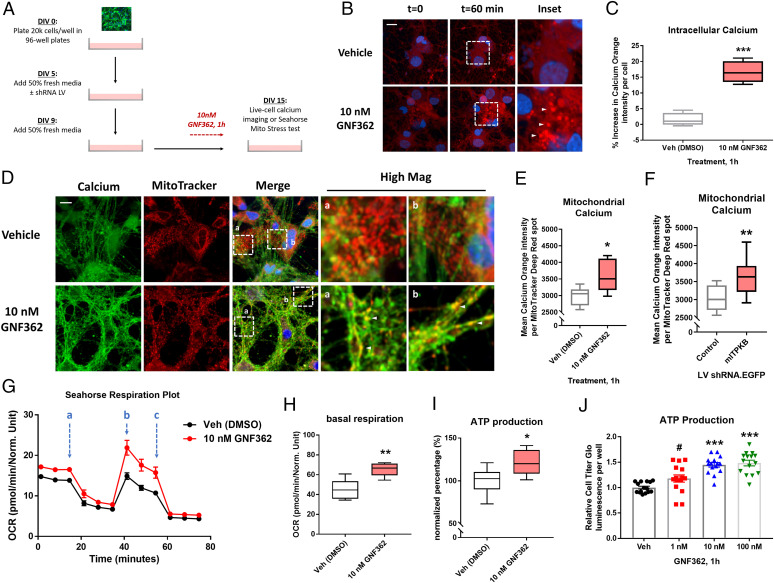
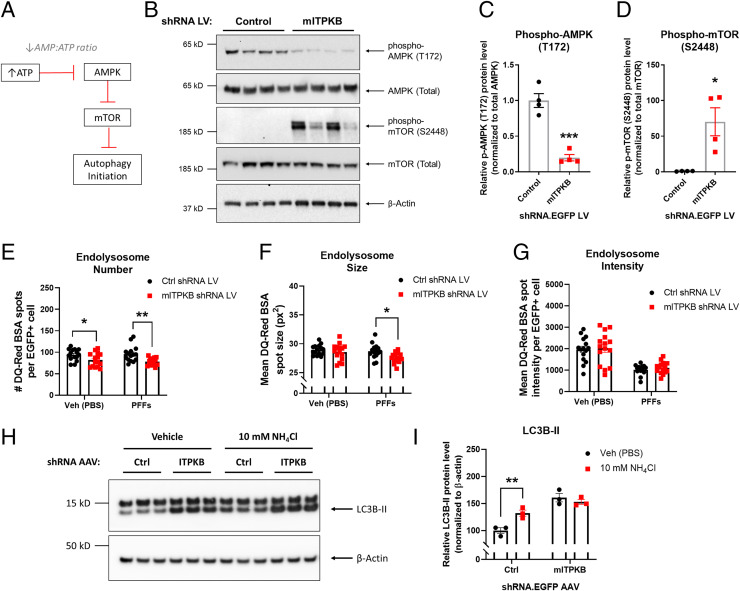
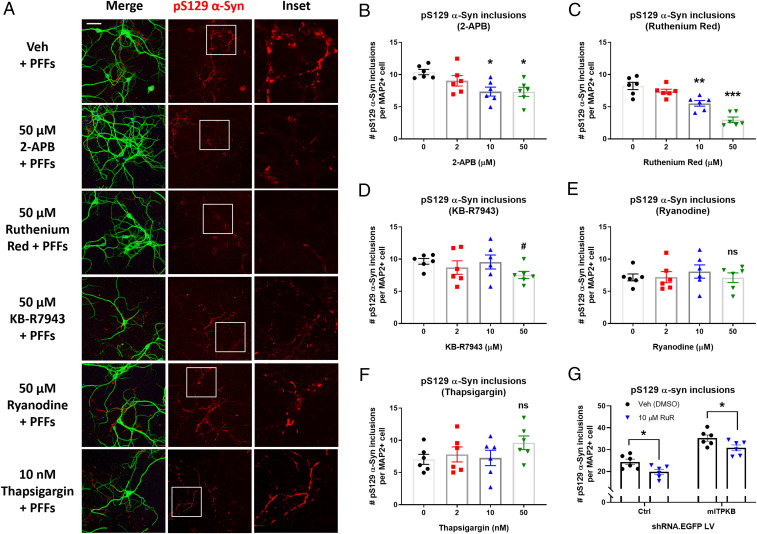
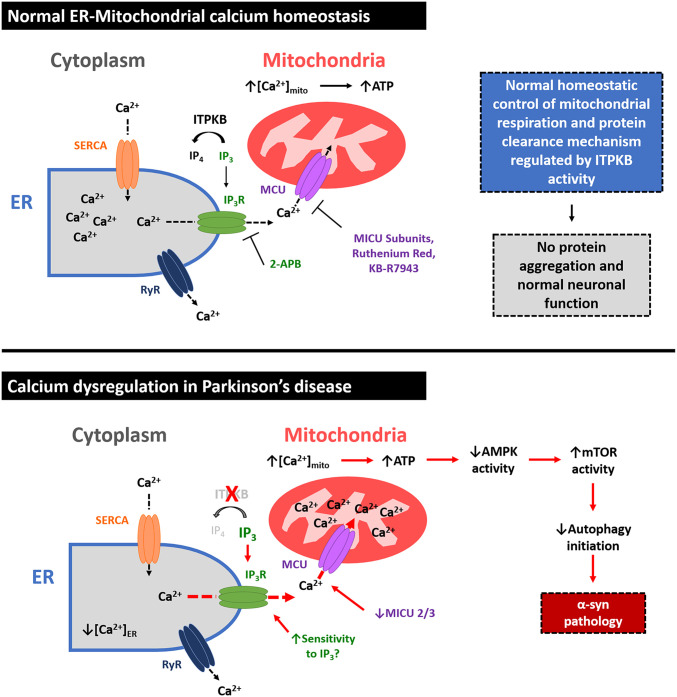
Inositol-1,4,5-triphosphate (IP3) kinase B (ITPKB) is a ubiquitously expressed lipid kinase that inactivates IP3, a secondary messenger that stimulates calcium release from the endoplasmic reticulum (ER). Genome-wide association studies have identified common variants in the ITPKB gene locus associated with reduced risk of sporadic Parkinson's disease (PD). Here, we investigate whether ITPKB activity or expression level impacts PD phenotypes in cellular and animal models. In primary neurons, knockdown or pharmacological inhibition of ITPKB increased levels of phosphorylated, insoluble α-synuclein pathology following treatment with α-synuclein preformed fibrils (PFFs). Conversely, ITPKB overexpression reduced PFF-induced α-synuclein aggregation. We also demonstrate that ITPKB inhibition or knockdown increases intracellular calcium levels in neurons, leading to an accumulation of calcium in mitochondria that increases respiration and inhibits the initiation of autophagy, suggesting that ITPKB regulates α-synuclein pathology by inhibiting ER-to-mitochondria calcium transport. Furthermore, the effects of ITPKB on mitochondrial calcium and respiration were prevented by pretreatment with pharmacological inhibitors of the mitochondrial calcium uniporter complex, which was also sufficient to reduce α-synuclein pathology in PFF-treated neurons. Taken together, these results identify ITPKB as a negative regulator of α-synuclein aggregation and highlight modulation of ER-to-mitochondria calcium flux as a therapeutic strategy for the treatment of sporadic PD.

Keywords: Parkinson’s disease; calcium signaling; genetics; mitochondria; α-synuclein.


Conflict of interest statement

Competing interest statement: E.S., C.L.N., D.T.T., E.G., J.W.N., C.M.B., Y.C., K.E.G., N.A.A., G.C.K., E.A.T., J.G., Y.L., A.W., J.A.H., H.R., and W.D.H. are employees of Biogen. D.J.A., L.T.D., and K.-D.H.N. were employed at Biogen at the time the work was performed but are now employed at AbbVie, Alnylam, and Gemini Therapeutics, respectively.

Figures

Fig. 1.
Fig. 1.
ITPKB inhibition increases α-syn pathology induced by preformed fibrils. (A) Representative images of DIV 20 neurons immunostained for pS129 α-syn (red), the neuronal marker MAP2 (Top, green), and DAPI (blue); LV-transduced cells are labeled with EGFP expressed from the same virus as the shRNAs (Bottom). Scale bar, 10 µm. (B) Quantification of the number of pS129 α-syn inclusions per MAP2-positive cell in A. #P = 0.1501; *P = 0.0197 (10 nM); *P = 0.0193 (100 nM) by one-way ANOVA with Dunnett’s post hoc test (versus the 0 nM treatment group); n = 8 wells/group. (C) Quantification of the mean pS129 α-syn inclusion size in GNF362-treated cultures in A. #P = 0.0806; *P = 0.0473 by one-way ANOVA with Dunnett’s post hoc test (versus the 0 nM treatment group); n = 8 wells/group. (D) Quantification of the number of pS129 α-syn inclusions per NeuN-positive cell in cells transduced with control (Ctrl) or mITPKB shRNA LV from A. **P = 0.0035 by two-way ANOVA with Sidak’s post hoc test; n = 10 wells/group. (E) Quantification of the number of NeuN-positive cells per 20× field in cells transduced with Ctrl or mITPKB shRNA LV from A. Note that no toxicity was observed for either the mITPKB shRNA LV or treatment with PFFs. All figures shown are representative examples of the experiments repeated at least three times in independent cultures of primary neurons with different plate layouts. All bar graphs represent the mean ± SEM.
Fig. 2.
Fig. 2.
ITPKB expression level regulates the accumulation of insoluble α-syn aggregates. (A) A representative immunoblot of primary neurons transduced with control (Ctrl) or mITPKB shRNA LV and treated with 2 µg/mL murine α-syn PFFs for 11 d followed by biochemical fractionation into 1% Triton X-100 soluble (Upper, blue) and insoluble (2% SDS soluble, Lower, red) fractions. The samples were probed for levels of ITPKB, β-Actin (loading control), total α-syn (SYN-1), and pS129 α-syn. (B, C) Quantification of relative total (SYN-1) and pS129 α-syn in the soluble fraction of neurons transduced with Ctrl or mITPKB shRNA LV. Note that the SYN-1 antibody also detects murine PFFs present in each sample; therefore, total and pS129 α-syn pathology in the soluble fraction was only quantified for the samples not treated with PFFs (PBS treated). ***P < 0.001 by unpaired Student’s t test; n = 4 wells/group. (D, E) Quantification of relative monomeric (16 kDa, D) and sum of the mutimeric (high-mw pS129 α-syn aggregates, E) pS129 α-syn levels present in the 2% SDS fraction of neurons transduced with Ctrl or mITPKB shRNA LV and treated with PFFs. *P = 0.0105; **P = 0.0028 by Student’s t test; n = 4 wells/group. (F) Representative immunoblots of neurons transduced with GFP (Ctrl) or hITPKB expressing AAVs and treated with 2 µg/mL murine α-syn PFFs for 11 d followed by biochemical fractionation. The samples were probed for levels of ITPKB, β-Actin (loading control), and total (SYN-1) and pS129 α-syn. (G, H) Quantification of the relative levels of both the monomeric (16 kDa, G) and mutimeric (high-mw, H) pS129 α-syn bands in the 2% SDS fraction of PFF-treated neurons from F. ***P < 0.001; **P = 0.0016 by Student’s t test; n = 9 wells/group. All figures shown are representative examples of experiments repeated at least three times in independent cultures of primary neurons with different plate layouts. The bar graphs represent the mean ± SEM.
Fig. 3.
Fig. 3.
ITPKB inhibition increases mitochondrial calcium levels and ATP production. (A) A diagram of experimental design for live-cell calcium imaging and respiration experiments in primary neurons treated with GNF362 or transduced with LVs. (B) Representative images of Calcium Orange AM dye fluorescence intensity following 1 h treatment with 10 nM GNF362. (C) Quantification of the mean percent increase in Calcium Orange AM dye fluorescence intensity per DAPI+ cells at t = 60 min compared to t = 0. ***P < 0.001 by unpaired Mann–Whitney U test; n = 6 wells/group. (D) Representative images of Calcium Orange AM dye (shown in green to highlight colocalization) and MitoTracker Deep Red (red) fluorescence in DIV 15 cultures treated with 10 nM GNF362 for 1 h. (E) Quantification of mean Calcium Orange AM fluorescence intensity per MitoTracker Deep Red–positive spot in D. *P = 0.0411 by unpaired Mann–Whitney U test; n = 6 wells/group. (F) Quantification of mean Calcium Orange AM fluorescence intensity per MitoTracker Deep Red–positive spot in cultures transduced with control or mITPKB shRNA LV. **P = 0.0036 by unpaired Mann–Whitney U test; n = 12 wells/group. (G) A representative respiration plot of cultures analyzed by the Seahorse XF Mito Stress Test following pretreatment with vehicle (DMSO, black line) or 10 nM GNF362 (red line). The OCR was measured over time starting at baseline and following sequential treatment with 1 µM oligomycin (A), 1.5 µM FCCP (B), and 0.5 µM antimycin/rotenone (C). (HI) Quantification of baseline OCR (H) and total ATP production (I) from G. **P = 0.0043; *P = 0.0118 by two-tailed Mann–Whitney U test; n = 6 wells/group. All box and whisker plots represent median ± interquartile range (box) from minimum to maximum (whiskers). (J) The total cellular ATP levels measured by relative Cell Titer Glo luminescence per well following 1 h treatment with GNF362. ***P < 0.001; #P = 0.0853 by one-way ANOVA with Tukey’s post hoc test; n = 15 wells/group. The bar graphs represent mean ± SEM. All Seahorse respiration experiments were repeated at least three times in independent cultures of primary neurons with different plate layouts (SI Appendix, Fig. S6 I and J).
Fig. 4.
Fig. 4.
ITPKB knockdown inhibits autophagy initiation and flux via AMPK and mTOR. (A) A diagram of AMPK-mediated inhibition of mTOR under conditions of high levels of AMP relative to ATP. Note that a decrease in the AMP:ATP ratio disinhibits mTOR by reducing AMPK activity. (B) Representative immunoblots of phosphorylated (T172) and total AMPK, phosphorylated (S2448) and total mTOR, and β-Actin in DIV 20 neurons transduced with control (Ctrl) or mITPKB shRNA LV. (C, D) Quantification of levels of phospho-T172 AMPK (C) and phospho-S2448 mTOR (D) in B. ***P = 0.0003; *P = 0.0124 by unpaired Student’s t test; n = 4 wells/group. The bar graphs represent the mean ± SEM. (EG) Quantification of the endolysosome number (E), size (F), and intensity (G) in DIV 20 neurons transduced with Ctrl shRNA LV or mITPKB shRNA LV and incubated with 4 µg/mL DQ-Red BSA for 6 h prior to live-cell imaging. The cells were treated with 2 µg/mL PFFs or vehicle (Veh [PBS]) for 11 d. *P < 0.05; **P = 0.0033 by two-way ANOVA with Sidak’s post hoc test; n = 15 wells/group. (H) A representative immunoblot of LC3B and β-Actin in Ctrl or mITPKB shRNA AAV–transduced neurons (DIV 14) treated with 10 mM NH4Cl for 6 h to induce autophagy. (I) Quantification of relative LC3B-II levels normalized to Ctrl shRNA AAV + Veh (PBS) group equal to 100 in H. **P = 0.0099 by two-way ANOVA with Sidak’s post hoc test; n = 3 wells/group. All experiments in this figure were repeated at least twice in independent cultures of primary neurons. The bar graphs represent the mean ± SEM.
Fig. 5.
Fig. 5.
Inhibition of the IP3 receptor or mitochondrial calcium uniporter reduces α-syn pathology induced by PFFs. (A) Representative images of pS129 α-syn (red), MAP2 (green), and DAPI (blue) immunocytochemistry of neurons pretreated with vehicle (Veh [DMSO]), 2-APB (IP3R inhibitor), Ruthenium Red (MCU inhibitor), KB-R7943 (MCU inhibitor), Ryanodine (RyR inhibitor), or Thapsigargin (SERCA inhibitor) for 1 h on DIV 9, followed by cotreatment with 2 µg/mL α-syn PFFs for 8 d. (Scale bar, 20 μm.) (BF) Quantification of the number of pS129 α-syn inclusions per MAP2+ cell in A for cells treated with 2-APB (B), Ruthenium Red (C), KB-R7943 (D), Ryanodine (E), or Thapsigargin (F). #P = 0.2077; *P < 0.05; **P = 0.0011; ***P = 0.0001 by one-way ANOVA with Dunnett’s post hoc test; n = 6 wells/group. (G) The number of pS129 α-syn inclusions per MAP2+ cell in Ruthenium Red (RuR)-treated neurons transduced with Ctrl shRNA LV or mITPKB shRNA LV for 11 d. *P < 0.05 by one-way ANOVA with Sidak’s post hoc test; n = 6 wells/group. The experiments with RuR were repeated four times in independent primary neuron cultures with different plate layouts. The bar graphs represent the mean ± SEM.
Fig. 6.
Fig. 6.
Cellular model for ITPKB function in PD. In healthy neurons (Top), the ER is the predominant storage organelle for intracellular calcium (Ca2+), which is transiently released in response to various upstream signaling events to mediate diverse cellular functions. ER Ca2+ can be released through either the IP3R or the Ryanodine receptor (RyR), while the ER-cytosol Ca2+ gradient is preserved by SERCA. In response to increases in intracellular IP3 levels, Ca2+ is released from the ER via IP3Rs, leading to Ca2+ accumulation in mitochondria mediated by transport into the inner mitochondrial matrix via the mitochondrial calcium uniporter (MCU). Transient increases in mitochondrial calcium levels ([Ca2+]mito) drive the production of ATP from ADP by oxidative phosphorylation. ITPKB enzymatic activity negatively regulates IP3-mediated ER calcium release by converting IP3 to IP4, thereby protecting cells from overproduction of ATP and accumulation of ROS. The MCU subunits MICU1, MICU2, and MICU3 serve as Ca2+ sensors to control homeostatic levels of Ca2+ import into mitochondria. In PD (Bottom), loss of ITPKB activity, changes in MCU regulatory subunit composition, and/or chronic increases in intracellular IP3 levels or sensitivity of IP3Rs to IP3 may contribute to increased [Ca2+]mito, leading to ROS generation, mTOR activity, and the accumulation of misfolded proteins, including α-syn aggregates. Pharmacological agents that positively modulate ITPKB activity or inhibit ER-to-mitochondria calcium exchange may represent a new therapeutic approach for the treatment of synucleinopathies such as PD.

References

    1. Goedert M., Alzheimer’s and Parkinson’s diseases: The prion concept in relation to assembled Aβ, tau, and α-synuclein. Science 349, 1255555 (2015). - PubMed
    1. Bonifati V., Genetics of Parkinson’s disease. Minerva Med. 96, 175–186 (2005). - PubMed
    1. Duyckaerts C., et al. , Seeding and propagation of lesions in neurodegenerative diseases: A new paradigm. Bull. Acad Natl. Med. 199, 809–819 (2015). - PubMed
    1. Peelaerts W., Bousset L., Baekelandt V., Melki R., ɑ-synuclein strains and seeding in Parkinson’s disease, incidental Lewy body disease, dementia with Lewy bodies and multiple system atrophy: Similarities and differences. Cell Tissue Res. 373, 195–212 (2018). - PubMed
    1. Bandres-Ciga S., Diez-Fairen M., Kim J. J., Singleton A. B., Genetics of Parkinson’s disease: An introspection of its journey towards precision medicine. Neurobiol. Dis. 137, 104782 (2020). - PMC - PubMed

Publication types

MeSH terms

Substances