. 2021 Jan 5;118(1):e2013349118.
doi: 10.1073/pnas.2013349118. Epub 2020 Dec 21.

Stochastic dynamics of barrier island elevation

Affiliations

Stochastic dynamics of barrier island elevation

Orencio Durán Vinent et al. Proc Natl Acad Sci U S A. .

Abstract

Barrier islands are ubiquitous coastal features that create low-energy environments where salt marshes, oyster reefs, and mangroves can develop and survive external stresses. Barrier systems also protect interior coastal communities from storm surges and wave-driven erosion. These functions depend on the existence of a slowly migrating, vertically stable barrier, a condition tied to the frequency of storm-driven overwashes and thus barrier elevation during the storm impact. The balance between erosional and accretional processes behind barrier dynamics is stochastic in nature and cannot be properly understood with traditional continuous models. Here we develop a master equation describing the stochastic dynamics of the probability density function (PDF) of barrier elevation at a point. The dynamics are controlled by two dimensionless numbers relating the average intensity and frequency of high-water events (HWEs) to the maximum dune height and dune formation time, which are in turn a function of the rate of sea level rise, sand availability, and stress of the plant ecosystem anchoring dune formation. Depending on the control parameters, the transient solution converges toward a high-elevation barrier, a low-elevation barrier, or a mixed, bimodal, state. We find the average after-storm recovery time-a relaxation time characterizing barrier's resiliency to storm impacts-changes rapidly with the control parameters, suggesting a tipping point in barrier response to external drivers. We finally derive explicit expressions for the overwash probability and average overwash frequency and transport rate characterizing the landward migration of barriers.

Keywords: Barrier islands; coastal dunes; master equation; stochastic dynamics.


Conflict of interest statement

The authors declare no competing interest.

Figures

Fig. 1.
Fig. 1.
(A) Simplified dynamics of barrier elevation. Extreme HWEs, i.e., large storms, erode the mature dunes that define a high-elevation barrier, along with the dune-building vegetation; whereas frequent low-intensity HWEs disrupt after-storm dune recovery and keep the island in a low-elevation bare state. Sand supply increases dune growth and promotes a high-elevation state. Sea level rise promotes a low barrier by increasing plant stress and reducing the availability of dry sand. Examples of high and low barriers are from Virginia. (B) Geometrical description of coastal dunes where xc is the cross-shore position of dune crest h. Image is from Cedar Lakes, TX.
Fig. 2.
Fig. 2.
Color plots of the temporal evolution of the PDF (f(ξ,t)) of rescaled barrier elevation ξ after an overwash (Eqs. 7 and 8) for different rescaled HWE frequencies λ0+=λ0Td (columns) and rescaled mean HWE intensities ξc=S¯/(rH) (rows) (values shown on top and left, respectively). Solid lines show the expected values ξ¯(t). The regions of the parameter space corresponding to a high, low, and mixed (bimodal PDF) barrier are highlighted. Arrows on bottom and right show the effects of changing maximum dune size (H), dune growth time (Td), and frequency (λ0) and intensity (i.e., mean size S¯) of HWEs.
Fig. 3.
Fig. 3.
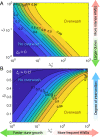
Contour lines of the mean excursion time T¯l within the low-elevation mode, also identified as the mean after-storm recovery time, rescaled by the dune formation time Td, as a function of the two control parameters. Regions corresponding to resilient high barriers (T¯l1), vulnerable low barriers (T¯l10), and mixed (bimodal) barriers are highlighted. The white region corresponds to λ0+e1/ξc where T¯l and thus dunes never recover. Arrows show the effects of dune and HWEs characteristics on the control parameters (see Fig. 2 for more details).
Fig. 4.
Fig. 4.
(A and B) Contour lines of the probability per of an overwash taking place before dune recovery, as a function of the control parameters λ0+ and ξc for an initial dune size ξ0=0 (A) and a function of λ0+ and the initial dune size ξ0 for ξc=0.15 (B). Arrows show the effects of dune and HWEs characteristics on the control parameters (see Fig. 2 for more details).

References

    1. Duran O., Moore L. J., Vegetation controls on the maximum size of coastal dunes. Proc. Natl. Acad. Sci. U.S.A. 110, 17217–17222 (2013). - PMC - PubMed
    1. Durán Vinent O., Moore L. J., Barrier island bistability induced by biophysical interactions. Nat. Clim. Change 5, 158–162 (2015).
    1. Rinaldo T., Ramakrishnan K. A., Rodriguez-Iturbe I., Durán Vinent O., Probabilistic structure of events controlling the after-storm recovery of coastal dunes. Proc. Natl. Acad. Sci. U.S.A., 10.1073/pnas.2013254118 (2020). - DOI - PMC - PubMed
    1. Rodriguez-Iturbe I., Porporato A., Ridolfi L., Isham V., Coxi D. R., Probabilistic modelling of water balance at a point: The role of climate, soil and vegetation. Proc. R. Soc. A. Math. Phys. Eng. Sci. 455, 3789–3805 (1999).
    1. Moore L. J., Vinent O. D., Ruggiero P., Vegetation control allows autocyclic formation of multiple dunes on prograding coasts. Geology 44, 559–562 (2016).

Publication types

LinkOut - more resources