. 2021 Jan 5;118(1):e2021096118.
doi: 10.1073/pnas.2021096118.

Adipose tissue is a critical regulator of osteoarthritis

Affiliations

Adipose tissue is a critical regulator of osteoarthritis

Kelsey H Collins et al. Proc Natl Acad Sci U S A. .

Abstract

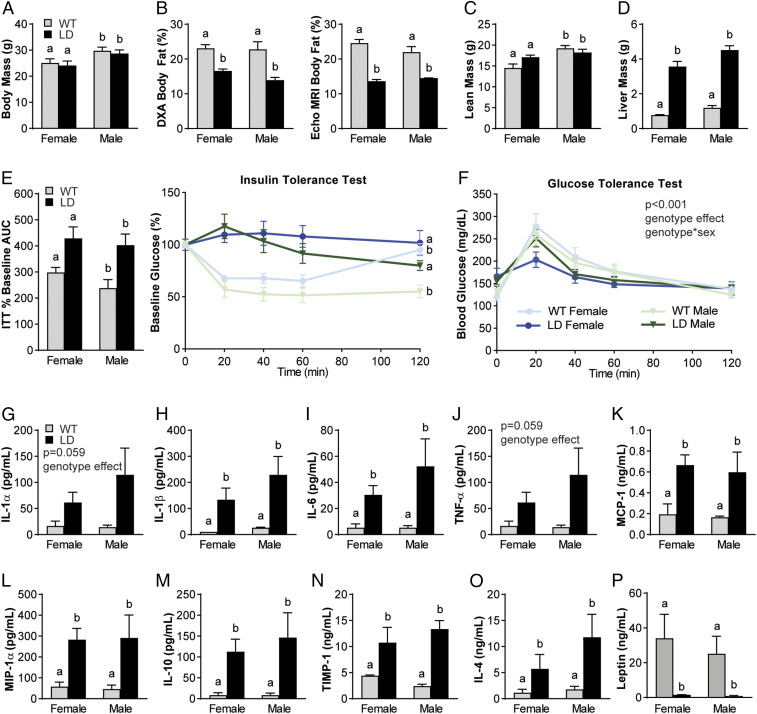
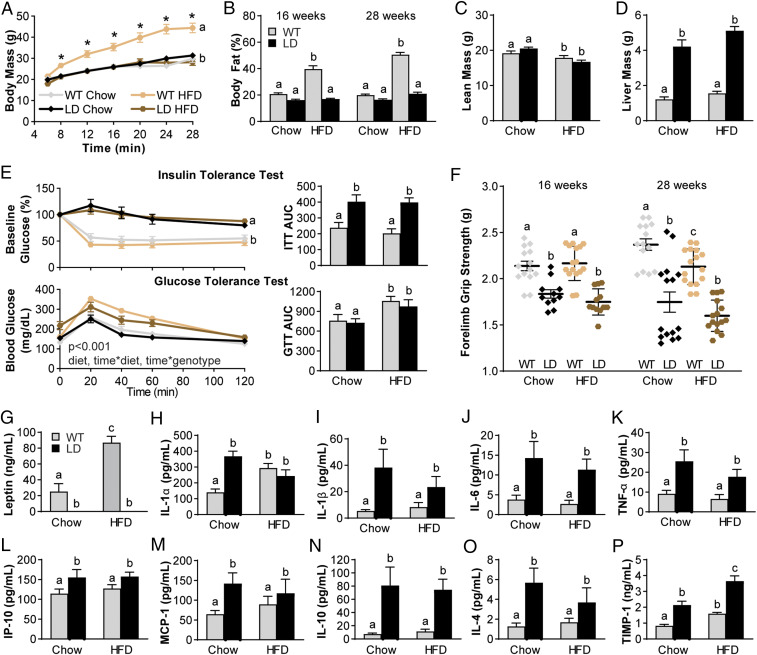
Osteoarthritis (OA), the leading cause of pain and disability worldwide, disproportionally affects individuals with obesity. The mechanisms by which obesity leads to the onset and progression of OA are unclear due to the complex interactions among the metabolic, biomechanical, and inflammatory factors that accompany increased adiposity. We used a murine preclinical model of lipodystrophy (LD) to examine the direct contribution of adipose tissue to OA. Knee joints of LD mice were protected from spontaneous or posttraumatic OA, on either a chow or high-fat diet, despite similar body weight and the presence of systemic inflammation. These findings indicate that adipose tissue itself plays a critical role in the pathophysiology of OA. Susceptibility to posttraumatic OA was reintroduced into LD mice using implantation of a small adipose tissue depot derived from wild-type animals or mouse embryonic fibroblasts that undergo spontaneous adipogenesis, implicating paracrine signaling from fat, rather than body weight, as a mediator of joint degeneration.

Keywords: adipocyte; leptin; muscle weakness; subchondral bone sclerosis; systemic inflammation.


Conflict of interest statement

The authors declare no competing interest.

Figures

Fig. 1.
Fig. 1.
Male and female LD mice demonstrate metabolic dysfunction and increased proinflammatory mediators in serum when compared to WT littermate controls. (AC) LD mice have similar body mass (A) but decreased body fat when measured by DXA and Echo MRI (B) and similar lean mass (C) to same-sex WT littermates. (D and E) LD mice demonstrated increased liver mass (D), insulin-tolerance tests (E, Right), and AUC of insulin-tolerance tests (E, Left). (F) Glucose tolerance demonstrated a significant main effect of genotype and genotype × sex. (GO) Regardless of sex, LD mice demonstrated increased serum proinflammatory (IL-1α, IL-1β, IL-6, TNF-α, MCP-1, MIP-1α) and increased antiinflammatory mediators (IL-10, TIMP-1, and IL-4) compared to WT littermate controls. (P) LD mice demonstrated near-zero levels of leptin in serum. P < 0.05 between groups is indicated by the letters “a” and “b” (n = 7 to 15 per group for AF; n = 3 for female WT; n = 4 to 7 for other groups for GO serum outcomes; analysis by two-way ANOVA with Sidak or Tukey’s post hoc). ITT, insulin-tolerance test.
Fig. 2.
Fig. 2.
LD mice fed a chow diet demonstrate reduced activity and muscle weakness, despite consuming similar amounts of food and water as WT controls. (AG) Using indirect calorimetry, LD mice demonstrate reduced oxygen consumption (A), energy expenditure (B), respiratory exchange ratio (C), and CO2 production (D) but similar hourly food (E), water (F), and overall average energy balance (G). (H and I) LD mice demonstrated lower locomotory (H) and ambulatory (I) activity. No differences were observed by sex, so data were pooled by genotype for comparison. (J) A sex-specific deficit in forelimb grip strength at 16 and 28 wk, operationalizing muscle strength, was observed in LD mice compared to WT controls. P < 0.05 between groups is indicated by the letters “a,” “b,” and “c” (n = 7 to 16 per group; A–I, general linear modeling using the CalR web-based tool; (J), three-way ANOVA with Dunnet’s post hoc).
Fig. 3.
Fig. 3.
LD mice are protected from spontaneous and posttraumatic OA. (A, B, D, and E) At 28 wk, both male and female LD mice demonstrated improvements in Modified Mankin Score (A and D) (black arrows indicate cartilage lesion) and, when challenged with DMM to induce posttraumatic OA, demonstrated similar scores to their contralateral nonsurgical limbs (B and E) (black indicates nonsurgical contralateral limb; red indicates DMM limb). (B, C, F, and G) LD male and female mice did demonstrate significant increases in synovitis post DMM (C and F) but similar osteophyte scores compared to WT controls. (H) 3D bone renderings of surface and morphology reveal that LD and WT DMM limbs demonstrate boney outgrowth around the medial meniscus and thicker trabeculae in LD mice at the tibial metaphysis (yellow arrows indicate areas of interest). (I) LD genotype drove increases in tibial plateau BMD and BV/TV, as well BMD and BV/TV in tibial metaphyses. (J) LD mice demonstrated protections from the onset of paw allodynia on the DMM limb, measured by Electronic Von Frey paw-withdrawal assay, and hyperalgesia at the knee, measured by SMALGO. Data were analyzed as two- or three-way ANOVA with either Sidak, Tukey’s, or Dunnet post hoc (n = 5 to 15 per group). P < 0.05 between groups is indicated by the letters “a,” “b,” and “c.” gCaHA/cm3, grams of calcium hydroxyapatite per cubic centimeter. Scale bar indicates 100 μm.
Fig. 4.
Fig. 4.
HFD feeding of LD mice does not increase the metabolic derangement. (A and B) Body mass (A) and body fat (B) over time were only increased in WT animals fed HFD but not LD fed HFD. (C and D) Lean mass was decreased in both groups fed HFD (C), but liver mass was increased in LD mice to a similar extent even on HFD when compared to WT (D). (E) Insulin resistance by insulin-tolerance test was not affected by HFD, and differences were only observed by genotype, as in the AUC. Glucose sensitivity was reduced by HFD, as indicated in the AUC. (F) Muscle weakness was also decreased in LD mice and, at 28 wk, decreased in HFD-fed WT animals when compared to their 16-wk time point. (G) Serum leptin was increased in WT animals fed HFD but still completely absent in LD mice regardless of diet. (HM) Levels of proinflammatory mediators that were elevated in LD mice were not further elevated by HFD (IL-1α, IL-1β, IL-6, TNF-α, IP-10, MCP-1). (NP) Levels of antiinflammatory mediators IL-10 and IL-4 were similarly not increased by HFD in LD mice, but TIMP-1 was significantly increased. Data were analyzed as two- or three-way ANOVA with either Sidak, Tukey’s, or Dunnet post hoc (n = 10 to 18 per group). P < 0.05 between groups is indicated by the letters “a,” “b,” and “c.” GTT, glucose-tolerance test; ITT, insulin-tolerance test.
Fig. 5.
Fig. 5.
HFD feeding does not override protection from posttraumatic OA in LD mice. (A and B) WT HFD-fed male and female animals demonstrated increased Modified Mankin Scores when compared to both chow WT DMM limbs and contralateral nonsurgical controls (black indicates nonsurgical contralateral limb; red indicates DMM limb). Regardless of diet or DMM surgery, LD mice demonstrated similar Modified Mankin Scores to their nonsurgical contralateral limbs. (C) HFD-fed LD mice did demonstrate a trend toward a reduction in synovitis in the DMM limb. (D) Both HFD WT and LD mice demonstrated increased osteophyte scores in the DMM limb. (E) 3D bone images from knee joint microCT and trabeculae from tibial metaphysis, bony outgrowth, and trabecular thickness (areas of interest indicated with yellow arrows). (F and G) Genotype drove the differences in BMD and BV/TV of medial tibial plateau and tibial metaphyses. (H and I) LD mice on both diets demonstrated protection from reduced paw-withdrawal threshold measured by Electronic Von Frey, and the onset of knee joint hyperalgesia measured by SMALGO, compared to WT controls in DMM limbs. (J and K) SF levels for antiinflammatory mediators IL-10 and TIMP-1 were similar by joint, genotype, and diet. (LN) Reductions were observed in DMM LD joint SF levels for LIF and TARC. For remaining SF profiles, see SI Appendix. Data were analyzed as two- or three-way ANOVA with either Sidak, Tukey, or Dunnet post hoc tests (n = 10 to 18 per group). P < 0.05 between groups is indicated by the letters “a,” “b,” and “c.” gCaHA/cm3, grams of calcium hydroxyapatite per cubic centimeter. Scale bar indicates 100 μm.
Fig. 6.
Fig. 6.
Transplantation of fat restores susceptibility to OA damage and partially corrects the metabolic derangement in LD mice. (A) Both WT mature adipose (WF-R) transplant and primary mouse embryonic fibroblast (MEF-R) transplant in LD mice restores increased Modified Mankin Scores in DMM limbs (black arrows indicate areas of cartilage damage and proteoglycan loss; black symbols indicate nonsurgical contralateral limb, red symbols indicate DMM limb). Osteophyte scores were significantly increased in MEF-rescue animals compared to the other groups in DMM limbs. Synovitis scores were similar across groups in DMM limbs. (B) Medial plateau BMD and BV/TV in contralateral limb were reduced to WT levels in MEF-rescue animals only; WT fat-rescue animals’ DMM limbs demonstrated significant reductions in BV/TV to WT levels. (C) Both transplant types restored susceptibility to knee hyperalgesia but not paw allodynia in the DMM limb; forelimb grip strength was also restored to WT levels in both transplant groups. (D) Restoration of activity levels was also observed in both transplant groups. (E and F) While both fat transplant groups demonstrated overall improvements in insulin resistance, the AUC was not significantly different from the LD mice. (G) WT fat-rescue, however, significantly improved glucose tolerance. (H) Leptin ELISA demonstrated that both fat transplant groups reintroduce circulating leptin levels to LD mice. (I) Serum levels for IL-10 were reduced in both transplant groups compared to LD mice, but serum TIMP-1 was only reduced in WT fat-rescue mice. Other proinflammatory mediators (IL-6, TNF-α, IL-1α) were also improved in transplant mice, whereas IL-17 was significantly elevated. (J) SF levels for IL-10 were similar across groups, whereas TIMP-1 levels in the DMM limbs were elevated to WT levels in MEF-rescue LD mice. SF levels for IL-6 and IL-1α were increased in WT fat-rescue and MEF-rescue animal DMM limbs. Data were analyzed as one-, two-, or three-way ANOVA with either Sidak, Tukey’s, or Dunnet post hoc tests (n = 7 to 18 per group). P < 0.05 between groups is indicated by the letters “a,” “b,” and “c.” gCaHA/cm3, grams of calcium hydroxyapatite per cubic centimeter; ITT, insulin-tolerance test. Scale bar indicates 100 μm.

Comment in

  • Adipose tissue triggers OA.
    Clarke J. Clarke J. Nat Rev Rheumatol. 2021 Mar;17(3):130. doi: 10.1038/s41584-021-00579-1. Nat Rev Rheumatol. 2021. PMID: 33504928 No abstract available.

References

    1. Berenbaum F., Griffin T. M., Liu-Bryan R., Review: Metabolic regulation of inflammation in osteoarthritis. Arthritis Rheumatol. 69, 9–21 (2017). - PMC - PubMed
    1. Collins K. H., et al. , Obesity, metabolic syndrome, and musculoskeletal disease: Common inflammatory pathways suggest a central role for loss of muscle integrity. Front. Physiol. 9, 112 (2018). - PMC - PubMed
    1. Collins K. H., et al. , Relationship between inflammation, the gut microbiota, and metabolic osteoarthritis development: Studies in a rat model. Osteoarthritis Cartilage 23, 1989–1998 (2015). - PubMed
    1. Collins K. H., Reimer R. A., Seerattan R. A., Leonard T. R., Herzog W., Using diet-induced obesity to understand a metabolic subtype of osteoarthritis in rats. Osteoarthritis Cartilage 23, 957–965 (2015). - PubMed
    1. Tang R., et al. , Gene therapy for follistatin mitigates systemic metabolic inflammation and post-traumatic arthritis in high-fat diet-induced obesity. Sci. Adv. 6, eaaz7492 (2020). - PMC - PubMed

Publication types

MeSH terms

LinkOut - more resources